Intrinsic Value AnalyzerThe Intrinsic Value Analyzer is an all-in-one valuation tool that automatically calculates the fair value of a stock using industry-standard valuation techniques. It estimates intrinsic value through Discounted Cash Flow (DCF), Enterprise Value to Revenue (EV/REV), Enterprise Value to EBITDA (EV/EBITDA), and Price to Earnings (P/EPS). The model features adjustable parameters and a built-in alert system that notifies investors in real time when valuation multiples reach predefined thresholds. It also includes a comprehensive, color-coded table that compares the company’s historical average growth rates, valuation multiples, and financial ratios with the most recent values, helping investors quickly assess how current values align with historical averages.
The model calculates the historical Compounded Annual Growth Rates (CAGR) and average valuation multiples over the selected Lookback Period. It then projects Revenue, Earnings Before Interest, Taxes, Depreciation, and Amortization (EBITDA), Earnings per Share (EPS), and Free Cash Flow (FCF) for the selected Forecast Period and discounts their future values back to the present using the Weighted Average Cost of Capital (WACC) or the Cost of Equity. By default, the model automatically applies the historical averages displayed in the table as the growth forecasts and target multiples. These assumptions can be modified in the menu by entering custom REV-G, EBITDA-G, EPS-G, and FCF-G growth forecasts, as well as EV/REV, EV/EBITDA, and P/EPS target multiples. When new input values are entered, the model recalculates the fair value in real time, allowing users to see how changes in these assumptions affect the company’s fair value.
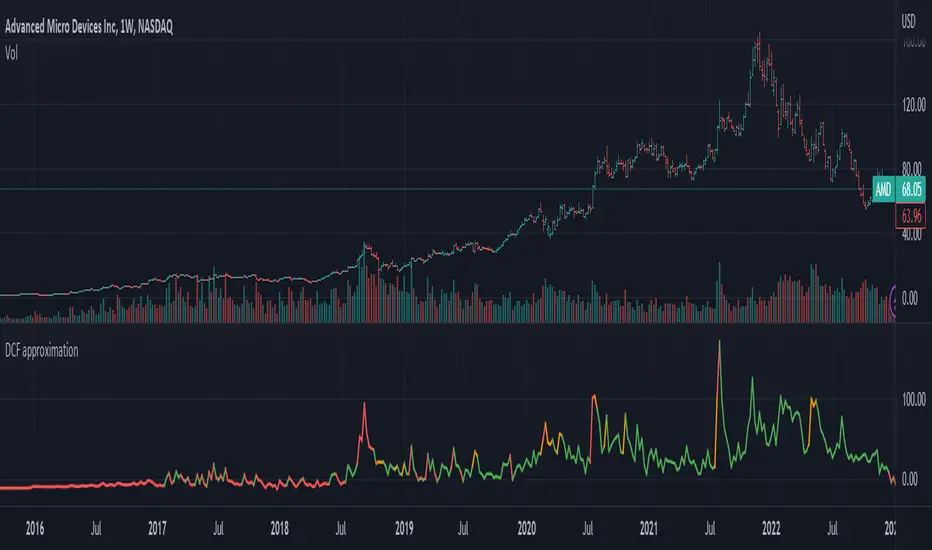
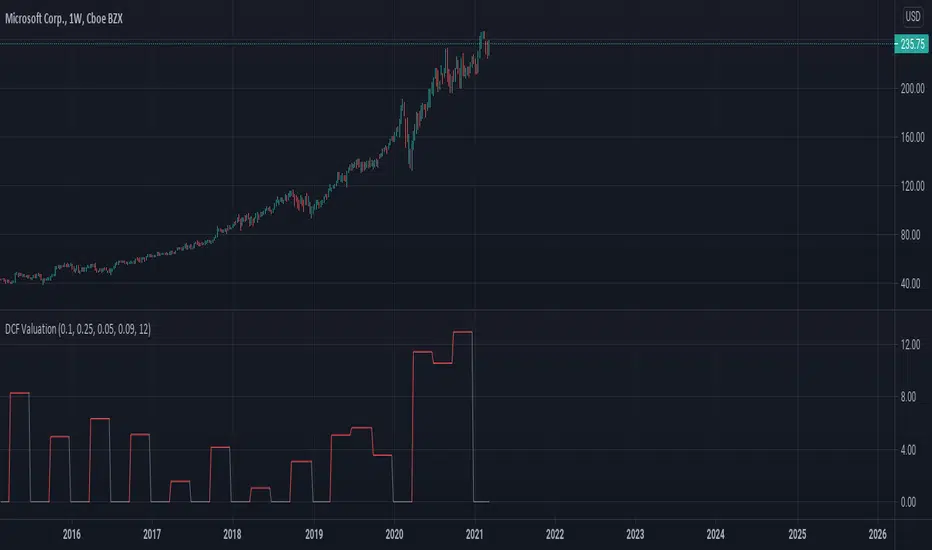
DCF = (Sum of (FCF × (1 + FCF-G) ^ t ÷ (1 + WACC) ^ t) for each year t until Forecast Period + ((FCF × (1 + FCF-G) ^ Forecast Period × (1 + LT Growth)) ÷ ((WACC - LT Growth) × (1 + WACC) ^ Forecast Period)) + Cash - Debt - Preferred Equity - Minority Interest) ÷ Shares Outstanding
EV/REV = ((Revenue × (1 + REV-G) ^ Forecast Period × EV/REV Target) ÷ (1 + WACC) ^ Forecast Period + Cash - Debt - Preferred Equity - Minority Interest) ÷ Shares Outstanding
EV/EBITDA = ((EBITDA × (1 + EBITDA-G) ^ Forecast Period × EV/EBITDA Target) ÷ (1 + WACC) ^ Forecast Period + Cash - Debt - Preferred Equity - Minority Interest) ÷ Shares Outstanding
P/EPS = (EPS × (1 + EPS-G) ^ Forecast Period × P/EPS Target) ÷ (1 + Cost of Equity) ^ Forecast Period
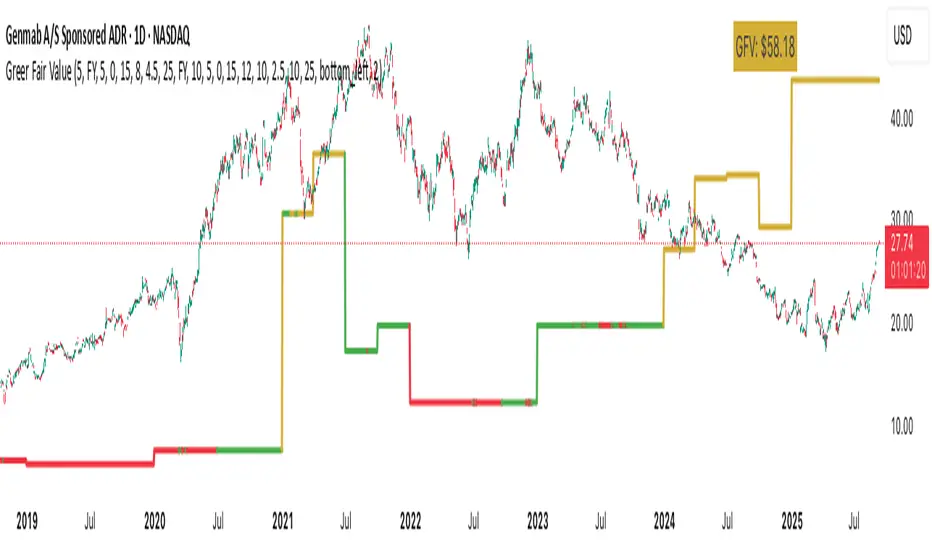
The discounted one-year average analyst price target (1Y PT) is also displayed alongside the valuation labels to provide an overview of consensus estimates. For the DCF model, the terminal long-term FCF growth rate (LT Growth) is based on the selected country to reflect expected long-term nominal GDP growth and can be modified in the menu. For metrics involving FCF, users can choose between reported FCF, calculated as Cash From Operations (CFO) - Capital Expenditures (CAPEX), or standardized FCF, calculated as Earnings Before Interest and Taxes (EBIT) × (1 - Average Tax Rate) + Depreciation and Amortization - Change in Net Working Capital - CAPEX. Historical average values displayed in the left column of the table are based on Fiscal Year (FY) data, while the latest values in the right column use the most recent Trailing Twelve Month (TTM) or Fiscal Quarter (FQ) data. The indicator displays color-coded price labels for each fair value estimate, showing the percentage upside or downside from the current price. Green indicates undervaluation, while red indicates overvaluation. The table follows a separate color logic:
REV-G, EBITDA-G, EPS-G, FCF-G = Green indicates positive annual growth when the CAGR is positive. Red indicates negative annual growth when the CAGR is negative.
EV/REV = Green indicates undervaluation when EV/REV ÷ REV-G is below 1. Red indicates overvaluation when EV/REV ÷ REV-G is above 2. Gray indicates fair value.
EV/EBITDA = Green indicates undervaluation when EV/EBITDA ÷ EBITDA-G is below 1. Red indicates overvaluation when EV/EBITDA ÷ EBITDA-G is above 2. Gray indicates fair value.
P/EPS = Green indicates undervaluation when P/EPS ÷ EPS-G is below 1. Red indicates overvaluation when P/EPS ÷ EPS-G is above 2. Gray indicates fair value.
EBITDA% = Green indicates profitable operations when the EBITDA margin is positive. Red indicates unprofitable operations when the EBITDA margin is negative.
FCF% = Green indicates strong cash conversion when FCF/EBITDA > 50%. Red indicates unsustainable FCF when FCF/EBITDA is negative. Gray indicates normal cash conversion.
ROIC = Green indicates value creation when ROIC > WACC. Red indicates value destruction when ROIC is negative. Gray indicates positive but insufficient returns.
ND/EBITDA = Green indicates low leverage when ND/EBITDA is below 1. Red indicates high leverage when ND/EBITDA is above 3. Gray indicates moderate leverage.
YIELD = Green indicates positive shareholder return when Shareholder Yield > 1%. Red indicates negative shareholder return when Shareholder Yield < -1%.
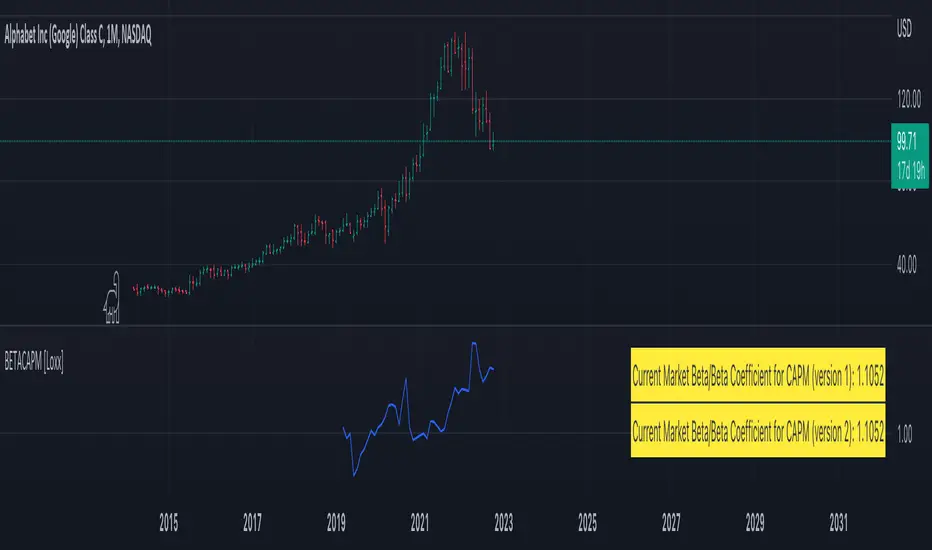
The Return on Invested Capital (ROIC) is calculated as EBIT × (1 - Average Tax Rate) ÷ (Average Debt + Average Equity - Average Cash). Shareholder Yield (YIELD) is calculated as the CAGR of Dividend Yield - Change in Shares Outstanding. The Weighted Average Cost of Capital (WACC) is displayed at the top left of the table and is derived from the current Market Cap (MC), Debt, Cost of Equity, and Cost of Debt. The Cost of Equity is calculated using the Equity Beta, Index Return, and Risk-Free Rate, which are based on the selected country. The Equity Beta (β) is calculated as the 5-year Blume-adjusted beta between the weekly logarithmic returns of the underlying stock and the selected country’s stock market index. For accurate calculations, it is recommended to use the stock ticker listed on the primary exchange corresponding to the company’s main index.
Cost of Debt = (Interest Expense on Debt ÷ Average Debt) × (1 - Average Tax Rate)
Cost of Equity = Risk-Free Rate + Equity Beta (β) × (Index Return - Risk-Free Rate)
WACC = (MC ÷ (MC + Debt)) × Cost of Equity + (Debt ÷ (MC + Debt)) × Cost of Debt
This indicator works best for operationally stable and profitable companies that are primarily valued based on fundamentals rather than speculative growth, such as those in the industrial, consumer, technology, and healthcare sectors. It is less suitable for early-stage, unprofitable, or highly cyclical companies, including energy, real estate, and financial institutions, as these often have irregular cash flows or distorted balance sheets. It is also worth noting that TradingView’s financial data provider, FactSet, standardizes financial data from official company filings to align with a consistent accounting framework. While this improves comparability across companies, industries, and countries, it may also result in differences from officially reported figures.
In summary, the Intrinsic Value Analyzer is a comprehensive valuation tool designed to help long-term investors estimate a company’s fair value while comparing historical averages with the latest values. Fair value estimates are driven by growth forecasts, target multiples, and discount rates, and should always be interpreted within the context of the underlying assumptions. By default, the model applies historical averages and current discount rates, which may not accurately reflect future conditions. Investors are therefore encouraged to adjust inputs in the menu to better understand how changes in these key assumptions influence the company’s fair value.
DCF
Greer Fair Value✅ Greer Fair Value
Greer Fair Value: Graham intrinsic value + Buffett-style DCF with auto EPS/FCF and auto growth (CAGR of FCF/share), defaulting to a simple GFV badge that color-codes opportunity at a glance.
📜 Full description
Greer Fair Value is inspired by the valuation frameworks of Benjamin Graham and Warren Buffett. It combines Graham’s rate-adjusted intrinsic value with a two-stage, per-share DCF. The script auto-populates EPS (TTM) and Free Cash Flow per share (FY/FQ/TTM) from request.financial(), and can auto-estimate the near-term growth rate (g₁) using the CAGR of FCF/share over a user-selected lookback (with sensible caps). All assumptions remain editable.
Default view: only the GFV badge is shown to keep charts clean.
Badge color logic:
Gold — both DCF and Graham fair values are above the current price
Green — exactly one of them is above the current price
Red — the current price is above both values
Show more detail (optional):
Toggle “Show Graham Lines” and/or “Show DCF Lines” to plot fair values (and optional MoS bands) over time.
Toggle “Show Dashboard” for a compact data table of assumptions and outputs.
Optional summary label can be enabled for a quick on-chart readout.
Inputs you can customize: EPS source/manual fallback, FCF/share source (FY/FQ/TTM), g₁ auto-CAGR lookback & caps, terminal growth gT, discount rate r, MoS levels, step-style plots, table position, and decimals.
Note: TradingView’s UI controls whether “Inputs/Values in Status Line” are shown. If you prefer a clean status line, open the indicator’s settings and uncheck those options, then Save as default.
Disclaimer: For educational/informational purposes only; not financial advice. Markets involve risk—do your own research.
Stock's Intrinsic Value| DCF modelScript Description
This pine script is based on a YouTube video titled: Warren Buffett: How to Calculate the Intrinsic Value of a Stock. Warren Buffett is a famous value investor who follows the principles of his mentor Benjamin Graham. He looks for companies that have strong competitive advantages, consistent earnings, and low debt. He also considers the intrinsic value of a company, which is the present value of its future cash flows, and compares it to the market price. He prefers to buy stocks that are trading below their intrinsic value and hold them for a long time.
One of the methods that Buffett uses to estimate the intrinsic value of a company is the discounted cash flow (DCF) model. This involves projecting the free cash flow (FCF) of the company for several years and then discounting it back to the present using an appropriate discount rate. The discount rate is usually the weighted average cost of capital (WACC) of the company, which reflects its cost of equity and debt. The sum of the discounted FCFs and terminal value is the intrinsic value of the company.
Lastly, a margin of safety is included when using the DCF method for stock valuation because of uncertainty and error in estimating future cash flows and the intrinsic value of the company.
When the current price is below margin of safety, it means that the stock is currently undervalued and being price at significantly below its intrinsic value.
Guideline for determining each variable in this script
FCF growth rate: This is the annual rate at which the free cash flow (FCF) of the company is expected to grow over a forecast 10-year period. You can use historical FCF growth rates, industry averages, analyst estimates, or your assumptions to project the FCF growth rate. The higher the FCF growth rate, the higher the intrinsic value will be.
Discount rate: This is the rate of return that you require to invest in the company. It reflects the risk and opportunity cost of investing in the company. You can use the weighted average cost of capital (WACC) of the company, capital pricing model (CAPM), hurdle rate, or market rate as the discount rate. The lower the discount rate, the higher the intrinsic value.
The margin of safety: Provides a cushion against errors in the valuation or adverse events that may affect the company. The margin of safety depends on your personal preference and risk tolerance. Normally is at 15% - 30%, the higher the margin of safety you set, the lower the chance that the stock will hit that level.
How to use this script
Step 1: This script only works for stocks that have financial data of free cash flow and total common shares outstanding
Step 2: Please use a yearly chart (12-month chart)
Step 3: You are required to determine a growth rate that will grow the free cash flow 10 years into the future
Step 4: You are required to determine a discount rate for the calculations
Step 5: You are required to add a margin of safety (Accounting for uncertainty)
Step 6: The rest of the calculations will be done automatically.
Disclaimer when using this script
I'm not a financial advisor
This script is for education purposes only
There are risks involved with stock market investing and investors should not act upon the content or information found here without first seeking advice from an accountant, financial planner, lawyer or other professional.
I can’t guarantee that this script will be error-free as I still consider myself a Pinescript beginner
Before making any decisions, investors should always research companies individually
I'll not be liable for any loss incurred, arising from the use of, or reliance on, this script
Limitations of this script
This script only works on the yearly chart (12 monthly charts)
The intrinsic value of a company will be negative if the company have a negative forecasted free cash flow
You need to make an educated guess about the growth rate, discount rate and margin of safety
This script uses free cash flow instead of owner's earnings (Operating cash flow - Maintenance capital expenditure), therefore it can't accurately estimate the maintenance capital expenditure.
Need at least 6 years’ worth of financial data
Market capitalisation uses total common shares outstanding multiplied by the closing price instead of using company-level total outstanding shares multiplied by the closing price
DCF ApproximationThe indicator for calculating and visualizing the Discounted Cash Flow (DCF) for a selected stock.
It uses the Weighted Average Cost of Capital (WACC) with a margin of safety and the Free Cash Flow (FCF) calculation for cash flow analysis. The DCF is calculated by summing the discounted annual FCFs over a 10-year period.
The chart color depends on the value of the current price percentage - it turns red when the market price is over valuation, yellow around a fair value, and green for the price under valuation.
This is an early version of the indicator, so I would appreciate your suggestions for improving the code and formulas.
Market Beta/Beta Coefficient for CAPM [Loxx]Market Beta/Beta Coefficient for CAPM is not so much an indicator as it is a value to be used in future indicators to forecast stock prices using the Capital Asset Pricing Model, CAPM. CAPM is used by the likes of value investors such as Warren Buffet and valuation/accounting/investment banking firms. More specifically, CAPM is typically used in Discounted Cashflow Analysis to value revenue generating assets.
What is Beta?
In finance, the beta (β or market beta or beta coefficient) is a measure of how an individual asset moves (on average) when the overall stock market increases or decreases. Thus, beta is a useful measure of the contribution of an individual asset to the risk of the market portfolio when it is added in small quantity. Thus, beta is referred to as an asset's non-diversifiable risk, its systematic risk, market risk, or hedge ratio. Beta is not a measure of idiosyncratic risk.
By definition, the value-weighted average of all market-betas of all investable assets with respect to the value-weighted market index is 1. If an asset has a beta above (below) 1, it indicates that its return moves more (less) than 1-to-1 with the return of the market-portfolio, on average. In practice, few stocks have negative betas (tending to go up when the market goes down). Most stocks have betas between 0 and 3.
How to calculate Beta
To calculate beta you typically choose 5 years of monthly data; typically SPY is used here
Calculate log returns of both the asset for which you are calculating Beta and the benchmark market data
Calculation the covariance between the asset and benchmark
Calculate the variance of the benchmark returns
Divide the covariance by the variance
Read more here:
en.wikipedia.org(finance)
en.wikipedia.org
einvestingforbeginners.com
DCF ValuationAn indicator that can be used to study Discounted Cash Flow Valuation for stocks.
When the reported Free Cash Flow for a company is non-positive the line turns gray. Red color means the market price is higher than the valuation whereas green color means the market price is below the valuation and it might be a good opportunity for value traders.