FlowTrinity - Crypto Dominance Rotation IndexFlowTrinity — Crypto Dominance Rotation Index
(Tracks BTC / Stablecoin / Altcoin dominance flows with standardized oscillators)
⚪ Overview
FlowTrinity decomposes total crypto market structure into three capital-flow regimes — BTC dominance, Stablecoin dominance, and Altcoin dominance — each normalized into oscillator form. Additionally, a fourth histogram tracks Total Market Cap expansion/contraction relative to BTC+Stable capital, revealing underlying rotation pressure not visible in raw dominance charts.
Each component is standardized through SMA/STD normalization, producing smoothed 0–100 style oscillations that highlight overbought/oversold rotation extremes, risk-on/risk-off transitions, and capital cycle inflection zones.
⚪ Flow Components
Stablecoin Dominance Oscillator —White line
Measures the combined USDT + USDC share of market dominance.
High values indicate increased hedging behavior or sidelined capital.
Low values coincide with renewed risk appetite and capital deployment into crypto assets.
Altcoin Dominance Oscillator — Orange Line
Tracks the share of liquidity rotating into altcoins (Total – BTC – Stable).
Rising values indicate broad market expansion and speculative activity.
Falling values reflect flight-to-safety or concentration back into majors.
BTC Dominance Oscillator — Purple line(off by default
Normalized BTC dominance revealing transitions between Bitcoin-led markets and altcoin-led cycles. Useful for identifying BTC absorption phases vs. altcoins dispersion regimes.
Total–BTC–Stable MarketCap Difference Histogram — histogram
A normalized histogram of total market cap change minus BTC+Stable market cap change.
• Positive → altcoin segment expanding
• Negative → capital retreating into BTC or stables
Acts as a structural layer confirming or contradicting dominance-based signals.
Normalization Logic
All flows use SMA + standard deviation scaling (lookback 7 / smoothing 7), enabling consistent comparison across unrelated dominance and market-cap metrics.
⚪ Use Cases
• Identify shifts between BTC-led and alt-led markets
• Detect early signs of liquidity rotation
• If Stablecoin OSC is oversold, liquidity may soon rotate to BTC or Altcoins, signaling potential price moves.
• If Stablecoin OSC is overbought and Altcoin OSC is oversold, it can indicate an early buying opportunity in Altcoins.
• Watching these oscillator positions helps spot early market rotations and plan entries or exits.
snapshot
Disclaimer
This indicator is for educational and informational purposes only and does not constitute financial advice or investment guidance. Cryptocurrency trading involves significant risk; you are solely responsible for your trading decisions, based on your financial objectives and risk tolerance. The author assumes no liability for any losses arising from the use of this tool.
Dominancebtc

BTC Dominance Trend CheckerThis monitors the Bitcoin dominance (BTC.D) in the market. It retrieves the current and previous day's BTC dominance values, determines whether dominance is increasing or decreasing, and visually displays the trend.
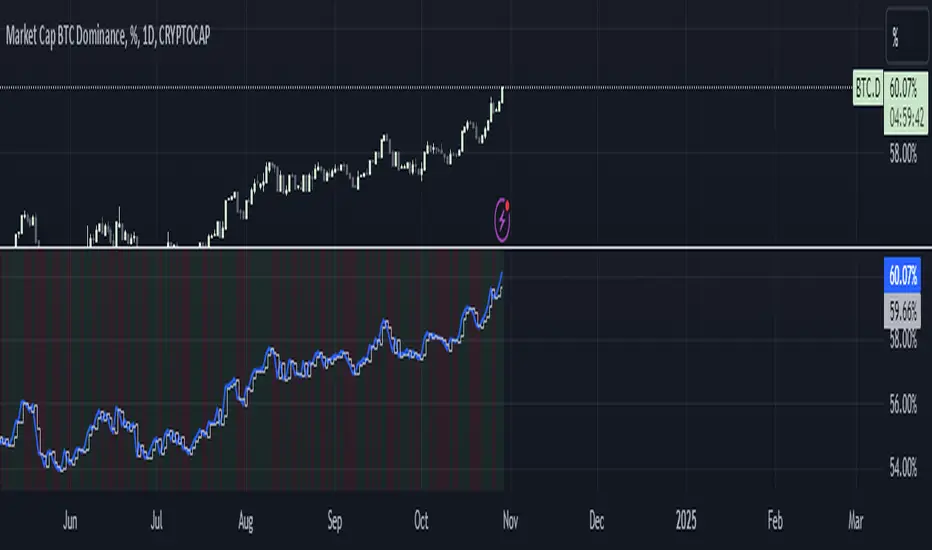
BTC Dominance Exclude Stablecoins(USDT, USDC, DAI)This index's goal is to show the true bitcoin dominance relative to other risky crypto assets, excluding the diluting effects of those ever-increasing stablecoin(USDT, USDC, DAI)'s market cap. In this index, we can see the BTC dominance has been solid increasing & construct bottom during recent fear/bear.
Xiaolai Chen
Sept 14th 2022

3GBH BTC DOM vs MCBitcoin Market Cap vs Dominance
- data normalized with RSI
Included in this indicator:
- RSI of BTC Market Cap
- RSI of BTC Dominance
- EMA of BTC Market Cap
- EMA of BTC Domiance
-----
Dominance influences the market. Is money flowing into Bitcoin?
-----
EMA's to help with Technical Analysis.
-----
User-friendly.
You can change all the inputs, they are labelled for ease-of-use.
You can toggle On/Off any or all of the options.

BTC Dominance & Counter-Trend IndicatorThis script looks at BTC dominance in price-action and scores it (out of the last 100 closed bars). Essentially this looks at the price action of the current security/crypto and tracks whether it traded in-trend with BTC or against the trend with BTC to show when BTC is most prominently dominating.
Currently the code is restricted to the previous 100 trades prior to the bar (you can change this) but only because, for whatever reason, pine scripting doesn't actually allow you to calculate the number of bars currently in the view (lots of people asking for this via StackOverflow but no response yet). Essentially every bar shows the number of trades out of the last 100 that traded in-synch with BTC, the lower the number, the less dominant BTC has been against that security.
Green highlight means it traded positive (upwards) against BTC going down, and red means it traded negative against BTC going up.

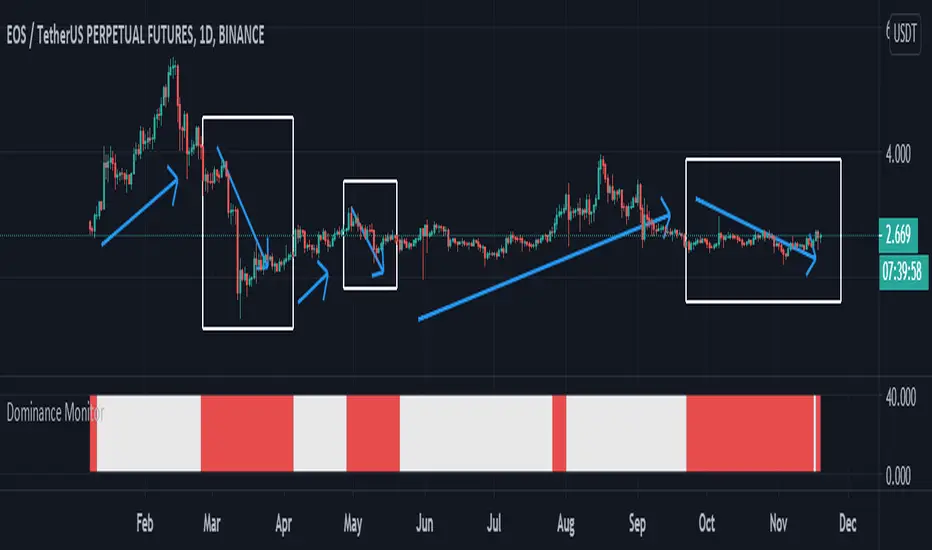
Dominance Monitoralways a trader must check the bitcoins Dominance and if its ok can make a deal on AltCoins
this indicator Monitor the BTC.D and check the trend with ATR and give you results
please just check it in 1D timeframe
when the color was white you can easily trade and if the color was red you should be aware the risk and rest or maybe close the deals
BINANCE:EOSUSDT
be our guest