BPR [Gold Group]✨ BPR Indicator – Gold Group
The BPR (Breakout–Pullback–Reversal) Indicator by Gold Group is a premium, research-based market tool designed to help traders identify high-probability trading opportunities with precision. Built on advanced price-action logic and institutional behavior analysis, this indicator highlights key market zones where smart-money activity is most likely to occur—allowing traders to enter the market with confidence and clarity.
🔍 What the BPR Indicator Does
Detects Breakout Zones where liquidity is taken and momentum shifts begin.
Marks Pullback Levels where the market retests institutional footprints.
Identifies Reversal Points with high accuracy for powerful entries.
Filters out market noise, showing only meaningful structure changes.
Works on all timeframes and all major assets such as Gold, Forex, NAS100, US30, Crypto.
🔥 Why This Indicator Is Important
Helps traders understand institutional price movement, not retail traps.
Reduces emotional decision-making by giving crystal-clear levels.
Increases trade accuracy by aligning entries with market structure shifts.
Saves time by automatically plotting areas where smart money reacts.
🎯 Why You Should Use It
Perfect for both beginners and professionals.
Suitable for scalping, intraday, and swing trading.
Developed and tested by Gold Group Research Team with proven performance.
Allows traders to stay ahead of manipulative moves and avoid fake breakouts
Educational

Traffic Lights - BETA ZONESTraffic Lights - BETA ZONES
Overview
The Traffic Light indicator is a simple, visual tool designed to help traders gauge market bias, trend strength, and momentum at a glance. It displays three rows of colored dots (like a traffic light) in a separate pane below your chart:
• Green: Bullish signal (go/buy bias).
• Red: Bearish signal (stop/sell bias).
• Orange: Neutral or caution (mixed/uncertain conditions).
This indicator combines price action (via EMA positioning), trend direction (via RSI), and momentum expansion (via RSI + MACD histogram) to provide a layered view of the market. When all three rows align as green or red, it generates Buy or Sell labels on the main chart for potential entry signals.
It's non-repainting in its core logic (Row 2 uses delayed RSI comparison to avoid noise), making it reliable for live trading. Best used on trending markets like forex, stocks, or crypto on timeframes from 15M to Daily.
How It Works
The indicator evaluates three independent "rows" of conditions, each represented by a colored dot:
1. Row 1: Price Action Signal (EMA Touch) This row assesses the overall trend bias based on price's position relative to a slow EMA (default: 50-period).
o Green: Price is cleanly above the EMA (bullish bias).
o Red: Price is cleanly below the EMA (bearish bias).
o Orange: Price is "touching" or within a volatility buffer around the EMA (neutral/caution). The "touch zone" is defined by ATR padding, which can be toggled off for a stricter (green/red only) mode.
2. Row 2: Buyers/Sellers Trend (RSI) This row tracks the underlying trend of buyer/seller strength using RSI (default: 14-period on close). To reduce noise and repainting, it uses a delayed comparison (RSI vs. RSI ):
o Green: RSI is rising (buyers gaining strength).
o Red: RSI is falling (sellers gaining strength). No orange here—it's purely directional.
3. Row 3: Buyers/Sellers Signal (RSI + MACD Histogram) This row focuses on momentum expansion, requiring alignment across RSI zones and MACD histogram:
o Green: RSI > 50 (bull zone), MACD hist > 0 (positive), and histogram is expanding upward.
o Red: RSI < 50 (bear zone), MACD hist < 0 (negative), and histogram is expanding downward.
o Orange: Any mismatch (e.g., pullbacks, consolidations, or weak momentum). MACD defaults: Fast=12, Slow=26, Signal=9.
Signals
• Buy Signal: Triggers a "Buy" label below the bar when all three rows turn green for the first time (crossover from non-aligned).
• Sell Signal: Triggers a "Sell" label above the bar when all three rows turn red for the first time. These are conservative signals—use them for trend confirmation or entries in alignment with your strategy. They don't repaint once fired.
Inputs & Customization
All inputs are grouped for easy tweaking:
• Row 1: Price Action Signal
o Slow EMA Length (default: 50): Adjusts the trend baseline.
o EMA Timeframe (default: empty/current): Use a higher timeframe (e.g., "240" for 4H) for multi-timeframe analysis.
o Enable Orange 'Touch' Zone (default: true): Toggle for strict (green/red only) vs. touch mode.
o ATR Length (default: 3): Volatility period for touch padding.
o Touch Padding (ATR mult, default: 0.15): Widens the orange buffer; set to 0 for wick-touch only.
• Row 2: Buyers/Sellers Trend (RSI)
o RSI Length (default: 14): Period for RSI calculation.
o RSI Source (default: close): Change to high/low/open for different sensitivities.
• Row 3: Buyers/Sellers Signal (RSI + MACD hist)
o MACD Fast/Slow/Signal Lengths (defaults: 12/26/9): Standard MACD settings.
Usage Tips
• Trend Trading: Wait for all-green for long entries or all-red for shorts. Use in conjunction with support/resistance.
• Scalping/Intraday: Enable orange touch zone for more nuance in choppy markets; disable for cleaner signals in trends.
• Multi-Timeframe: Set Row 1 EMA to a higher TF for "big picture" bias while keeping others on current.
• Risk Management: Always combine with stop-losses (e.g., below recent lows for buys). Backtest on your asset/timeframe.
• Limitations: In ranging markets, orange dots may dominate—pair with volatility filters like ADX. Not a standalone system; use as a confirmation tool.
If you have feedback or suggestions, drop a comment below! Happy trading 🚦

Smart Money ProSmart Money Pro V 8.1 is an advanced trading indicator that tracks institutional "smart money" movements using multiple Smart Money Concepts (SMC) techniques:
Market Structure: Identifies Change of Character (CHoCH), Break of Structure (BOS), and Internal/External Market Structure (IDM)
Order Blocks: Detects demand/supply zones including EXT OB, IDM OB, SCOB, and mitigation/breaker blocks
Order Flow: Tracks major and minor order flows with mitigation levels
Fair Value Gaps (FVG): Highlights price inefficiencies and imbalance zones
Liquidity Levels: Maps liquidity sweeps and key pivot levels
Price Structure: Shows OTE (Optimal Trade Entry) zones, PDH/PDL (Previous Day High/Low), equilibrium levels, and swing sweeps
Candle Patterns: Detects Inside and Outside bars
The indicator helps traders identify institutional entry/exit points, liquidity grabs, and high-probability trading zones.
Smart Money Pro V 8.1 هو مؤشر متقدم لتتبع تحركات المؤسسات المالية "الأموال الذكية" باستخدام مفاهيم Smart Money Concepts (SMC):
هيكل السوق: يحدد تغيير الاتجاه (CHoCH)، كسر الهيكل (BOS)، والهيكل الداخلي/الخارجي (IDM)
مناطق الطلب والعرض: يكتشف Order Blocks بأنواعها (EXT OB, IDM OB, SCOB) ومناطق الاختراق والتخفيف
تدفق الأوامر: يتتبع التدفقات الرئيسية والثانوية مع مستويات التخفيف
فجوات القيمة العادلة (FVG): يبرز مناطق عدم الكفاءة السعرية وعدم التوازن
مستويات السيولة: يرسم مصائد السيولة والنقاط المحورية الرئيسية
هيكل السعر: يعرض مناطق OTE (نقاط الدخول المثلى)، أعلى/أدنى سعر سابق (PDH/PDL)، مستويات التوازن، وكسر القمم/القيعان
أنماط الشموع: يكتشف شموع Inside و Outside Bar

CRT MTF + HTF Candles - Milana TradesCRT MTF + HTF Candles is an educational tool that helps you visualize higher-timeframe CRT and HTF candles on your intraday chart
The script automatically tracks key HTF levels and shows three types of CRT events:
1. Pending CRT
When a higher-timeframe candle breaks the previous high or low, the indicator marks this as a “pending” CRT.
This helps you see potential liquidity grabs and where price is currently trapped inside the HTF range
2. Completed CRT
A CRT becomes “completed” when price reaches the opposite side of the previously broken level
3. Invalid CRT
If price closes outside the HTF range before completion, the CRT is marked as invalid.
This helps you identify failed breaks and possible reversals.
Multi-Timeframe HTF Candles
The script draws clean higher-timeframe candles directly on your lower timeframe chart.
Each candle includes:
Body and wicks
HTF open & close
Swing high/low markers
Timeframe labels
Optional timers (showing time remaining in the candle)
Optional imbalances (FVG / volume imbalance)
Optional Midpont line (0.5)
HTF candle spacing
You can adjust candle width, spacing, and alignment so HTF candles fit nicely over lower-TF bars.
Gaps & Imbalances
The tool can highlight:
Fair value gaps
Volume imbalance
Swing Sweep line
When price tried update swing but closed inside the candle cange
Equlibrium line (Midpoint 0.5)
Timeframe tags & timers
Shows clear labels for each HTF candle
You can choose which timeframes to show (1H, 2H, 4H, Daily, etc.) and how many candles should be displayed
Trade smart, stay disciplined, and keep improving every day
Enjoy :)

Quantum Trend MatrixThe Quantum Trend Matrix (QTM) is a comprehensive technical analysis suite designed to solve the problem of market noise by combining Statistical Volatility Structure with Momentum Trend Filtration.
Many traders struggle because they trade momentum signals (like crossovers) without considering the daily structural limits of the market. This script integrates these two concepts into a single "Roadmap" to help traders align their entries with institutional price structure.
🎯 Concept & Methodology (How it Works)
This script is not merely a collection of indicators; it is a logic-based system where components effectively filter one another:
1. Structural Volatility Levels (The "Map")
Unlike standard Support/Resistance which is subjective, QTM calculates objective levels based on the internal logic.
Methodology: The script applies specific percentage-based volatility coefficients (tailored to the asset class, e.g., Indices ,Commodities,etc) to the Price.
* The Green Line (Breakout Level) : Represents the statistical upper volatility limit above which a "Bullish Expansion" is expected to occur.
* The Red Line (Breakdown Level): Represents the statistical lower volatility limit Below which a "Bearish Expansion" is expected to occur.
* Why this is useful: It prevents traders from chasing trends in the "chop zone" (between the lines) and highlights high-probability breakout areas.
2. The Value Zone (Trend Validation)
* Methodology: This utilizes a High-Timeframe moving average ribbon logic (calculated using Daily data).
* Function: It acts as a dynamic trend filter. A breakout signal (Green Line cross) is statistically significant if the Price is also supported by the Value Zone (Blue Ribbon). If the Ribbon is Orange, a bullish breakout is likely a "False Trap".
3. Momentum & Exhaustion Logic
* Crossovers (Circles): Validates short-term trend shifts using smoothed exponential average crossovers.
* Mean Reversion (Diamonds): Uses an integrated Oscillator Momentum logic to detect over-extended price action. A Diamond signal warns that the price has deviated too far from the mean (VWAP) and trend continuation is risky.
🛠️ Practical Application
This script is designed for a top-down decision process:
1. Wait for Structure: For Trending Moves do not trade inside the Pivot (Blue) to Breakout (Green/Red) range. This is the "Noise" zone.
2. Confirm the Breakout: Wait for a candle to CLOSE outside the Green or Red volatility levels or to take Support/Resistance from Red/Green Levels respectively.
3. Check the "Value Zone": Ensure the background ribbon color matches the breakout direction (Blue for Long, Orange for Short).
4. Monitor Health: Use the bottom-right panel (displaying RSI, ADX, and DI metrics) to ensure trend strength is sufficient to sustain the move.
⚠️ Disclaimer & Risk Disclosure
* Logic Disclosure: While the specific volatility coefficients and smoothing lengths are proprietary, this script relies on standard technical analysis concepts including Moving Averages, RSI, ADX, and Percentage-based levels relative to the Price.
* No Guarantee: Technical analysis is probabilistic, not predictive. Past performance does not guarantee future results.
* Risk Management: Always use Stop Losses. This tool is an aid for analysis, not a replacement for risk management.
🔒 Access Information
This is a proprietary Invite-Only script.
*(Note: Do not ask for access in the comments below. Please refer to the author's signature or profile for more information).*

SYMBOL NOTES - UNCORRELATED TRADING GROUPSWrite symbol-specific notes that only appear on that chart. Organized into 6 uncorrelated groups for safe multi-pair trading.
📝 SYMBOL NOTES - UNCORRELATED TRADING GROUPS
This indicator solves two problems every serious trader faces:
1. Keeping Track of Your Analysis
Write notes for each trading pair and they'll only appear when you view that specific chart. No more forgetting your key levels, trade ideas, or analysis!
2. Avoiding Correlated Risk
The symbols are organized into 6 groups where ALL pairs within each group are completely UNCORRELATED. Trade any combination from the same group without worrying about double exposure.
━━━━━━━━━━━━━━━━━━━━━━━━━━━━━━━━━━━━━━━━━━━━━
🎯 THE PROBLEM THIS SOLVES
Have you ever:
- Opened XAUUSD and EURUSD at the same time, then Fed news hit and BOTH positions went against you?
- Traded GBPUSD and GBPJPY together, then BOE announcement stopped out both trades?
- Forgotten what levels you were watching on a pair?
This indicator helps you avoid these costly mistakes!
━━━━━━━━━━━━━━━━━━━━━━━━━━━━━━━━━━━━━━━━━━━━━
📁 THE 6 UNCORRELATED GROUPS
Each group contains pairs that share NO common currency:
```
GRUP 1: XAUUSD • EURGBP • NZDJPY • AUDCHF • NATGAS
GRUP 2: EURUSD • GBPJPY • AUDNZD • CADCHF
GRUP 3: GBPUSD • EURJPY • AUDCAD • NZDCHF
GRUP 4: USDJPY • EURCHF • GBPAUD • NZDCAD
GRUP 5: USDCAD • EURAUD • GBPCHF
GRUP 6: NAS100 • DAX40 • UK100 • JPN225
```
**Example - GRUP 1:**
- XAUUSD → Uses USD + Gold
- EURGBP → Uses EUR + GBP
- NZDJPY → Uses NZD + JPY
- AUDCHF → Uses AUD + CHF
- NATGAS → Commodity (independent)
= 7 different currencies, ZERO overlap!
━━━━━━━━━━━━━━━━━━━━━━━━━━━━━━━━━━━━━━━━━━━━━
**✅ HOW TO USE**
1. Add indicator to any chart
2. Open Settings (gear icon ⚙️)
3. Find your symbol's group and input field
4. Write your note (support levels, trade ideas, etc.)
5. Switch charts - your note appears only on that symbol!
━━━━━━━━━━━━━━━━━━━━━━━━━━━━━━━━━━━━━━━━━━━━━
⚙️ SETTINGS
- Note Position: Choose where the note box appears (6 positions)
- Text Size: Tiny, Small, Normal, or Large
- Show Group Name: Display which correlation group
- Show Symbol Name: Display current symbol
- Colors: Customize background, text, group label, and border colors
━━━━━━━━━━━━━━━━━━━━━━━━━━━━━━━━━━━━━━━━━━━━━
💡 TRADING STRATEGY TIPS
Safe Multi-Pair Trading:
1. Pick ONE group for the day
2. Look for setups on ANY symbol in that group
3. Open positions freely - they won't correlate!
4. Even if major news hits, only ONE position is affected
━━━━━━━━━━━━━━━━━━━━━━━━━━━━━━━━━━━━━━━━━━━━━
🔧 COMPATIBLE WITH
- All major forex brokers
- Prop firms (FTMO, Alpha Capital, etc.)
- Works on any timeframe
- Futures symbols supported (MGC, M6E, etc.)
━━━━━━━━━━━━━━━━━━━━━━━━━━━━━━━━━━━━━━━━━━━━━

Abu Basel IQOption 2m Signals//@version=5
indicator("Abu Basel IQOption 2m Signals", overlay = true, timeframe = "", timeframe_gaps = true)
//========================
// الإعدادات
//========================
emaFastLen = input.int(9, "EMA سريع (9)")
emaSlowLen = input.int(21, "EMA بطيء (21)")
rsiLen = input.int(14, "RSI Length", minval = 2)
rsiBuyLevel = input.float(50.0, "RSI حد الشراء (أعلى من)", minval = 0, maxval = 100)
rsiSellLevel= input.float(50.0, "RSI حد البيع (أقل من)", minval = 0, maxval = 100)
bbLen = input.int(20, "Bollinger Length")
bbMult = input.float(2.0, "Bollinger Deviation")
showSignals = input.bool(true, "إظهار الأسهم (CALL / PUT)")
showBg = input.bool(true, "تلوين الخلفية عند الإشارات")
//========================
// المؤشرات الأساسية
//========================
emaFast = ta.ema(close, emaFastLen)
emaSlow = ta.ema(close, emaSlowLen)
basis = ta.sma(close, bbLen)
dev = bbMult * ta.stdev(close, bbLen)
bbUpper = basis + dev
bbLower = basis - dev
rsi = ta.rsi(close, rsiLen)
// رسم المتوسطات والبولينجر
plot(emaFast, title = "EMA 9", linewidth = 2)
plot(emaSlow, title = "EMA 21", linewidth = 2)
plot(basis, title = "BB Basis", linewidth = 1)
plot(bbUpper, title = "BB Upper", linewidth = 1, style = plot.style_line)
plot(bbLower, title = "BB Lower", linewidth = 1, style = plot.style_line)
//========================
// دوال أشكال الشموع الانعكاسية
//========================
bodySize = math.abs(close - open)
fullRange = high - low
upperWick = high - math.max(open, close)
lowerWick = math.min(open, close) - low
isSmallBody = bodySize <= fullRange * 0.3
// Hammer صاعدة (ذيل سفلي طويل)
bullHammer() =>
lowerWick > bodySize * 2 and upperWick <= bodySize and close > open
// Shooting Star هابطة (ذيل علوي طويل)
bearShootingStar() =>
upperWick > bodySize * 2 and lowerWick <= bodySize and close < open
// Bullish Engulfing
bullEngulfing() =>
close > open and close < open and close > open and open < close
// Bearish Engulfing
bearEngulfing() =>
close < open and close > open and close < open and open > close
// تجميع أنماط صعود/هبوط
bullPattern = bullHammer() or bullEngulfing()
bearPattern = bearShootingStar() or bearEngulfing()
//========================
// شروط الدخول
//========================
// تقاطع المتوسطات
bullCross = ta.crossover(emaFast, emaSlow) // صعود
bearCross = ta.crossunder(emaFast, emaSlow) // هبوط
// شروط شراء CALL:
// 1) تقاطع EMA9 فوق EMA21
// 2) السعر فوق خط وسط البولنجر
// 3) RSI أعلى من 50
// 4) شمعة انعكاسية صاعدة (Hammer أو Engulfing)
callCond = bullCross and close > basis and rsi > rsiBuyLevel and bullPattern
// شروط بيع PUT:
// 1) تقاطع EMA9 تحت EMA21
// 2) السعر تحت خط وسط البولنجر
// 3) RSI أقل من 50
// 4) شمعة انعكاسية هابطة (Shooting Star أو Bearish Engulfing)
putCond = bearCross and close < basis and rsi < rsiSellLevel and bearPattern
//========================
// رسم الإشارات على الشارت
//========================
plotshape(showSignals and callCond, title="CALL 2m",
style=shape.labelup, location=location.belowbar,
text="CALL 2m", size=size.tiny)
plotshape(showSignals and putCond, title="PUT 2m",
style=shape.labeldown, location=location.abovebar,
text="PUT 2m", size=size.tiny)
// تلوين الخلفية عند الإشارات
bgcolor(showBg and callCond ? color.new(color.green, 85) :
showBg and putCond ? color.new(color.red, 85) : na)
//========================
// شروط التنبيه (Alerts)
//========================
alertcondition(callCond, title="CALL 2m Signal",
message="Abu Basel Signal: CALL 2m on {{ticker}} at {{close}}")
alertcondition(putCond, title="PUT 2m Signal",
message="Abu Basel Signal: PUT 2m on {{ticker}} at {{close}}")

Jericho AI ScalperThis indicator is designed for use on Nifty and Sensex Options 1-minute chart.
A trade entry is valid only if the very next candle breaks above the high of the signal candle.
If the next candle fails to break that high, the setup becomes invalid and no trade should be taken.
Based on historical observations, a 1:1 risk-reward ratio is recommended; however, market conditions can change, and results may vary.
This indicator is intended strictly for educational and research purposes, helping traders understand market structure and candle-based momentum behavior.
It does not offer financial advice or guarantee profits. Please conduct your own analysis and consult a licensed financial professional when required.

VCP Base Detector
📊 VCP BASE DETECTOR - AUTO-DETECT CONSOLIDATION ZONES
🎯 WHAT IS THIS INDICATOR?
This indicator automatically detects and marks ALL consolidation bases (VCP bases) on your chart. It:
✅ Auto-detects when price enters consolidation
✅ Measures base tightness (volatility contraction)
✅ Tracks base duration (how long consolidating)
✅ Rates base quality (1-5 stars)
✅ Shows volume drying confirmation
✅ Detects base breakouts
✅ Shows progression of multiple bases (VCP pattern)
Use this WITH the "Mark Minervini SEPA Balanced" indicator for complete trading setups!
✅ Mark Minervini SEPA Balanced = Trend + RS + Stage
✅ VCP Base Detector = Base Quality + Progression
Combined = Complete professional trading system!
🎨 WHAT YOU SEE ON YOUR CHART
1️⃣ COLORED BOXES (Base Zones):
🟦 Aqua Box = ⭐⭐⭐⭐⭐ Excellent base (tightest)
🔵 Blue Box = ⭐⭐⭐⭐ Very good base
🟣 Purple Box = ⭐⭐⭐ Good base
🟠 Orange Box = ⭐⭐ Fair base
⬜ Gray Box = ⭐ Weak base
2️⃣ BASE LABELS (With Metrics):
Shows above each base:
• Duration: 20 days
• Tightness: 0.9%
• Quality: ⭐⭐⭐⭐⭐
3️⃣ BREAKOUT LABELS (When price exits base):
Green "BREAKOUT ✓" label shows:
• Price: ₹800
• Volume: 1.6x
4️⃣ DASHBOARD (Top-Left Panel):
Real-time base metrics showing:
• In Base: YES/NO
• Tightness: 0.8%
• Duration: 22 days
• Range: 3.5%
• Volume: Drying/Normal
• Quality: ⭐⭐⭐⭐
📊 UNDERSTANDING BASE QUALITY (⭐ Rating System)
⭐⭐⭐⭐⭐ (EXCELLENT)
├─ Tightness: < 0.8% ATR
├─ Duration: 15-40 days
├─ Volume: Significantly drying
├─ Price Range: < 5%
└─ Result: Most explosive breakouts (best quality)
⭐⭐⭐⭐ (VERY GOOD)
├─ Tightness: 0.8-1.0% ATR
├─ Duration: 15-35 days
├─ Volume: Very dry
├─ Price Range: < 7%
└─ Result: High probability breakouts
⭐⭐⭐ (GOOD)
├─ Tightness: 1.0-1.3% ATR
├─ Duration: 15-30 days
├─ Volume: Drying
├─ Price Range: < 8%
└─ Result: Decent breakout probability
⭐⭐ (FAIR)
├─ Tightness: 1.3-1.5% ATR
├─ Duration: 15-25 days
├─ Volume: Moderate drying
├─ Price Range: < 10%
└─ Result: Lower quality, riskier
⭐ (WEAK)
├─ Tightness: > 1.5% ATR
├─ Duration: Varies
├─ Volume: Not drying enough
├─ Price Range: > 10%
└─ Result: Low quality, skip these
📈 HOW TO USE - STEP BY STEP
STEP 1: ADD INDICATOR TO CHART
────────────────────────────────
1. Open any stock chart (use 1D timeframe for swing trading)
2. Click "Indicators"
3. Search "VCP Base Detector"
4. Click to add to chart
5. Wait a moment for boxes to appear
STEP 2: SCAN FOR BASES
───────────────────────
Look for:
✓ Colored boxes appearing on chart (bases forming)
✓ Dashboard showing "In Base: YES"
✓ Tightness below 1.5%
✓ Volume Dry: YES
STEP 3: MONITOR BASE QUALITY
──────────────────────────────
Dashboard shows stars:
⭐⭐⭐⭐⭐ = Wait for breakout (best setup)
⭐⭐⭐⭐ = Good quality, watch for breakout
⭐⭐⭐ = Decent, but not ideal
⭐⭐ or ⭐ = Skip (lower probability)
STEP 4: WAIT FOR BREAKOUT
──────────────────────────
When price breaks above the box:
✓ Green "BREAKOUT ✓" label appears
✓ Shows breakout price and volume
✓ If volume shows 1.3x+, breakout is confirmed
✓ This is your entry signal!
STEP 5: CHECK MINERVINI CRITERIA (Use Both Indicators)
───────────────────────────────────────────────────────
Before entering:
✓ VCP Base Detector shows ⭐⭐⭐⭐+ quality base
✓ Mark Minervini indicator shows BUY SIGNAL
✓ Dashboard shows 10+ criteria GREEN
✓ Stage shows S2
Result: HIGH-PROBABILITY SETUP! 🎯
📋 DASHBOARD INDICATORS - WHAT EACH MEANS
BASE METRICS SECTION:
─────────────────────
In Base = ✓ YES or ✗ NO
Show if price is currently consolidating
Tightness = 0-3% (lower = tighter = better)
< 0.8% = ⭐⭐⭐⭐⭐ (excellent)
0.8-1.0% = ⭐⭐⭐⭐ (very good)
1.0-1.3% = ⭐⭐⭐ (good)
1.3-1.5% = ⭐⭐ (fair)
> 1.5% = ⭐ (weak)
Duration = Number of days in consolidation
15 days = ⭐ (too short, weak)
20 days = ⭐⭐⭐ (ideal)
30 days = ⭐⭐⭐⭐ (very long, strong)
> 40 days = ⚠️ (too long, may break down)
Range = % movement within the base
< 5% = ⭐⭐⭐⭐⭐ (excellent, very tight)
5-8% = ⭐⭐⭐ (good)
> 10% = ⭐ (loose, not ideal)
Vol Dry = Volume status during consolidation
✓ YES = Volume contracting (good)
✗ NO = Normal/high volume (weak setup)
QUALITY SECTION:
────────────────
Stars = Overall base quality rating
⭐⭐⭐⭐⭐ = Best quality bases (most explosive)
⭐⭐⭐⭐ = Excellent quality
⭐⭐⭐ = Good quality
⭐⭐ = Fair quality
⭐ = Weak quality (skip)
52W INFO SECTION:
─────────────────
From 52W Hi = How far below 52-week high is price?
< 25% = In sweet zone ✓
> 25% = Too far from highs ✗
From 52W Lo = How far above 52-week low is price?
> 30% = In sweet zone ✓
< 30% = Too close to lows ✗
⚙️ CUSTOMIZATION GUIDE
Click ⚙️ gear icon next to indicator to adjust:
MINIMUM BASE DAYS (Default: 15)
──────────────────────────────
Current: 15 = Include shorter bases
Change to 20 = Longer bases only (higher quality)
Change to 10 = Include very short bases (more frequent)
Why: Longer bases = better breakouts, but fewer opportunities
ATR% TIGHTNESS THRESHOLD (Default: 1.5)
────────────────────────────────────────
Current: 1.5 = BALANCED for Indian stocks
Change to 1.0 = ONLY very tight bases (⭐⭐⭐⭐⭐)
Change to 2.0 = Looser bases included (more frequent)
Why: Lower = tighter bases = better quality, fewer signals
VOLUME DRYING THRESHOLD (Default: 0.7)
──────────────────────────────────────
Current: 0.7 = Volume at 70% of average (good drying)
Change to 0.6 = Stricter (more volume drying required)
Change to 0.8 = Looser (less volume drying required)
Why: Volume drying = consolidation confirmation
52W PERIOD (Default: 252)
─────────────────────────
Current: 252 = Full year lookback
Don't change unless you know what you're doing
📈 REAL TRADING EXAMPLE
SCENARIO: Trading MARUTI over 6 weeks
WEEK 1: Nothing happening
─────────────────────────
- No boxes on chart
- Dashboard: "In Base: NO"
- Action: SKIP (not consolidating)
WEEK 2: Base Starting to Form
─────────────────────────────
- Purple box appears (⭐⭐⭐ quality)
- Dashboard: "In Base: YES"
- Tightness: 1.2%
- Duration: 3 days (too new)
- Action: MONITOR (let it develop)
WEEK 3-4: Base Tightening
──────────────────────────
- Box color changes from Purple → Blue (⭐⭐⭐⭐ quality)
- Dashboard: Duration: 12 days
- Tightness: 0.9%
- Vol Dry: YES
- Action: GET READY (high-quality base forming)
WEEK 4-5: Perfect Base Formed
──────────────────────────────
- Box changes to Aqua (⭐⭐⭐⭐⭐ EXCELLENT!)
- Dashboard: Duration: 22 days ✓
- Tightness: 0.8% ✓
- Vol Dry: YES ✓
- Range: 4.2% ✓
- Action: WATCH FOR BREAKOUT
WEEK 5: BREAKOUT HAPPENS!
──────────────────────────
- Price closes above box
- Green "BREAKOUT ✓" label appears
- Shows: Price ₹850, Volume 1.6x
- Mark Minervini indicator: BUY SIGNAL ✓
- Dashboard all GREEN ✓
- Action: ENTER TRADE
Entry: ₹850
Stop: Box low (₹820)
Target: ₹980 (20% move)
RESULT: +15.3% profit in 2 weeks! ✅
💡 PRO TIPS FOR BEST RESULTS
1. COMBINE WITH MINERVINI INDICATOR
Use BOTH indicators together:
✓ VCP Detector = Base quality
✓ Minervini = Trend + RS + Volume
Result = Best high-probability setups
2. PREFER ⭐⭐⭐⭐+ QUALITY BASES
Don't trade ⭐⭐ or ⭐ quality bases
Only trade ⭐⭐⭐+ (ideally ⭐⭐⭐⭐+)
Higher quality = Higher win rate
3. WAIT FOR VOLUME CONFIRMATION
Base must show "Vol Dry: YES"
Breakout must have 1.3x+ volume
Low volume breakouts fail often
4. USE 1D TIMEFRAME ONLY
This indicator optimized for daily charts
Intraday = Too many false signals
Weekly = Misses good setups
5. MONITOR MULTIPLE BASES (VCP PATTERN)
Multiple bases getting tighter = VCP pattern
Each base should be better quality than last
Tightest base = Biggest breakout
6. COMBINE WITH 52W CONTEXT
Dashboard shows "From 52W Hi" and "From 52W Lo"
Price should be in sweet zone:
< 25% from 52W high (uptrend territory)
> 30% above 52W low (not oversold)
7. BACKTEST FIRST
Use TradingView Replay
Go back 6-12 months
See how many bases appeared
See which were profitable
❌ BASES TO SKIP (Lower Probability)
Skip if:
❌ Quality rating < ⭐⭐⭐ (only 1-2 stars)
❌ Tightness > 1.5% (too loose)
❌ Duration < 10 days (too short, weak)
❌ Duration > 50 days (too long, may break down)
❌ Vol Dry: NO (volume not contracting)
❌ Range > 10% (not tight consolidation)
❌ Price < 30% from 52W low (too weak)
❌ Price > 30% from 52W high (too far up, late entry)
⚠️ IMPORTANT DISCLAIMERS
✓ This indicator is for educational purposes only
✓ Past performance does not guarantee future results
✓ Always use proper risk management (position sizing, stop loss)
✓ Never risk more than 2% of your account on one trade
✓ Base detection is technical analysis, not investment advice
✓ Losses can occur - trade at your own risk
✓ Combine with other indicators for best results
🎓 LEARNING RESOURCES
To understand VCP bases better:
→ Study "Trade Like a Stock Market Wizard" by Mark Minervini
→ Watch: "VCP Pattern" videos on YouTube
→ Practice: Backtest on 1-2 years of historical data
→ Learn: How consolidation precedes breakouts
🚀 YOU'RE READY!
Happy trading! 📈🎯

Mark Minervini SEPA - Balanced
📊 MARK MINERVINI SEPA BALANCED - COMPLETE USER GUIDE
🚀 WHAT IS THIS INDICATOR?
This is a professional swing trading indicator based on Mark Minervini's famous
Trend Template strategy. It automatically identifies high-probability setups where:
✅ Long-term trend is BULLISH (confirmed by moving averages)
✅ Stock is OUTPERFORMING the market (relative strength improving)
✅ Price is CONSOLIDATING (forming a base for breakout)
✅ Volume is CONFIRMING (volume spike on breakout)
Result: CLEAR BUY SIGNALS when everything aligns! 🎯
🎨 WHAT YOU SEE ON YOUR CHART
1️⃣ FOUR MOVING AVERAGE LINES:
🟠 Orange Line (MA 20) = Short-term trend
🔵 Blue Line (MA 50) = Intermediate trend
🟢 Green Line (MA 150) = Long-term trend
🔴 Red Line (MA 200) = Very long-term trend
IDEAL: All lines stacked in order (Orange > Blue > Green > Red)
2️⃣ BACKGROUND COLOR:
🟢 GREEN background = Trend template is VALID (bullish setup ready)
🔴 RED background = Trend template is BROKEN (avoid trading)
3️⃣ DASHBOARD PANEL (Top-Right):
Real-time checklist showing:
✓ 6 core trend template rules
✓ Relative strength status
✓ VCP base quality
✓ Stage classification (S1/S2/S3/S4)
✓ Volume breakout status
4️⃣ VCP BASE BOXES (Blue Rectangles):
Shows where consolidation is happening
This is your potential entry zone
5️⃣ BUY SIGNAL LABEL (Green Text Below Candle):
Green "BUY" label appears when ALL criteria are met
This is your strongest entry signal
6️⃣ STOP LOSS LINE (Red Dashed Line):
Shows your stop loss level (base low)
📖 HOW TO USE - STEP BY STEP
STEP 1: ADD INDICATOR TO CHART
────────────────────────────────
1. Open TradingView chart
2. Click "Indicators" (top toolbar)
3. Search "Minervini SEPA Balanced"
4. Click to add to your chart
5. Use DAILY (1D) timeframe for swing trading
STEP 2: CHECK THE DASHBOARD (Top-Right Panel)
1. Look at all the checkmarks
2. Count how many are GREEN (✓)
3. Check Stage column - is it showing S2 or S1?
STEP 3: LOOK FOR SETUP PATTERNS
─────────────────────────────────
Ideal setup shows:
✓ Dashboard: 10+ criteria are GREEN
✓ Stage: S2 (green) or S1 (orange)
✓ Blue VCP box visible on chart (base forming)
✓ Moving averages aligned (50 > 150 > 200)
✓ Price above all moving averages
✓ Background is GREEN
STEP 4: WAIT FOR ENTRY SIGNAL
──────────────────────────────
Option A: BUY SIGNAL label appears
→ Green "BUY" label = ALL criteria met
→ ENTER at market price immediately
Option B: Setup looks good but no BUY label yet
→ Wait for price to break above blue VCP box
→ Volume should spike (1.3x or higher)
→ Then enter at breakout
STEP 5: PLACE YOUR TRADE
────────────────────────
📍 ENTRY: At breakout from VCP base
📍 STOP LOSS: Base low (red dashed line)
📍 TARGET: 20-30% move (typical Minervini target)
📍 HOLDING TIME: 2-4 weeks
🎯 BALANCED VERSION - WHY IT'S BETTER FOR INDIAN STOCKS
Volume Multiplier: 1.3x (NOT 1.5x)
→ Original was too strict for Indian market
→ 1.3x is realistic and catches good breakouts
→ Results: 5-10 signals per stock per year (tradeable!)
Trend Template: Core 6 rules (NOT all 8)
→ Focuses on the most important rules
→ Still maintains quality, but more flexible
→ Works better with Indian stock behavior
Stage Allowed: S1 OR S2 (NOT just S2)
→ Catches earlier moves
→ Allows you to enter sooner
→ But maintains quality with other criteria
📊 DASHBOARD INDICATORS - WHAT EACH MEANS
TREND SECTION (Core 6 Rules):
─────────────────────────────
P>200 ✓ = Price above 200-day MA (long-term uptrend)
150>200 ✓ = MA150 above MA200 (MA alignment)
200↑ ✓ = MA200 trending up (uptrend accelerating)
50>150 ✓ = MA50 above MA150 (intermediate uptrend)
50>200 ✓ = MA50 above MA200 (overall alignment)
P>50 ✓ = Price above MA50 (pullback level intact)
RS STRENGTH SECTION:
───────────────────
RS↑ ✓ = Stock outperforming NIFTY index
✗ = Stock underperforming NIFTY (avoid)
VCP BASE SECTION:
────────────────
In Base ✓ = Consolidation zone detected
✗ = No consolidation yet
Vol Dry ✓ = Volume drying up (base tightening)
✗ = Normal volume (consolidation weak)
ENTRY SECTION:
──────────────
Stage S2 = GREEN (best for swing trading)
S1 = ORANGE (acceptable, early entry)
S3 = RED (avoid - distribution phase)
S4 = RED (avoid - downtrend)
Vol Brk ✓ = Volume confirmed breakout (1.3x+ average)
✗ = Weak volume (breakout likely to fail)
❌ WHEN NOT TO TRADE
SKIP if ANY of these are true:
❌ Background is RED (trend template broken)
❌ Stage is S3 or S4 (distribution or downtrend)
❌ Vol Brk is RED (volume not confirming)
❌ RS↑ is ORANGE/RED (stock underperforming market)
❌ Blue box is NOT visible (no base forming)
❌ Base is very loose/messy (not tight enough)
❌ Moving averages are not aligned
❌ Less than 8 GREEN criteria on dashboard
⚙️ CUSTOMIZATION GUIDE
Click ⚙️ gear icon next to indicator name to adjust settings:
VOLUME MULTIPLIER (Default: 1.3)
────────────────────────────────
Current: 1.3x = BALANCED for Indian stocks ✅
Change to 1.2x = MORE signals (more false breakouts)
Change to 1.4x = FEWER signals (very selective)
Change to 1.5x = ORIGINAL (too strict, rarely triggers)
RS BENCHMARK (Default: NSE:NIFTY)
─────────────────────────────────
Current: NSE:NIFTY = Large-cap stocks
Change to NSE:NIFTY500 = Mid-cap stocks
Change to NSE:NIFTYNXT50 = Small-cap stocks
MINIMUM BASE DAYS (Default: 20)
───────────────────────────────
Current: 20 days = 4 weeks consolidation ✅
Change to 15 = Shorter bases (more frequent signals)
Change to 25 = Longer bases (higher quality)
ATR% FOR TIGHTNESS (Default: 1.5)
──────────────────────────────────
Current: 1.5% = BALANCED ✅
Change to 1.0% = ONLY very tight bases
Change to 2.0% = Loose bases accepted
📈 REAL TRADING EXAMPLE
SCENARIO: Trading RELIANCE over 4 weeks
WEEK 1: Base Starts Forming
────────────────────────────
- Price consolidating around ₹1,500
- Dashboard: 5/14 criteria green
- Action: MONITOR (not ready yet)
WEEK 2: Base Tightens
─────────────────────
- Price still ₹1,500 (no movement)
- VCP box appearing on chart
- Dashboard: 8/14 criteria green
- Vol Dry: ✓ (volume shrinking - good!)
- Action: MONITOR (almost ready)
WEEK 3: Perfect Setup Formed
──────────────────────────────
- Base still ₹1,500
- Dashboard: 12/14 criteria GREEN ✓✓✓
- Stage: S2 ✓
- Blue box tight and clean
- Action: WAIT FOR BREAKOUT
WEEK 4: Breakout Happens!
──────────────────────────
- Price closes at ₹1,550 (breakout!)
- Volume: 1.6x average (exceeds 1.3x requirement)
- Dashboard: BUY SIGNAL ✓ (all criteria met)
- Action: ENTER TRADE
Entry: ₹1,550
Stop: ₹1,480 (base low)
Target: ₹1,850 (20% move)
RESULT: +19.4% profit in 2 weeks! ✅
💡 PRO TIPS FOR BEST RESULTS
1. USE DAILY (1D) CHARTS ONLY
Weekly charts = Fewer signals, slower moves
Daily charts = Best for swing trading ✅
Intraday charts = Too many false signals
2. SCAN MULTIPLE STOCKS
Don't just watch 1 stock
Scan 50-100 stocks daily
More stocks = More opportunities
3. WAIT FOR PERFECT ALIGNMENT
Don't enter on 8/14 criteria
Wait for 12+/14 criteria
This increases win rate significantly
4. VOLUME IS CRITICAL
Always check Vol Brk column
No volume = Likely to fail
1.3x+ volume = Good breakout
5. COMBINE WITH YOUR OWN ANALYSIS
Indicator gives technical signals
You add your own fundamental view
Strong fundamental + technical = Best trade
6. BACKTEST ON HISTORICAL DATA
Use TradingView Replay feature
Go back 6-12 months
See how many signals appeared
Verify which were profitable
7. KEEP A TRADING JOURNAL
Track entry, exit, profit/loss
Note what worked and what didn't
Continuous improvement!
⚠️ IMPORTANT DISCLAIMERS
✓ This indicator is for educational purposes only
✓ Past performance does not guarantee future results
✓ Always use proper risk management (position sizing, stop loss)
✓ Never risk more than 2% of your account on one trade
✓ Backtest thoroughly before using with real money
✓ The indicator provides technical signals, not investment advice
✓ Losses can occur - trade at your own risk
🎯 QUICK START CHECKLIST
Before entering ANY trade, verify:
□ Dashboard shows mostly GREEN (10+ criteria)
□ Stage = S2 (green) or S1 (orange)
□ Blue VCP box visible on chart
□ Price just broke above the box
□ Volume is high (1.3x+ average, Vol Brk = ✓)
□ Moving averages aligned (50 > 150 > 200)
□ RS is uptrending (RS↑ = ✓)
□ BUY SIGNAL label appeared (optional but strong confirmation)
ALL CHECKED? → READY TO BUY! 🚀
📞 FOR HELP & SUPPORT
Questions about the indicator?
→ Check the dashboard - each criterion has a specific meaning
→ Review this guide - answers most common questions
→ Backtest on historical data using TradingView Replay
→ Start with paper trading (no real money) first
🎓 LEARNING RESOURCES
To understand Mark Minervini's method better:
→ Read: "Trade Like a Stock Market Wizard" by Mark Minervini
→ Watch: TradingView educational videos on trend templates
→ Practice: Backtest this indicator on 6-12 months of historical data
→ Learn: Study successful traders who use similar strategies
GOOD LUCK WITH YOUR TRADING! 🚀📈
May your trends be bullish and your breakouts be explosive! 🎯


Option Premium + VWAP Dashboard1. What this indicator does
This tool creates a live option chain style dashboard on your chart for index options on NSE.
For a selected expiry and a band of strikes around a reference strike, it shows:
Strike price
CE LTP (Last Traded Price)
PE LTP
CE + PE total premium
Combined VWAP of CE + PE
Individual VWAP of CE
Individual VWAP of PE
Inference column describing who is stronger
(buyers or sellers, CE side or PE side, or mixed)
Rows are color coded based on which side is dominating around VWAP, so you get a quick visual sense of:
At which strikes buyers are aggressive
At which strikes sellers are aggressive
Where premiums are trading near VWAP and stay neutral
You can place this dashboard anywhere on the chart and adjust font size and colors as per your preference.
2. Supported indices
You can use this indicator on the following indices:
NIFTY
BANKNIFTY
FINNIFTY
MIDCAP
SENSEX
Input:
Spot Symbol = choose from BANKNIFTY, NIFTY, FINNIFTY, MIDCAP, SENSEX
Internally, the script maps this choice to the corresponding TradingView symbol:
NIFTY → NSE:NIFTY
BANKNIFTY → NSE:BANKNIFTY
FINNIFTY → NSE:CNXFINANCE
MIDCAP → NSE:CNXMIDCAP
SENSEX → BSE:SENSEX
For options, it uses an option prefix derived from this selection:
For all NSE index options → BANKNIFTY, NIFTY, FINNIFTY, MIDCAP
For SENSEX options → BSX (as per your earlier convention)
Options are then constructed in this format:
PREFIX + YYMMDD + C/P + Strike
Example: NIFTY251120C20000
So the expiry date must be set correctly, otherwise TradingView will not find the options.
3. How the logic works internally
For each strike in the selected range, the script:
Builds the CE and PE symbols using:
Underlying prefix (opt_prefix)
Expiry date in YYMMDD format
C or P
Strike price
Fetches from request.security() on your current chart timeframe:
ce_close, pe_close
ce_vwap, pe_vwap
Calculates:
combined_prem = CE LTP + PE LTP
combined_vwap = CE VWAP + PE VWAP
Compares premiums and VWAPs and creates a detailed inference string, for example:
"Optn buyers stronger | Both buyers strong"
"Optn sellers stronger | CE sellers, PE buyers"
"Near VWAP | Mixed"
Chooses row background color based on which side is stronger:
CE buyers strong → BG CE Buyers Strong
PE buyers strong → BG PE Buyers Strong
CE sellers strong → BG CE Sellers Strong
PE sellers strong → BG PE Sellers Strong
If none of the above is clearly dominant, the row is kept neutral.
This gives you an immediate view of:
Where option buyers are aggressively lifting offers
Where option sellers are dominating
Where the market is balanced near VWAP
4. Expiry settings
How to change expiry to get the correct option chain
The indicator uses a manual expiry input:
Group: Expiry Settings
Input: Expiry (manual)
Internally, it extracts:
year(expiry_manual)
month(expiry_manual)
dayofmonth(expiry_manual)
Then it converts this to YYMMDD and builds option symbols.
How to set this correctly:
Open the indicator settings.
Go to “Expiry Settings”.
In Expiry (manual) select the correct date and time of the option expiry.
For NSE weekly or monthly index options, you can simply select the calendar date of the expiry.
Time is not critical for symbol naming, it is used only to obtain year, month, day, but keeping it at market open time (for example, 09:15) is a good habit.
After changing the expiry:
The title row will update to show the new expiry as DD-MM-YY.
The script will start requesting data for symbols with that YYMMDD in their names.
If you see na in most rows, it usually means:
The expiry date does not match the actual symbol format on TradingView.
The strike prices are too far away from existing contracts.
You are using an expiry where this index does not have options.
In that case, double check the expiry date and strike range.
5. Strike settings
The script gives you a flexible way to control which strikes are shown.
Group: Strike Settings
5.1 Automatic strike interval
By default, the indicator uses index specific strike steps:
BANKNIFTY or SENSEX → 100 point interval
NIFTY or FINNIFTY → 50 point interval
MIDCAP also defaults to 50 points
This is controlled internally by:
use_manual_interval = false
and auto_interval is chosen based on the index.
Use case:
If you want a quick standard layout for a typical option chain view, simply leave “Use Manual Strike Interval” unchecked and let the script choose the appropriate interval automatically.
5.2 Manual strike interval
You can override the default step using:
Use Manual Strike Interval (bool)
Manual Strike Interval (int, default 50)
When Use Manual Strike Interval is true, the script will:
Ignore the automatic index based step.
Use your chosen step size for all strikes.
When to use manual interval:
When the exchange has changed strike spacing for a particular series.
When you want a denser view (for example, 25 point steps in NIFTY) around ATM.
When you want a wider spacing for a broad overview, for example, 200 or 500 point steps.
5.3 Reference strike and range
Two important inputs:
Reference Strike (manual)
Default: 26000
This is the center of the table. The script builds strikes above and below this level.
Strikes Above / Below Reference
Default: 5
The script calculates:
start_strike = ref_strike - half_range * strike_interval
Total number of strikes = 2 * half_range + 1
So with:
Reference Strike = 26000
Strike Interval = 100
Strikes Above / Below = 5
You will get strikes from 25500 to 26500 in steps of 100.
How to choose the reference strike in practice:
Set it close to the current spot price or the ATM strike.
For intraday trading, most of your focus is usually on:
ATM
2 or 3 strikes ITM and OTM on each side
If NIFTY is around 22,250, set Reference Strike to 22200 or 22250 based on available strikes.
If BANKNIFTY is around 49,800, set it to 49800 or 50000.
This keeps the dashboard concentrated around active and liquid strikes that you actually trade.
6. Dashboard layout and appearance
Group: Dashboard Layout
Dashboard Location
Choose where the table appears on your chart.
Options: top left, top center, top right, middle left, middle center, middle right, bottom left, bottom center, bottom right.
Font Size
Choose from Tiny, Small, Normal, Large, Huge depending on your screen size and personal preference.
Group: Colors
You can customize:
Header Background
Title Background
Header Text color
Row backgrounds based on strength:
BG CE Buyers Strong
BG PE Sellers Strong
BG CE Sellers Strong
BG PE Buyers Strong
Row BG neutral for mixed or unclear situations
Suggestion:
Keep buyers related backgrounds in green shades.
Keep sellers related backgrounds in red shades.
Keep neutral in grey.
This matches the logic in the Inference column and makes interpretation much easier.
7. How to read the “Inference” column
The inference logic checks:
Is total premium above or below total VWAP?
Is CE above its VWAP?
Is PE above its VWAP?
Then it combines this into messages like:
“Optn buyers stronger | Both buyers strong”
Both CE and PE trade above their respective VWAPs, and combined premium is above combined VWAP.
Buyers are clearly dominant at that strike.
“Optn sellers stronger | Both sellers strong”
Both CE and PE trade below VWAPs, and combined premium is below combined VWAP.
Sellers are in control at that strike.
“Optn buyers stronger | CE buyers stronger”
Combined premium is above combined VWAP, CE trades above its VWAP, PE is not as strong.
CE side buyers are leading.
“Optn buyers stronger | PE buyers stronger”
Similar, but PE side buyers are leading.
“Optn sellers stronger | CE sellers, PE buyers” or “PE sellers, CE buyers”
Mixed conditions, one side is selling aggressively while the other side has some buyer support.
“Near VWAP | Mixed”
Both premiums are hovering near their VWAP, market is balanced at that strike.
Use this to quickly decide:
Where to avoid trading due to mixed and choppy behaviour.
Where buyers or sellers are clearly dominating and trend can be extended or exhausted.
8. Practical usage tips
Use on intraday timeframes
The script uses timeframe.period for VWAP and LTP calculation. Use it on 1 minute, 3 minute, 5 minute, 15 minute charts for intraday decision making.
Align with index trend
Combine this dashboard with your main price action and trend tools.
For example, if the index trend is strongly up and the ATM and slightly OTM calls show “buyers stronger” with green backgrounds, it can support continuation trades.
Watch shifts in dominance
If you see a cluster of strikes shifting from “buyers stronger” to “sellers stronger”, that can signal distribution or trend exhaustion.
Change expiry when series rolls
For weekly options, you must change Expiry (manual) every week to get the correct option chain.
For monthly and quarterly contracts, update it whenever you roll over to a new series.
Adjust manual interval and reference strike
Before the session starts, quickly adjust:
Reference Strike near current spot
Strikes Above / Below based on how wide a range you want to watch
Optional Manual Strike Interval if you prefer finer or wider spacing
This ensures the dashboard shows the most relevant and liquid strikes instead of cluttering your screen with far OTM data.
9. Limitations and notes
This script depends on correct symbol naming on TradingView for NSE index options.
If the broker or data feed uses a different format, some rows may show na.
Expiry detection is manual by design.
Pine Script cannot reliably auto detect NSE weekly expiry series for every situation, so you are given full manual control to avoid wrong symbol requests.
If you change expiry or strike settings and see an error or many na values, try:
Checking the expiry date.
Bringing reference strike closer to spot.
Refreshing the chart if TradingView needs to load new option symbols.

All-in-One India v21. **Overview**: Multi-indicator strategy for NSE index options (NIFTY/BANKNIFTY) tracking CE/PE premiums as a synthetic asset (straddle or single-leg) on TradingView.
2. **Setup**: Input index, expiry (e.g., 21-08-24), strikes (e.g., 50800 CE/PE). Choose "Combined" for straddle premium or single option.
3. **Data**: Fetches OHLCV for options; plots premium as candlesticks (green up, red down).
4. **Indicators** (toggleable): EMA (7/12 cross), Supertrend (ATR7, factor2), VWAP (daily reset), RSI (7-period, 80/20 levels), SMA (7-period).
5. **Signals**: Buy/Sell on crosses/flips (e.g., EMA fast> slow for buy; one per day/direction). Multi-indicator: Sequential AND logic (best with 1 enabled).
6. **Buy Logic**: EMA cross up, Supertrend to up (-1), premium>VWAP/SMA, RSI>80 (momentum tweak).
7. **Sell Logic**: Opposite crosses/flips (e.g., EMA cross down, Supertrend to down +1, RSI<20).
8. **Trading**: Long premium on buy (volatility play); short on sell (decay). No exits—use opposite signal or targets.
9. **Visuals/Alerts**: Shapes for signals; lines for indicators; alerts on buy/sell.
10. **Tips**: Test intraday near expiry; ATM strikes; risk 1-2%; tweak RSI if needed.

Bull/Bear/Consolidation Zones Hariss 369This indicator helps to identify bullish, bearish, and consolidation zones using EMA and ATR-based calculations. It visually highlights zones on the chart and provides buy and sell signals with ATR-based stop-loss (SL) and take-profit (TP) levels.
Key Features:
EMA Trend Filter: Determines the direction of the market.
Bull / Bear / Consolidation Zones: Colored zones to easily spot market phases.
ATR-Based SL & TP: Automatic calculation for each trade signal.
Buy / Sell Signals: Based on price relative to EMA and consolidation zones.
Relative Volume (RVOL) Filter: Optional filter to trade only when volume is significant, helping reduce low-probability signals.
Extended Zones: Option to extend zones forward until a breakout occurs.
Customizable Inputs: EMA length, ATR length, multipliers, RVOL period & multiplier, and toggle RVOL filter.
How to Use:
Identify bull/bear/consolidation zones on your chart. (These are already there) You can change the line as well zone color according to your needs.
Look for buy signals above EMA and consolidation zone, or sell signals below EMA and consolidation zone. The buy and sell labels are already there.
Confirm with RVOL filter (optional) to ensure higher volume support.
Use the plotted SL and TP levels for trade management.
This tool is designed for trend-following and market structure traders who want a visual guide to high-probability trading zones combined with volume confirmation.
One can also trail with EMA in trending market.

Buy Sell Signal — Ema crossover [© gyanapravah_odisha]Professional EMA Crossover + ATR Risk Control
Trade with confidence using a complete system that gives you clear entries, smart exits, and full automation.
Includes:
Precision 5/13 EMA crossover signals
ATR-based adaptive stop-loss
Multiple take-profit levels (with intermediate targets)
Fully customizable R:R ratios
ATR + volume filters to avoid choppy markets
Real-time trade dashboard
All alerts included
Built for: Crypto, Forex, Stocks • Scalping & Swing Trading
Built for you: Free, open-source & made for real-world trading.

Asia Range - London & NY Open - First 2 HoursThis indicator will identify the areas where different session of trading happens around the world giving you the edge to identify traps in Asia range and utilize the volitility of London and New York open

Auction Theory Support & Resistance Flipper @MaxMaserati 3.0The Auction Theory Support & Resistance Flipper @MaxMaserati 3.0 indicator identifies and tracks volume-based support and resistance levels using an auction market theory approach. It automatically detects price swing points and creates dynamic "defense zones" where significant volume activity occurred, then monitors these zones to determine if they're being defended or overwhelmed by market participants.
Key Features:
1. Automatic Level Detection
Uses fractal swing detection to identify key reversal points
Creates support zones at swing lows where buyers defended price
Creates resistance zones at swing highs where sellers defended price
2. Volume-Based Validation
Only displays levels with significant volume (above threshold)
Volume strength shown as percentage relative to average volume
Visual volume boxes scale with strength (optional)
3. Auction Status Tracking
The indicator monitors each level and displays real-time auction status through labels:
IMPORTANT - Box Without Label:
When a level is first created, it shows ONLY the box/line with NO label
This means price has NOT yet visited/tested this defense level
The auction has not started yet - it's a pending defense zone
Labels ONLY appear after price touches the zone for the first time
Label Formats (3 modes available once price visits):
Compact Mode: 150% ↑
First number = Original volume strength percentage
Symbol shows auction status (↑↑ Strong Defense, ↑ Defending, ↓ Under Pressure, ↓↓ Overwhelmed, ⇌ Balanced, ✓ Finished, ⚡ Flipped)
Full Mode: 150% | ↑ Defending Auction 45%
Volume strength | Status description | Excess volume percentage
Touch Only: Labels appear only after price touches the level (same as default behavior)
Auction States (after first touch):
Unfinished Auction (⏳): Recently touched, minimal volume absorbed (< 30%)
Balanced Auction (⇌): Volume matching original defense, equilibrium
Defending Auction (↑/↓): Successfully defending with excess volume (20-100%)
Strong Defense Auction (↑↑/↓↓): Overwhelming defense volume (>100%)
Under Pressure (↑/↓): Defense weakening, opposite volume building
Overwhelmed (↑↑/↓↓): Defense broken, significant opposite volume (>50%)
Finished Auction (✓): Volume threshold met (100%+), level depleted
Flipped Level (⚡): Support became resistance or vice versa
4. Support/Resistance Flip Detection
Automatically detects when a support level fails and becomes resistance
Or when resistance breaks and becomes support
Visual indication with orange background and ⚡ symbol
Continues tracking until new auction finishes
5. Summary Table
Active Levels count
Breakdown by Support/Resistance
Number of flipped levels
Maximum volume strength currently active
Settings:
Volume Analysis: Lookback period and threshold multiplier
Auction Management: Depletion threshold, bars away to finish, merge distance
Visual Options: Show/hide boxes, labels, depleted levels
Label Customization: Compact/Full/Touch Only modes, size options
Colors: Buyers (green), Sellers (red), Flipped (orange), Depleted (gray)

🎯 SHORT BAG DETECTOR🎯 SHORT BAG DETECTOR: The Liquidation Squeeze Signal
💡 What This Indicator Does
The SHORT BAG DETECTOR is a powerful volatility and volume-based indicator designed to identify high-probability price areas where trapped short sellers (those holding a "short bag" of losing positions) are most vulnerable to a short squeeze or liquidation event.
It automatically scans for a rare confluence of three critical market conditions, generating a single, high-conviction signal (the large orange marker) for optimal entry timing.
🔎 The 3 Confluence Conditions
The main OLD BAG DETECTED! signal only triggers when all three of the following conditions occur simultaneously:
Old Level Touch: The price returns to a significant, aged historical pivot high or low price (established over the last 150 days). This level represents the average entry price for a large number of short or long positions.
Significant Gap: The current day opens with a meaningful price gap (user-defined percentage) against the direction of the trapped traders. This creates immediate urgency and stress for the "bag holders."
Volume Spike: The signal is confirmed by a massive volume spike (user-defined multiplier over average volume). This confirms that the movement is driven by forced liquidation (short-covering) and aggressive buying/selling, not just minor market noise.
📊 Key Features
High-Conviction Orange Signal: Marks the optimal timing for a potential squeeze/reversal driven by short liquidation.
Gap Markers (Green/Red): Clearly identifies significant bullish and bearish gaps on the chart.
Toggleable Minor Levels (Blue Labels): Shows all historical pivot levels being tracked for full context (can be easily disabled in the settings to reduce chart clutter).
📈 How to Use the Signal
The indicator is best used to identify continuation trades or volatile reversals. When the OLD BAG DETECTED! signal appears:
Bullish Signal (When price gaps up to an old low): Indicates a strong potential reversal as shorts from that low level are forced to cover.
Bearish Signal (When price gaps down to an old high): Indicates a potential reversal as longs from that high level are forced to liquidate.
This tool is perfect for traders looking to capitalize on volatility events and forced liquidations.

Mebane Faber GTAA 5In 2007, Mebane Faber published research that challenged the conventional wisdom of buy-and-hold investing. His paper, titled "A Quantitative Approach to Tactical Asset Allocation" and published in the Journal of Wealth Management, demonstrated that a simple timing mechanism could reduce portfolio volatility and drawdowns while maintaining competitive returns (Faber, 2007). This indicator implements his Global Tactical Asset Allocation strategy, known as GTAA5, following the original methodology.
The core insight of Faber's research stems from a century of market data. By analyzing asset class performance from 1901 onwards, Faber found that a ten-month simple moving average served as an effective trend filter across major asset classes. When an asset trades above its ten-month moving average, it tends to continue its upward trajectory; when it falls below, significant drawdowns often follow (Faber, 2007, pp. 12-16). This observation aligns with momentum research by Jegadeesh and Titman (1993), who documented that intermediate-term momentum persists across equity markets.
The GTAA5 strategy allocates capital equally across five diversified asset classes: domestic equities (SPY), international developed markets (EFA), aggregate bonds (AGG), commodities (DBC), and real estate investment trusts (VNQ). Each asset receives a twenty percent allocation when trading above its ten-month moving average. When an asset falls below this threshold, its allocation moves to short-term treasury bills (SHY), creating a dynamic cash position that scales with market risk (Cambria Investment Management, 2013).
The strategy's historical performance during market crises illustrates its function. During the 2008 financial crisis, traditional sixty-forty portfolios experienced drawdowns exceeding forty percent. The GTAA5 strategy limited losses to approximately twelve percent by reducing equity exposure as prices declined below their moving averages (Faber, 2013). This asymmetric return profile represents the strategy's primary characteristic.
This implementation uses monthly closing prices retrieved via request.security() to calculate the ten-month simple moving average. This distinction matters, as approximations using daily data (such as a 200-day moving average) can generate different signals during volatile periods. Monthly data ensures the indicator produces signals consistent with published academic research.
The indicator provides position monitoring, automatic rebalancing detection on either the first or last trading day of each month, and share calculations based on user-defined capital. A dashboard displays current trend status for each asset class, target versus actual weightings, and trade instructions for rebalancing. Performance metrics including annualized volatility and Sharpe ratio provide ongoing risk assessment.
Several limitations warrant acknowledgment. First, the strategy rebalances monthly, meaning it cannot respond to intra-month market crashes. Second, transaction costs and taxes from monthly rebalancing may reduce net returns for taxable accounts. Third, the ten-month lookback period, while historically robust, offers no guarantee of future effectiveness. As Ilmanen (2011) notes in "Expected Returns", all timing strategies face the risk of regime change, where historical relationships break down.
This indicator serves educational purposes and portfolio monitoring. It does not constitute financial advice.
References:
Cambria Investment Management (2013). Global Tactical Asset Allocation: An Introduction to the Approach. Research Report, Los Angeles.
Faber, M.T. (2007). A Quantitative Approach to Tactical Asset Allocation. Journal of Wealth Management, Spring 2007, pp. 9-79.
Faber, M.T. (2013). Global Asset Allocation: A Survey of the World's Top Asset Allocation Strategies. Cambria Investment Management, Los Angeles.
Ilmanen, A. (2011). Expected Returns: An Investor's Guide to Harvesting Market Rewards. John Wiley and Sons, Chichester.
Jegadeesh, N. and Titman, S. (1993). Returns to Buying Winners and Selling Losers: Implications for Stock Market Efficiency. Journal of Finance, 48(1), pp. 65-91.

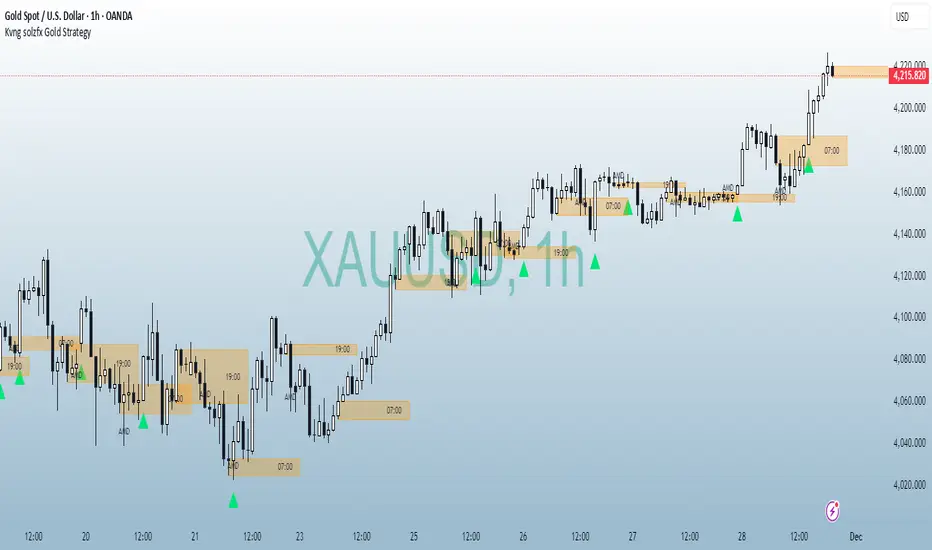
Kvng solzfx Gold StrategyThis indicator helps to find gold setups using kvng solz fx buy only strategy on gold
DTR SL-TPDTR SL-TP is a simple risk-management indicator designed to automatically plot stop-loss and take-profit levels based on the current market price. It helps traders visualize their risk-to-reward setup directly on the chart, making trade planning faster and more consistent.
The indicator uses two main inputs: a Stop Loss Percentage and a Take Profit Multiplier. The stop loss is calculated by reducing the current price by the chosen percentage. The take profit level is set by multiplying that same percentage by the Take Profit Multiplier and adding it to the current price. This creates a dynamic stop-loss and take-profit pair that updates with every candle.
The stop-loss line is plotted in red, and the take-profit line is plotted in green for immediate visual clarity. Traders can adjust the percentage and multiplier to match their personal risk tolerance or strategy requirements.
DTR SL-TP is useful for any style of trading that requires predefined exit levels, including scalping, day trading, and swing trading. It helps maintain discipline, enforce consistent risk management, and quickly evaluate whether a potential trade offers an acceptable reward-to-risk ratio.

High/Low Sweep Dashboard Heatmap/Table (Final v4)The High/Low Sweep Dashboard v6 is a versatile TradingView indicator that analyzes the past N candles to track how many times the high, low, both, or neither levels were taken out. It provides a clear visual summary through either a table or heatmap, with percentages for each category.
Key Features:
- Toggle between Table or Heatmap display.
- User-selectable dashboard position: Upper Right or Lower Right.
- Track sweep data over a custom number of candles.
- Optional markers on the chart for when both or none of the levels are taken.
- Clear percentage breakdowns for each sweep type.
This indicator is ideal for traders who want a quick overview of high/low sweeps and candle behavior over a defined historical window.

Local Watchlist Gauge v6The Local Watchlist Gauge displays a compact monitoring table for a user-defined list of symbols, showing their current trend status and performance relative to their 52-week high.
The indicator presents a table that simultaneously tracks multiple symbols and displays:
• Trend direction for each symbol, determined by whether the closing price is above or below a user-defined moving average
• Percentage distance from the 52-week high, providing a clear measure of recent performance relative to the yearly peak
Each symbol is displayed with:
Trend indicator showing whether the symbol is in an uptrend (above moving average) or downtrend (below moving average)
Distance from 52-week high expressed as a percentage, with color coding to indicate proximity to recent highs
Green indicates symbols trading within 5% of their 52-week high, orange indicates symbols between 5% and 20% below their 52-week high, and red indicates symbols trading more than 20% below their 52-week high.
The table provides an at-a-glance summary of the trend status and relative performance of all symbols in the specified watchlist, allowing users to quickly identify which instruments are maintaining trend strength near their recent highs and which have experienced significant pullbacks from their yearly peaks.
