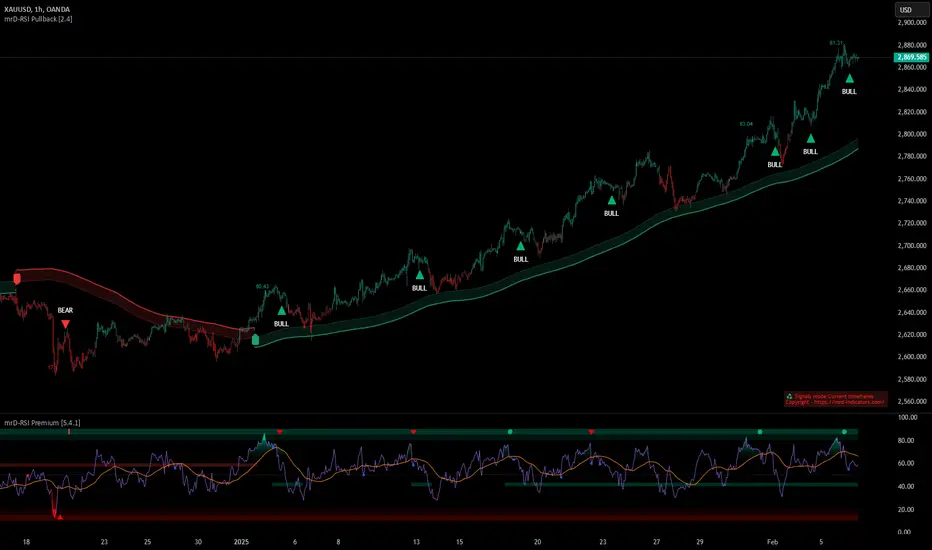
mrDAlgo PremiumBUY / LONG when the Trend Catcher Trend Line cuts upwards and the candle will be green, and the cut candle is above the blue clouds.
SELL / SHORT when the Trend Catcher Trend Line crosses downwards and then the candle cluster will be red, and the prices are below the red clouds.
Moving averages help assess the main trend:
- The price is completely below the moving averages, showing that the downtrend is happening.
- The price is completely above the moving averages indicating an ongoing uptrend.
- The price completely crosses the moving averages showing a sideways trend.
Setting:
A sensitivity setting is recommended for trend confirmation signals.
Show/hide trend catcher
Show/Hide Moving Averages
Alerts: Warn when the signals confirm the trend.
Candle color mode:
Green candle: Strong buy.
Red candle: Strong selling is active.
Purple Candle: Normal buy or sell signal is active.
EQ Cloud: When enabled, a simple "cloud"-like indicator will be displayed on your chart.
The EQ Cloud has a similar effect to the Ichimoku Cloud and can identify the current trend and act as to subsequent support and resistance.
This toolkit is made up of different tools all in one indicator to create your own unique trading strategies.
General disclaimer:
Trading stocks, futures, forex, options, ETFs, cryptocurrency, or any other financial instrument has huge potential rewards but also huge risks.
You must be aware of the risks and willing to accept them to invest in stocks, futures, forex, options, ETFs, or cryptocurrencies.
Don't trade with money you can't afford to lose.
This is not an offer or an offer to Buy/Sell stocks, futures, Forex, options, ETFs, cryptocurrencies, or any other financial instrument.
Do not represent that any account will or is likely to achieve profit or loss of any kind.
Past performance of any trading system or method is not necessarily indicative of future results.
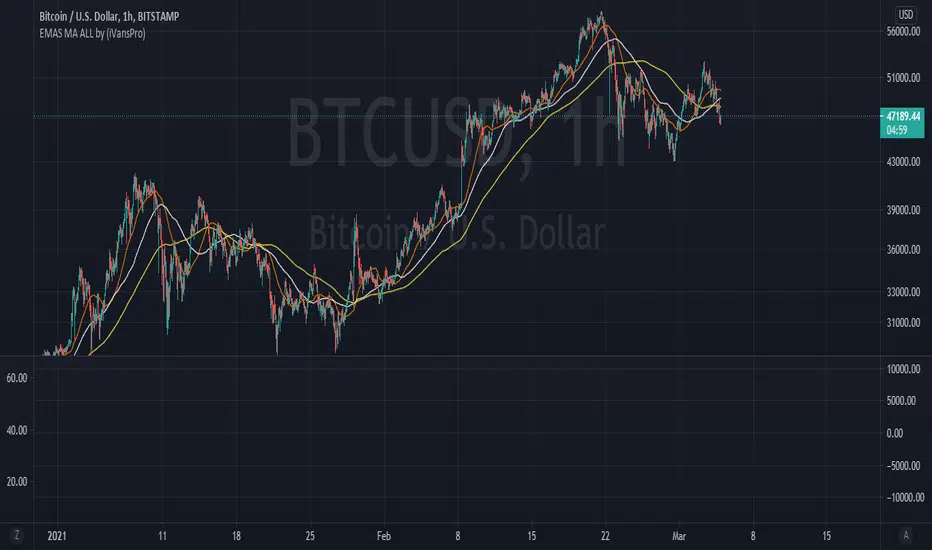
EMAS
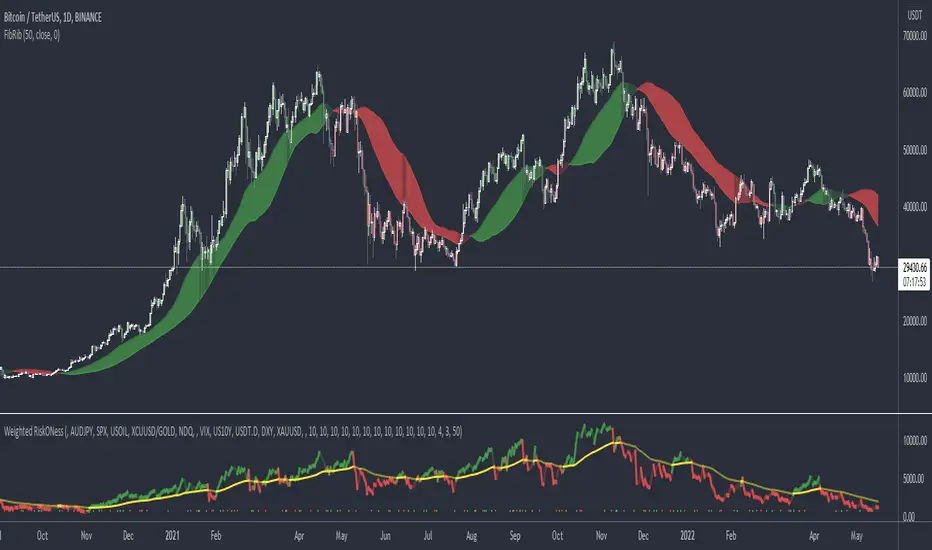
Fibonacci RibbonThe Fibonacci Ribbon (FibRib) creates two Fibonacci moving averages: essentially a Fibonacci WMA and a Fibonacci EMA.
The ribbon colors based on which is higher and where PA is relative to the ribbon.
Optional colored candles shades candles the same color as the ribbon.
OpenCipher AOpenCipher A is an open-source and free to use Overlay.
Features:
EMA Ribbons (Lengths: 5, 11, 15, 18, 21, 25, 29, 33)
Symbols ("Be careful" and "attention required" signals)
EMA Ribbons
The EMA RIbbons are a set of exponential moving averages. Blue and white ribbons = uptrend, gray ribbons = downtrend. The ribbons can act as support in uptrends and as resistance in downtrends.
Lengths and source of the ribbons are customizable.
Symbols
Green Dots: The green dot is a bullish symbol that appears whenever the EMA 11 crosses over EMA 33.
Red Cross: The red cross is a bearish symbol that appears whenever the EMA 5 crosses under EMA 11.
Blue Triangle: The blue triangle marks a possible trend reversal that appears whenever the EMA 5 crosses over EMA 25 while EMA 29 is below EMA 33.
Red Diamond: The red diamond is a bearish symbol that marks a potential local top whenever a bearish wavecross occurs (fast wave crosses under slow wave).
Yellow X: The yellow X is a warning signal that appears whenever a bearish wavecross occurs while the slow wave of the wavetrend is below -40 and the moneyflow is in the red (below zero).
Blood Diamond: The blood diamond is a bearish symbol that highlights whenever the red diamond and the red cross appear on the same candle.
Usage
Treat the symbols as signs that your attention might be required and don't trade based on them.

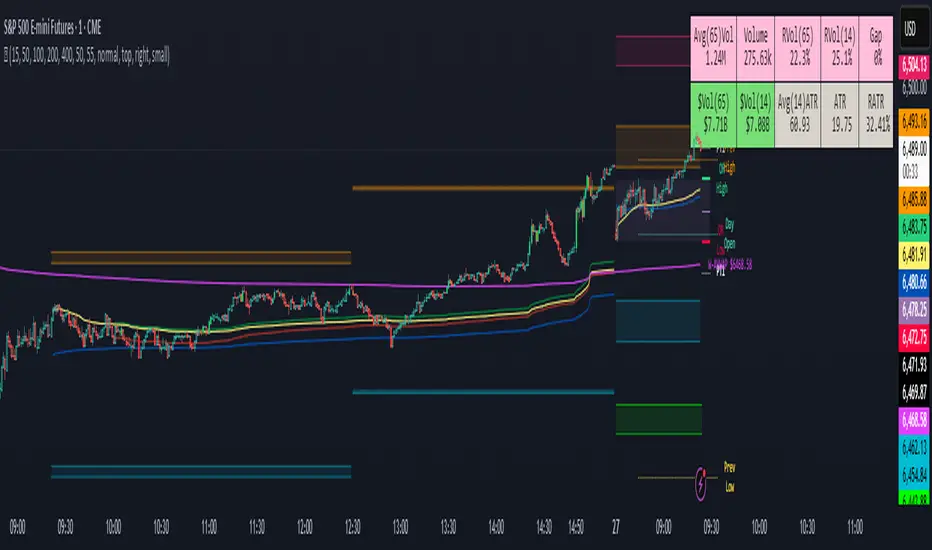
Three Legged GooseThree Legged Goose
Three-Legged Goose is an all-in-one intraday trading system.
It features a sleek and customizable Opening range overlay with infinitely generating price targets, Average Daily Range Zones, Curated Anchored VWAPs, Total Volume and ATR analysis, as well as our state of the art Market Momentum Trend detection.
Three-Legged Goose also has important Daily levels, including the Previous Day's High and Low and the Current Days Open, three fully customizable Exponential Moving Averages, a customizable ema cloud, and a toggleable standard vwap.
Using this indicator allows you to get rid of any unnecessary indicators that are taking up those valuable slots in TradingView.
AVWAP + ORBS:
The Opening Range Breakout system builds off of our recommended 15min opening range and does all of your price target calculations based on the width of the opening range. These targets are fully customizable within the settings,
to allow fine-tuning from ticker to ticker. We have programmed three Anchored vwaps at different time intervals to act as a dynamic trend-finding instrument. These, along with the opening range breakout system, can help you quickly spot the day's trend and dynamic support and resistance long before your standard moving averages have caught up with price intraday.
Average Daily Range Zones:
We believe these zones to be essential to trading, especially with our system. These zones tend to act as areas of major support and resistance as well as give an idea of the projected volatility of the underlying.
Market Momentum Trend Detection:
We paint our momentum analysis directly on your candles. By taking the overall Market Internals + the underlying's Price movement, we can determine areas where we feel comfortable adding risk on or taking risk off.
This will help those that struggle at identifying trends and valid reversals.
All of the default settings are our recommended settings.
Please check the Author Instructions Below for how to gain access to our indicators.
Waddah Attar Explosion V3 [NHK] -Bollinger - MACDWaddah Attar Explosion Version3 indicator to work in Forex and Crypto, This indicator oscillates above and below zero and the Bollinger band is plotted over the MACD Histogram to take quick decisions, Colors are changed for enhanced look. dead zone is plotted in a background area and option is provided to hide dead zone. One can easily detect sideways market movement using Bollinger band and volume. when volume is in between Bollinger band no trades are to be taken as volume is low and market moving in sideways
credits to: @shayankm and @LazyBear
Read the main description below...
- - - - - - - - - - - - - - - - - - - - - - - - - - - - - - - - - - - - - - -
This is a port of a famous MT4 indicator. This indicator uses MACD /BB to track trend direction and strength. Author suggests using this indicator on 30mins.
Explanation from the indicator developer:
"Various components of the indicator are:
Dead Zone Line: Works as a filter for weak signals. Do not trade when the up or down histogram is in between Dead Zone.
Histograms:
- Pink histogram shows the current down trend.
- Blue histogram shows the current up trend.
- Sienna line / Bollinger Band shows the explosion in price up or down.
Signal for ENTER_BUY: All the following conditions must be met.
- Blue histogram is raising.
- Blue histogram above Explosion line.
- Explosion line raising.
- Both Blue histogram and Explosion line above DeadZone line.
Signal for EXIT_BUY: Exit when Blue histogram crosses below Explosion line / Bollinger Band.
Signal for ENTER_SELL: All the following conditions must be met.
- Pink histogram is raising.
- Pink histogram above Explosion line.
- Explosion line raising.
- Both Pink histogram and Explosion line above DeadZone line.
Signal for EXIT_SELL: Exit when Pink histogram crosses below Explosion line.
All of the parameters are configurable via options page. You may have to tune it for your instrument.

Multiple Indicator 50EMA Cross AlertsHere’s a screener including Symbol, Price, TSI, and 50 ema cross in a table output.
The 50 Exponential Moving Average is a trend indicator
You can find bullish momentum when the 50 ema crossed over or a bearish momentum when the 50 ema crossed under we are looking to take advantage by trading the reversion of these trends.
True strength index (TSI) is a trend momentum indicator
Readings are bullish when the True Strength Index shows positive values
Readings are bearish when the indicator displays negative values.
When a value is above 20, we look for selling overbought opportunity and when the value is under 20, we look for buying oversold opportunity.
You can select the pair of your choice in the settings.
Make sure to create an alert and choose any alerts then an alert will trigger when a price cross under or cross over the 50 ema for every pair separately.
This allow the user to verify if there is a trade set up or not.
Disclaimer
This post and the script don’t provide any financial advice.

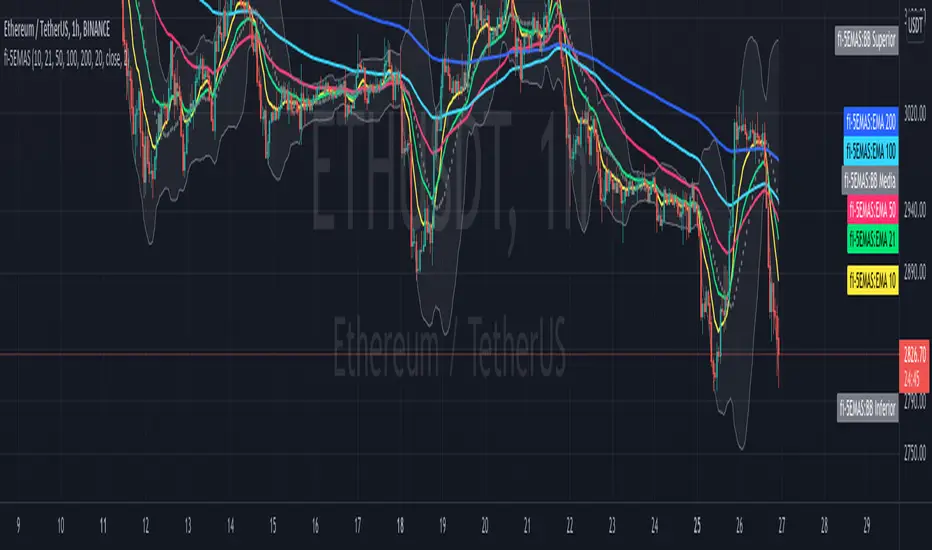
fi - 5EMA + BB - 5 emas en un mismo indicador junto con las bandas de bollinguer.
- Opcion de timeframe
- Actualizado a version 5
//Indicador adaptado a medida sobre "4EMA lines EMA Cross @Philacone + Bollinger Bands by Alessiof"
//Todos los méritos para Alessiof, muchas gracias!!!
Sentimental Cycles with CrossingsThis indicator provides the following options, where you can choose to display:
DEMA TEMA cycles, filtered by default with sentiment.
Sentiment cloud, based on the 200ema area between the 1 minute and 1 hour lines.
One or both ema crossings with their respective timeframes (independent from current chart timeframe) and optional line display.
One or two tickers and their respective crossings based on selected timeframes.
Additional EMA lines supplied with their very own timeframe.
This indicator is intended to be used any way suitable to the user, nearly every aspect is customizable, and the defaults are just enough to get you started on deciding whether it's time to enter calls or puts.
TIPS for optimal results:
- Try using 2 charts: the 1 minute and the 1 hour per symbol. Under the 1 minute chart, use the 3 minute and 5 minute timeframe for crossings.
- Try to start a position when a sentimental DEMA TEMA cloud is beginning to form. The first bar usually pays thicc.
- Tickers SPY and VXX can be of good reference for market direction. If all crossings coincide, it's because there's a strong momentum in a certain direction for the market.

Heikin-Ashi Trend AlertThis script:
Adds a Heikin-Ashi line to the chart (EMA-based).
Provides alerts triggered when the color goes from green to red and vice versa.
Just add the indicator to the chart, create an alert and select " Heikin-Ashi Trend Alert " from the dropdown. Profit.

Moving Average Band Width ((((20/04/2022))))Todays Script uses 5 Moving Averages with the new function on V5 called fill, we can now colour fill between moving averages.
9ema
20ema
50ema
100ema
200ema
100-200ema which is labelled in Redis where the big impulse moves will fall into if the pressure is so strong on the opposite of the trend.
50-100ema which is labelled in Blue is where price could be heading in a healthy trend
20-50ema which is labelled in Purple, price will enter this area when price is in a strong impulse move/trend
9-20ema which is labelled in Green is a super strong trend/ impulse move, price will most likely break this stream and enter the 20-50ema
(the colour of EMAS can be changed in the settings)
I would use this to either gauge the strength of a trend//impulse leg or buy/sell opportunities.
This works best in trending environments, LTF and liquid markets


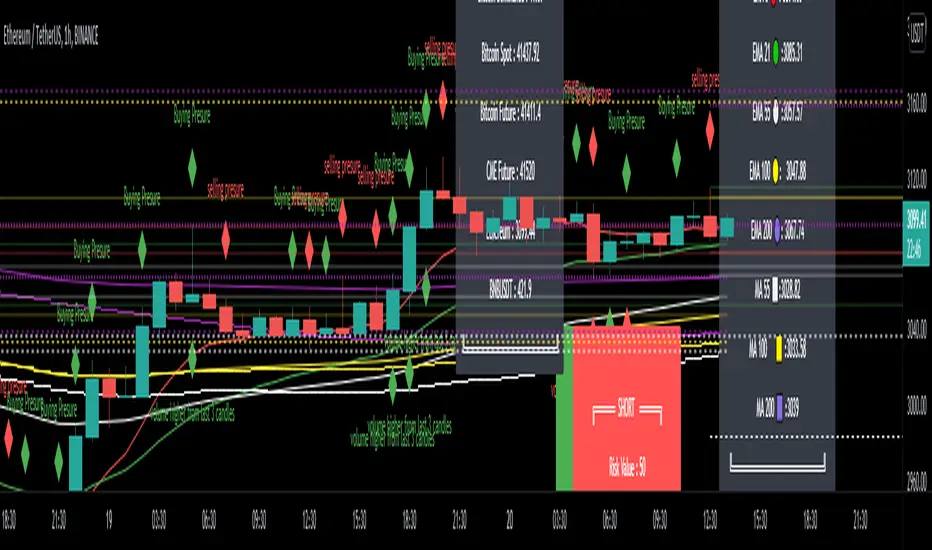
EMA - MA 21/55/100/200 Horizontal Lines & Labels & Risk RewardThis indicator will help you to get dynamic support lines of EMA 21,55,100,200 and MA 55,100,200. You can get the Price of EMA And MA in Labels also.
Solid Lines Extended Both Sides - 4 Hours Dynamic Support Resistance of EMA and MA
Dotted Lines Extended Right Side - 1 Day Dynamic Support Resistance of EMA and MA
Dashed Lines Extended Left Side - 1 Hour Dynamic Support Resistance of EMA and MA
Donate Me for My Work :
BTC(BEP20) :- 0x690fb613895dda012e93dfd35564517311b0f4f0
BNB(BEP20) - 0xE1eE3cF8bf462e1575980df2564a8ee4841f39B0
ETH(ERC20) - 0xE1eE3cF8bf462e1575980df2564a8ee4841f39B0
Hope It will help you.
Trade with your own risk. I am not liable for any loss and profit based on this indicator.
Thank you.
3EMA + Boullinger + PIVOTTRES EMAS + BANDAS DE BOLLINGER + PIVOTE
INDICADOR 1: TRES EMAS (MEDIA MOVIL EXPONENCIAL)
Con este indicador puede visualizar el promedio de precios con mayor peso a los datos mas recientes.
Se calculan y dibujan tres medias móviles exponenciales: 8, 20 y 200 últimas velas.
-Rápida EMA1 = 8
-Media EMA2 = 20
-Lenta EMA 3 = 200
INDICADOR 2: BANDAS DE BOLLINGER
Con este indicador podrá ver la fuerza y la tendencia del mercado, es decir la mide la volatilidad del precio del activo.
Si el precio sobrepasa la banda superior, el activo está sobrecomprado.
Si el precio sobrepasa la banda inferior, el activo está sobrevendido.
Longitud tendencia - BASE = 20, paso = 1
Desviación Estándar - Multiplicador = 2, paso = 0.2
INDICADOR 3: PIVOTE
Este indicador etiqueta los puntos donde el precio es mínimo y máximo, en un rango de velas determinado en el parámetro "Distancia para el Pivote".
Estos 3 indicadores sirven para todo tipo de activos: FOREX, CRIPTO, CFD´s, ETC.
------------------------------------------------------------------------------------------------------------------
THREE EMAS + BOLLINGER BANDS + PIVOT
INDICATOR 1: THREE EMAS ( EXPONENTIAL MOVING AVERAGE )
With this indicator you can visualize the average of prices with greater weight to the most recent data.
Three exponential moving averages are calculated and drawn: 4, 20 and 200 last candles.
-Fast EMA1 = 8
-Average EMA2 = 20
-Slow EMA 3 = 200
INDICATOR 2: BOLLINGER BANDS
With this indicator you can see the strength and trend of the market, that is, it is measured by the volatility of the asset price.
If the price goes above the upper band, the asset is overbought.
If the price goes above the lower band, the asset is oversold.
Trend length - BASE = 20, step = 1
Standard Deviation - Multiplier = 2, step = 0.2
INDICATOR 3: PIVOT
This indicator labels the points where the price is minimum and maximum, in a range of candles determined in the parameter "Distance to Pivot".
These 3 indicators are used for all types of assets: FOREX, CRYPT, CFD's, ETC.

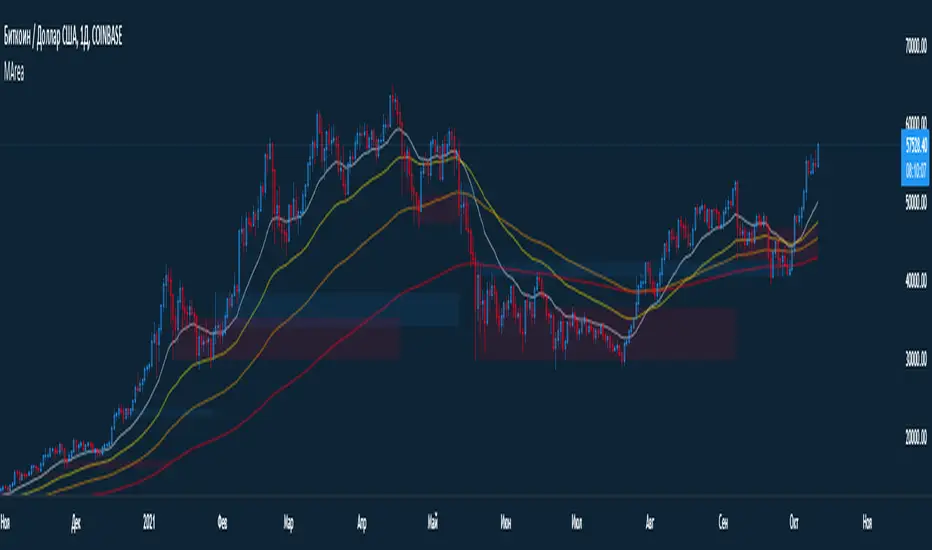
GBTT Range Wave IndicatorOverview:
This script is a type of mean reversion indicator, it uses a short period EMA, the EMA5 to be exact, as its basis for a mean. From here, we run a modified version of ATR over a longer period of time to find an average range value for price movement. Finally, we calculate the cloud/band/wave by multiplying this range value by our deviation values to produce areas where the price could be considered too far from the mean (similar to an oversold or overbought scenario).
Additionally, we wrote this script with a goal to reduce or eliminate repainting. In the code, we have utilized OPEN values (instead of CLOSE) and previous candle values (not the current candle) to build all the data for the algorithm here to avoid the waves constantly moving and changing their values on real time candles. That said, this is NOT a guarantee that it will never repaint.
What you see:
Visually, the waves are always on the chart. Optionally, we provide a custom standard deviation channel based off the EMA5 (represented with a blue shading) and/or a simple ema5/21 crossover cloud. These can be used for additional confluence if desired, but are not necessary for the core function of the indicator which would be the upper and lower wave.
Intended use:
To provide educational content about the short term movement of an asset. Designed to be run on any time frame.
Disclaimer:
NOT intended to be a sole source of Technical Analysis or anything more than an educational tool!

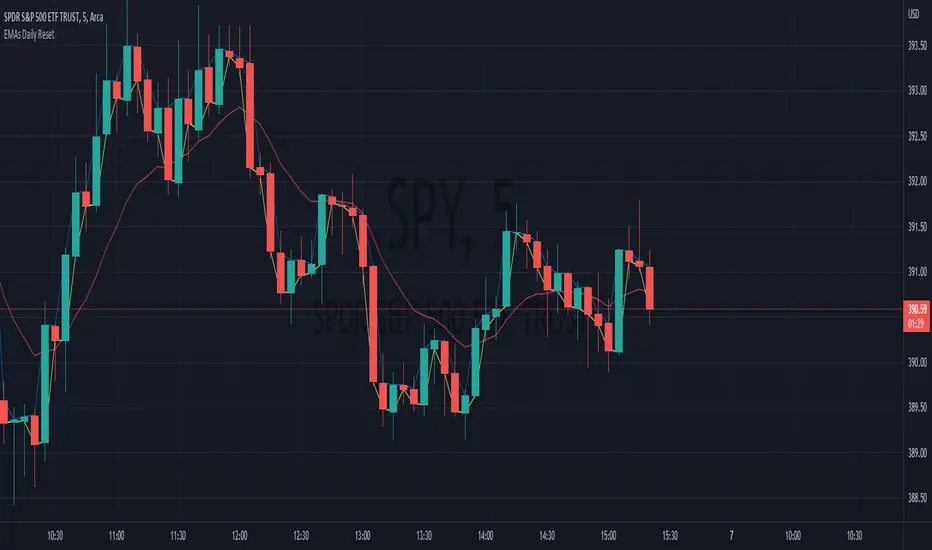
EMAs Daily ResetThis indicator displays 3 EMAs that recalculate every day.
This is useful for intraday trading by removing the bias of the previous day's ema price. This ensures your EMAs stay near the most current price action.
Note: If your length is larger than the number of bars in the day, your EMAs will not have time to properly catch up in the day.
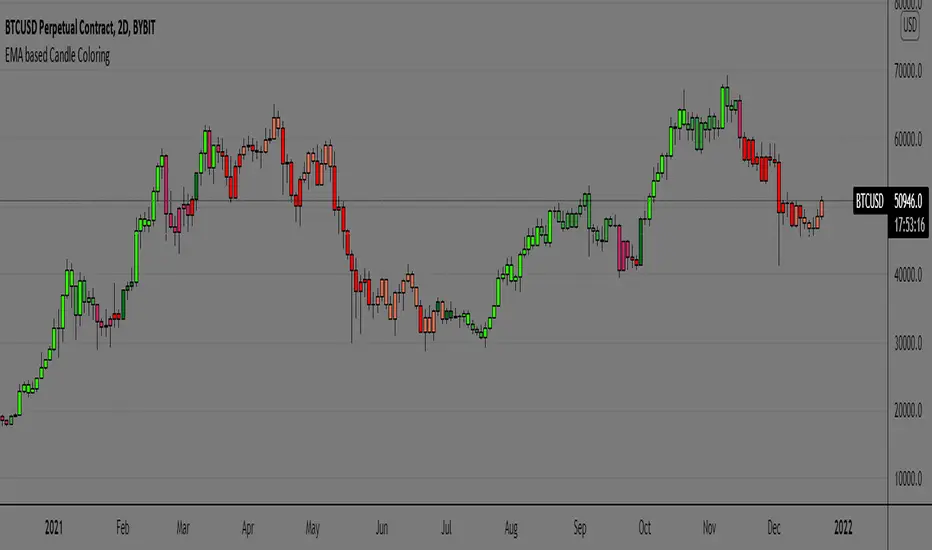
EMA based Candle ColoringEMA or Exponential Moving Average (EMA) is a technical indicator used in trading practices that shows how the price of an asset or security changes over a certain period of time. The EMA is different from a simple moving average in that it places more weight on recent data points (i.e., recent prices)
In this script plain EMA or MA is not used for candle coloring, but it takes multiple EMAs of the original EMA and then subtracts lag from the result to get data points of each candle of two certain periods defined. As it differs from traditional EMAs and MAs by reacting quicker to price changes and is able to subtract lag with its calculated formula.
The candle coloring is able to interpret short-term price direction and overall trend and its suitable for active traders. As it tracks price more closely than SMAs
Since EMAs can also provide support or resistance for price and is highly reliant on the asset’s lookback period we can make sure we stay with the trend rather than going against the trend.
*First of all here's what the colors represent and how to interpret them is shown in below image
Examples of how I use the Coloring pattern
Spotting a fakeout/stophunt
during trends:
* No strategy is 100% accurate this script is one of those too , traders must use this as an addition to their system rather than making it a standalone system.
* Context is important as the coloring is done using calculations, different timeframes has different context hence traders discretion is key.
Hope you find this helpful,
Thankyou.
happy trading.
GreatBlueTradingTeam FibDev SignalsScript Purpose:
This script was designed to look for trend reversals and be used with other TA tools to help build confluence for day traders.
TA Used:
Without diverging too much information, this script relies on Highs, Lows, Opens, EMAs, Standard Deviations, Fib Numbers, and Fib Levels.
Script Overview:
First we look at the price action found on the Daily chart to create a set of zones using Fibs and Standard Deviations thats serves as our gauge on how far the price will move on any given day. Then, we create another set of zones ("intraday" zones if you will) that are built on much faster price action and relevant to the chart time period that is selected. These zones are also created using a combination of Fibs and Standard Deviations. From here, we compare the intraday price action with these two zones and look for areas where we feel overbought or oversold conditions are forming to create the bullish or bearish signals provided by the indicator.
Script Shortcomings:
Due to the fact this script is looking for breaks in trends, or trend reversals, it is subject to high risk especially in times of strong market trends where it could experience repeated failed signals. We recommend using this script in combination with other forms of TA for additional confluence as well as general market awareness that may influence trends and market behavior.
Script Access:
Please PM us to obtain information about accessing this script, or view our profile for contact information.

PowerBandsENGLISH:
PowerBands is an exclusive product of ApiDevs , it is designed to replace the use of traditional exponential mobile media, by an intuitive band system that allows the trader to operate in favor of the trend.
The PowerBands, it has a band built with an ema10 and an ema55, it also has a built-in smart EMA100 that changes color according to the movement of high and low prices, as well as an EMA200, which will set the market trend.
In addition, it has an (ATR) to define an almost infallible stop loss margin, so that the trader can let the profits run and minimize the losses. If you want to know more about this wonderful indicator, please visit the link on our website found in the direct access buttons, or in the AUTHOR INSTRUCTIONS box.
ESPAÑOL:
PowerBands es un producto exclusivo de ApiDevs , está diseñado para reemplazar el uso de medios móviles exponenciales tradicionales, por un sistema de banda intuitivo que permita al trader operar a favor de la tendencia.
La PowerBands, tiene una banda construida con un ema10 y un ema55, también tiene un EMA100 inteligente incorporada que cambia de color según el movimiento de precios altos y bajos, así como un EMA200, que marcará la tendencia del mercado.
Además, tiene un (ATR) para definir un margen de stop de perdida casi infalible, de modo que el trader pueda dejar correr las ganancias y minimizar las pérdidas. Si deseas conocer mas sobre este maravilloso indicador, por favor visita el enlace de nuestra página web que se encuentra en los botones de acceso directo, o en la caja de INSTRUCCIONES DEL AUTOR.

MA + VolumeAreaMade a stripped-down version of the script.
Later it will be supplemented with other functions.
In assembly:
-4 EMA
-The bull / bear area from the volume candlestick data.
In the settings, you can change the size of the array and the amount of sampled data in it.
p.s I cut all my scripts for convenient work for you. Stay tuned! Good luck.
Standard deviation of the exponential moving average
This indicator emphasizes price movements when it moves away from or closer to the chosen moving average, within the envelope of its standard deviation. It serves as a complement to other indicators or can be used within a strategy by itself.

EMAC - Exponential Moving Average Cross - StudyEMAC - Exponential Moving Average Cross - Study
This is the short Study version of EMAC that has been optimized for TradersPost alerts only
For the original full Strategy version with many editable inputs please see EMAC - Exponential Moving Average Cross
For the full Strategy version with the best currently known optimized inputs (average best settings across 26 tickers) please see EMAC - Exponential Moving Average Cross - Optimized

EOD re-entriesThis indicator is designed to compliment another of my trading scripts which gives signals for long-term trends on the daily chart. Here, I'm using the same daily 50 and 200MAs, but projecting them on the 4 hour chart to potentially catch faster trade re-entry points.
There are built in alerts for the following:
- Long: The price closed above the daily 50 MA while the 4 hour VWAP is above the MVWAP
- Long: The price closed above the daily 200 MA while the 4 hour VWAP is above the MVWAP
- Short: The price closed below the daily 50 MA while the 4 hour VWAP is below the MVWAP
- Short: The price closed below the daily 200 MA while the 4 hour VWAP is below the MVWAP
- VWAP long re-entry (large green triangle): The price closes above the VWAP and both the 50 & 200 MAs
- VWAP short re-entry (large red triangle): The price closes below the VWAP and both the 50 & 200 MAs
- EMA long re-entry (small green triangle): 4 EMAs of your choosing are fanning out above the 50 & 200 MAs when the price is above VWAP
- EMA short re-entry (small red triangle): 4 EMAs of your choosing are fanning out below the 50 & 200 MAs when the price is below VWAP
All of the above are filtered against stochastic RSI and numerous other oscillators to reinforce the signals.
This is a private script. Please DM me for access.
