Friday & Monday HighlighterFriday & Monday Institutional Range Marker — Know Where Big Firms Set the Trap!
🧠 Description
This indicator automatically highlights Friday and Monday sessions on your chart — days when institutional players and algorithmic firms (like Citadel, Jane Street, or Tower Research) quietly shape the upcoming week’s price structure.
🔍 Why Friday & Monday matter
Friday : Large institutions often book profits or hedge into the weekend. Their final-hour moves reveal the next week’s bias.
Monday : Big players rebuild positions, absorbing liquidity left behind by retail traders.
Together, these two days define the range traps and breakout zones that often control price action until midweek.
> In short, the Friday–Monday high and low often act as invisible walls — guiding scalpers, option sellers, and swing traders alike.
🧩 What this tool does
✅ Highlights Friday (red) and Monday (green) sessions
✅ Adds optional day labels above bars
✅ Works across all timeframes (best on 15min to 1hr charts)
✅ Helps you visually identify where institutions likely built their positions
Use it to quickly spot:
* Range boundaries that trap traders
* Gap zones likely to get filled
* High–low sweeps before reversals
⚙️ Recommended Use
1. Mark Friday’s high–low → Watch for liquidity sweeps on Monday.
2. When Monday holds above Friday’s high , breakout continuation is likely.
3. When Monday fails below Friday’s low , expect a reversal or trap.
4. Combine this with OI shifts, IV crush, and FII–DII flow data for confirmation.
⚠️ Disclaimer
This indicator is for **educational and analytical purposes only**.
It does **not constitute financial advice** or a trading signal.
Markets are dynamic — always perform your own research before trading or investing.
Expiry

Straddle Charts - Live (Enhanced)Track options straddles with ease using the Straddle Charts - Live (Enhanced) indicator! Originally inspired by @mudraminer, this Pine Script v5 tool visualizes live call, put, and straddle prices for instruments like BANKNIFTY. Plotting call (green), put (red), and straddle (black) prices in a separate pane, it offers real-time insights for straddle strategy traders.
Key Features:
Live Data: Fetches 1-minute (customizable) option prices with error handling for invalid symbols.
Price Table: Displays call, put, straddle prices, and percentage change in a top-left table.
Volatility Alerts: Highlights bars with straddle price changes above a user-defined threshold (default 5%) with a yellow background and concise % labels.
Robust Design: Prevents plot errors with na checks and provides clear error messages.
How to Use: Input your call/put option symbols (e.g., NSE:NIFTY250814C24700), set the timeframe, and adjust the volatility threshold. Monitor straddle costs and volatility for informed trading decisions.
Perfect for options traders seeking a simple, reliable tool to track straddle performance. Check it out and share your feedback!

Black–Scholes model - Options premium calculatorBlack-Scholes Options Pricing Calculator in Pine Script Introduction
The Black-Scholes model is one of the most widely used mathematical models for pricing options. It provides a theoretical estimate of the price of European-style options based on factors such as the underlying asset price, strike price, time to expiration, volatility, risk-free rate, and option type.
This Pine Script implementation of the Black-Scholes options pricing model enables traders to calculate call and put option prices directly within TradingView, helping them assess potential trades more efficiently.
What Does This Script Do?
This script allows traders to input essential option parameters and instantly calculate both call and put option prices using the Black-Scholes formula. It provides:
• A user-friendly interface for inputting option parameters.
• Automatic computation of option prices.
• Real-time updates as market data changes.
Key Features:
• Uses the Black-Scholes formula to compute European call and put option prices.
• User-defined inputs for stock price, strike price, time to expiration, volatility, and risk-free rate.
• Displays calculated option prices on the TradingView chart.
Understanding the Black-Scholes Formula:
The Black-Scholes model is given by the following equations:
C=S0N(d1)−Xe−rtN(d2)C = S_0 N(d_1) - Xe^{-rt} N(d_2) P=Xe−rtN(−d2)−S0N(−d1)P = Xe^{-rt} N(-d_2) - S_0 N(-d_1)
Where:
• CC = Call option price
• PP = Put option price
• S0S_0 = Current stock price
• XX = Strike price
• rr = Risk-free interest rate
• tt = Time to expiration (in years)
• σ\sigma = Volatility of the stock (annualized)
• N(x)N(x) = Cumulative standard normal distribution
• d1d_1 and d2d_2 are given by:
d1=ln(S0/X)+(r+σ2/2)tσtd_1 = \frac{ \ln(S_0/X) + (r + \sigma^2/2)t }{ \sigma \sqrt{t} } d2=d1−σtd_2 = d_1 - \sigma \sqrt{t}
This script implements these calculations efficiently in Pine Script to help traders quickly determine fair values for options based on current market conditions.
Example Calculation:
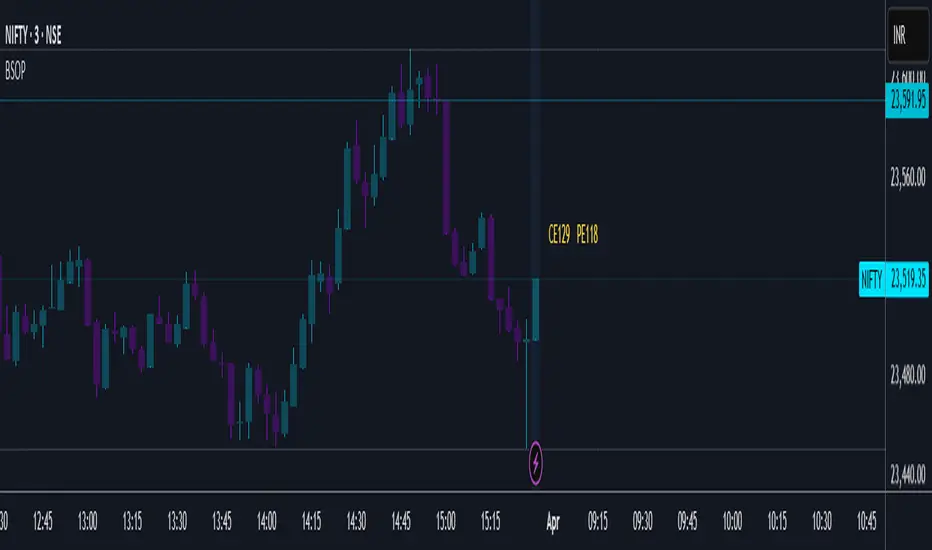
(The following example values were true at the time of publishing this script. Option prices fluctuate constantly, so actual values may vary.)
• Underlying asset price (NIFTY): 23,519.35
• ATM Call Strike Price: 23,500
• ATM Put Strike Price: 23,550
• IV (Implied Volatility) for Call Option: 8.1%
• IV (Implied Volatility) for Put Option: 10.1%
• Expiry Date: April 3, 2025
Using the Black-Scholes model, the calculated theoretical prices are:
• Theoretical ATM CE price: ₹129
• Theoretical ATM PE price: ₹118
For comparison, the actual option prices from the option chain table at the time of writing were:
• Actual ATM CE price: ₹139.70
• Actual ATM PE price: ₹120.30
As we can see, there is a larger difference between the theoretical price and actual market price for the ATM Call option compared to the ATM Put option.
If you're an experienced trader, you likely know how to use this kind of information to identify potential market inefficiencies or trading opportunities.
How to Use This Script:
1. Add the script to your TradingView chart.
2. Input the necessary parameters such as stock price, strike price, volatility, risk-free rate, and time to expiration.
3. View the calculated call and put option prices directly on the chart.
This Black-Scholes options pricing calculator provides a convenient way to compute theoretical option prices within TradingView. It helps traders analyse whether an option is fairly priced based on market conditions.
While the Black-Scholes model has its limitations (e.g., it does not account for early exercise of American options or dividend payments), it remains a powerful tool for European-style options pricing and a foundational concept in financial markets.
A handy little tool! Unfortunately, this script requires manual data entry since automatic data capture is currently not possible. If this ever becomes feasible in the future, an updated version will be released.
Try it out and let me know your feedback!
Disclaimer:
Please note that this is only for study/educational purpose and is just one of the many tools a trader may use.
Use it at your own risk.
Regards!
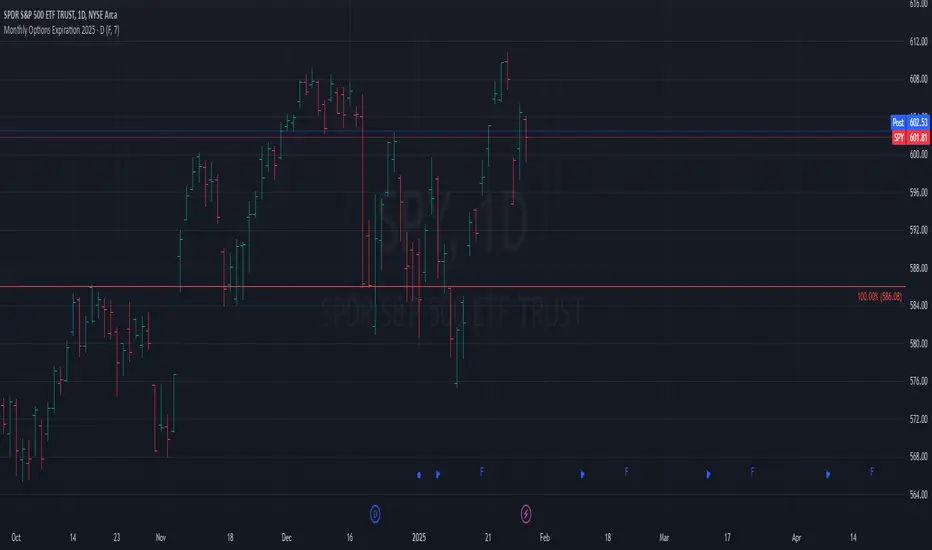
Monthly Options Expiration 2025Monthly Options Expiration 2025
Plots the monthly options expiration dates in advance for the year 2025.
Happy trading and all the best.
Last Friday of MonthThis script marks the last Friday of the month in a daily chart because this is the day when BTC and ETH options expire according to Deribit.
I only found a script that highlights the 3rd Friday of the month, which is not what I wanted.
This script tries to figure out the correct number of days per month but is not aware of holidays which might displace the expiry date.

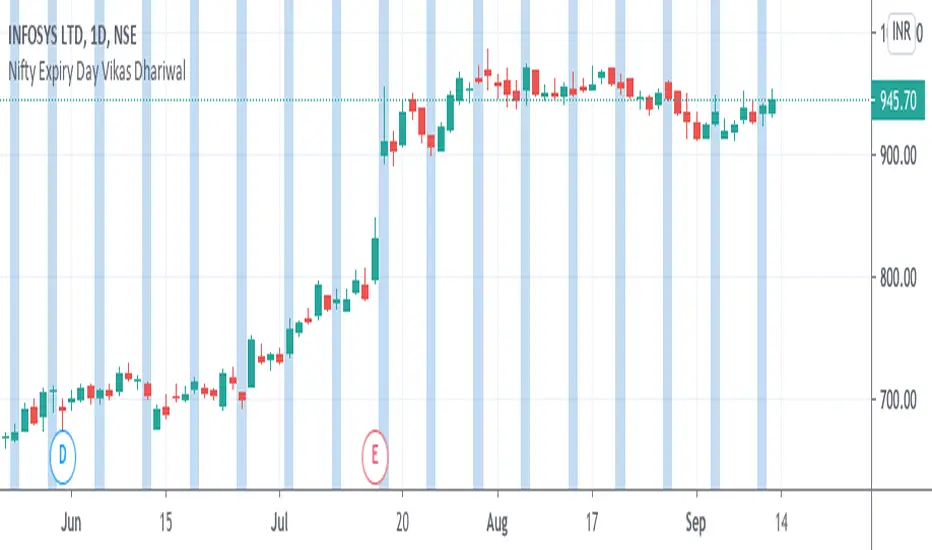
Nifty Expiry Day Vikas DhariwalStrategy for Expiry day plan
Here you can find easy expiry day of nifty and bank nifty
mark Thursday with color to find that day for test any expiry strategy plan
thanks call for more updated 8287335651
Confidence IntervalsThis indicator allows you to be able to see the confidence intervals for whatever asset you are trading given a certain expiry. Confidence intervals project the most probable price ranges over a certain period of time in the future.
In order to use this you must first specify what expiry you want to use in days, so if you want to project the confidence interval 1 day out you would input 1, if you want 1 year out you'd input 252 (the number of trading days in 1 year), if you want 12hrs out you'd input 0.5.
Next you must specify what timeframe you are using on your chart in minutes, so if you're using 5 min chart you'd input 5, if you're using 4hr you'd input 240, if you're using daily charts you'd use 1440.
Finally you must input what standard deviation you want to use for the confidence range.
Confidence levels are really helpful in trading, especially for options, because it allows you to be able to choose a more strategic expiry based on probabilities. In other types of trading such as stocks, futures, and FX confidence levels can be helpful in helping you better plan out your trade by figuring out where price probably will and will not go given a certain period of time in the future. Additionally, confidence levels allow you to be able to visualize volatility expansion and contraction.
Standard Deviation Probabilities:
0.5 STD has a 99% of touching the bounds of the interval and a 50% chance of closing beyond the bounds (these probabilities are not predicated on a certain direction, if you pick a certain direction divide these probabilities by 2)
1 STD has a 64% of touching the bounds of the interval and a ~30-32% chance of closing beyond the bounds (these probabilities are not predicated on a certain direction, if you pick a certain direction divide these probabilities by 2)
1.6 STD has a ~40% of touching the bounds of the interval and a ~20% chance of closing beyond the bounds (these probabilities are not predicated on a certain direction, if you pick a certain direction divide these probabilities by 2)
2 STD has a ~10% of touching the bounds of the interval and a ~5% chance of closing beyond the bounds (these probabilities are not predicated on a certain direction, if you pick a certain direction divide these probabilities by 2)
3 STD has a <2% of touching the bounds of the interval and a <1% chance of closing beyond the bounds (these probabilities are not predicated on a certain direction, if you pick a certain direction divide these probabilities by 2)

Bitcoin Futures Expiry/Settlement DatesVersion 0.9 beta:
- Takes heavy performance showing history expiry dates

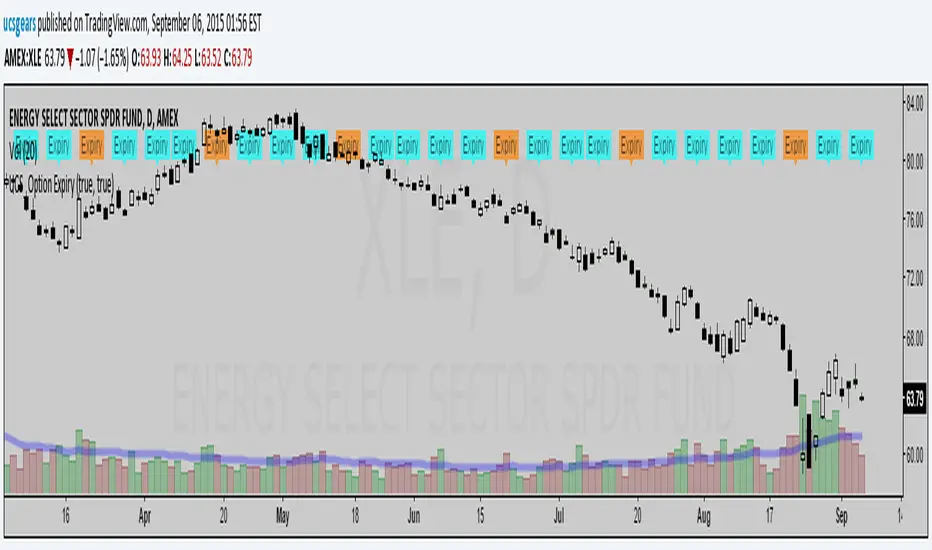
UCS_Option ExpiryThis is an update to two indicators.
The Blue Label would be the Weekly Options Expiry
The Orange Label would be the Monthly Options Expiry.
And you have a choice to pick.
------------------------
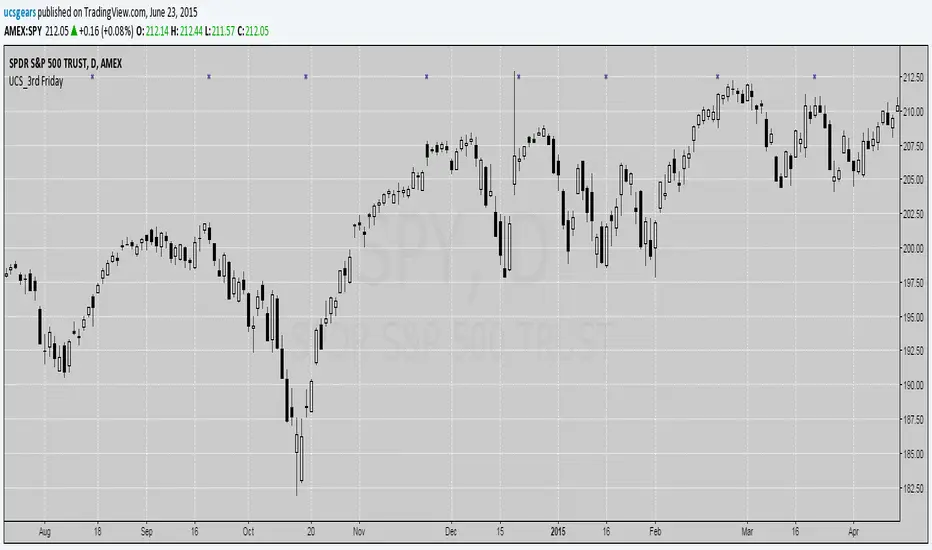
UCS_3rd FridaySimple script to show you a way to find 3rd Fridays (Monthly Options Expiry)
If that friday is a holiday, then it doesn't generate a signal. Futures & Forex trader need not to worry. I will fix it for the stock traders as well. Time is all I need.
as usual Good Luck for those who believe in it. Practice for those who believe in hard work. Think for those who believe in smart work. ;)
UCS_FridaysA simple script to show the Fridays (Weekly Option Expiry), of course this is a basic script we can make a few more improvement.
One of many ways to utilize the "dayofweek" variable.
Currently there are no options to draw a vertical line, you can do a background color for the candle.
Future plans - Include monthly option expiry.
