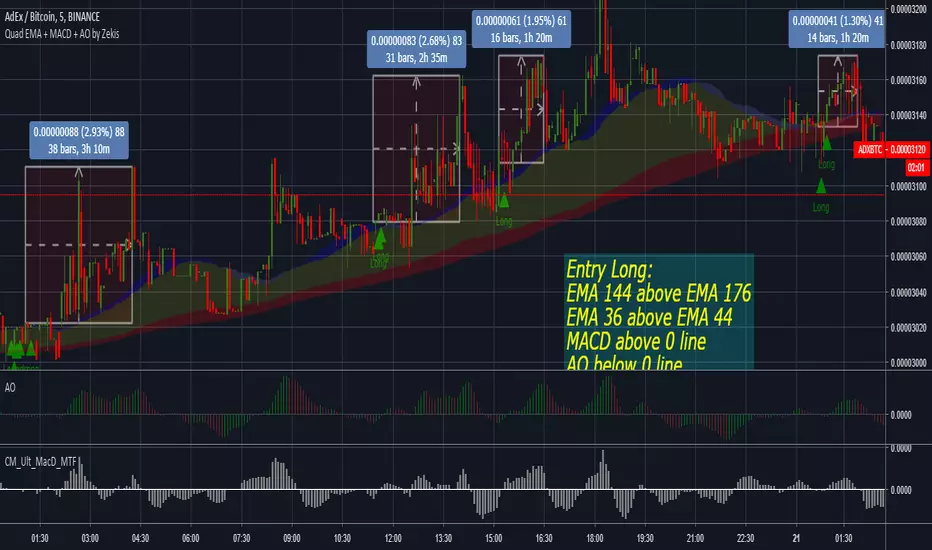
Quadruple EMA + MACD + Awesome Oscillator by ZekisThis strategy is based on quadruple EMAs, MACD and Awesome Oscillator, developed by Nenad Kerkez and simplified by me.
Scalping strategy (lower time frames)
Entry Position
Before we take a buy trade the two above criteria must be met. The 144 EMA must be above the 176 EMA and the 36 EMA must be above the 44 EMA. We then wait for AO to fall below the 0. The final „trigger‟ to the entry is when the MACD closes above the 0 line.
Sell trade is vice versa. 36 EMA must be below 44 EMA and 144 EMA must be below 176 EMA.
TAKE PROFIT and STOP LOSS
10-40 pips. Pivot Point targets.
STOP LOSS above/below last highest high
Enjoy!
@Zekis
Exponentialmovingaverages
All MAs & EMAs you needWhats up guys?
Who needs "pro" to have extra indicators when you can have an All-in-ONE indicator.
This particular indicator has several standard; most commonly used Moving averages while allowing you to customize you own Exponential Moving Averages.
With this indicator you can now have up too 8+ MA and EMAs on your screen. Now I don't recommend it; but hey... If its working, keep it up.
Anyways as always I hope you find value & and any and all feedback is appreciated.
happy pippin'
CP
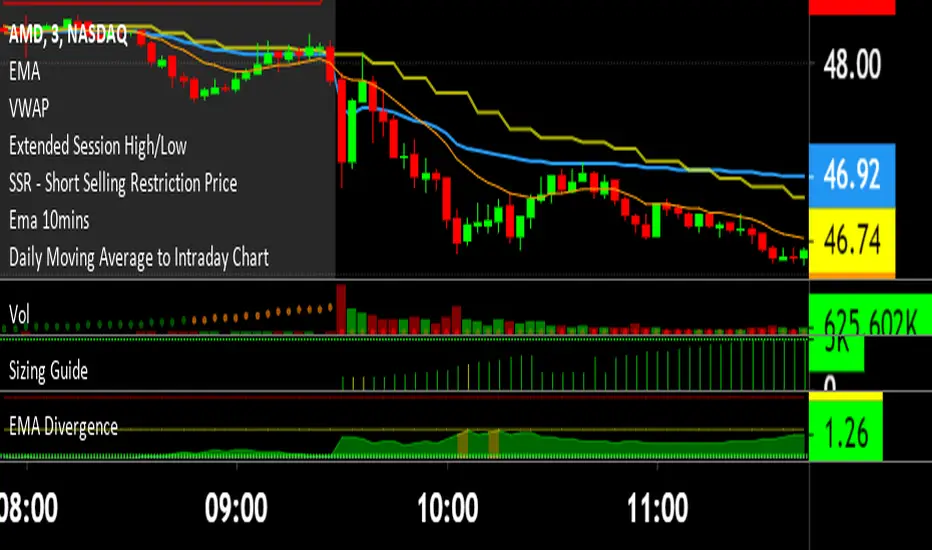
EMA DivergenceThis script automatically calculates the divergence between your favorite exponential moving average and the current price (13 ema default).
Additionally, it displays the area in yellow once the first threshold gets reached (1.5% divergence default) and in red once the second threshold gets reached (1.5% divergence default).
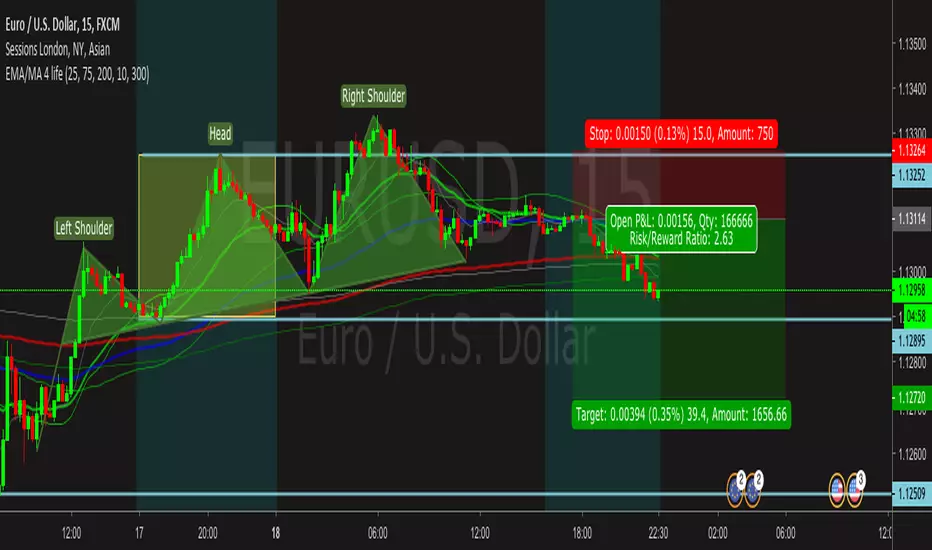
Multiple EMA/SMACreate and customize up to 6 EMAs and 6 SMAs. Useful for both long-term and short-term trading. Comes configured with the moving averages I use for trading.

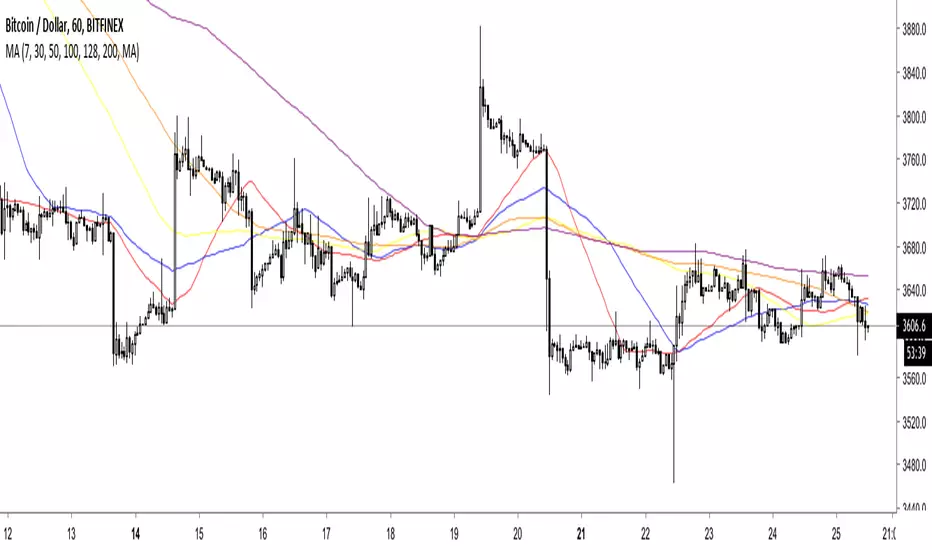
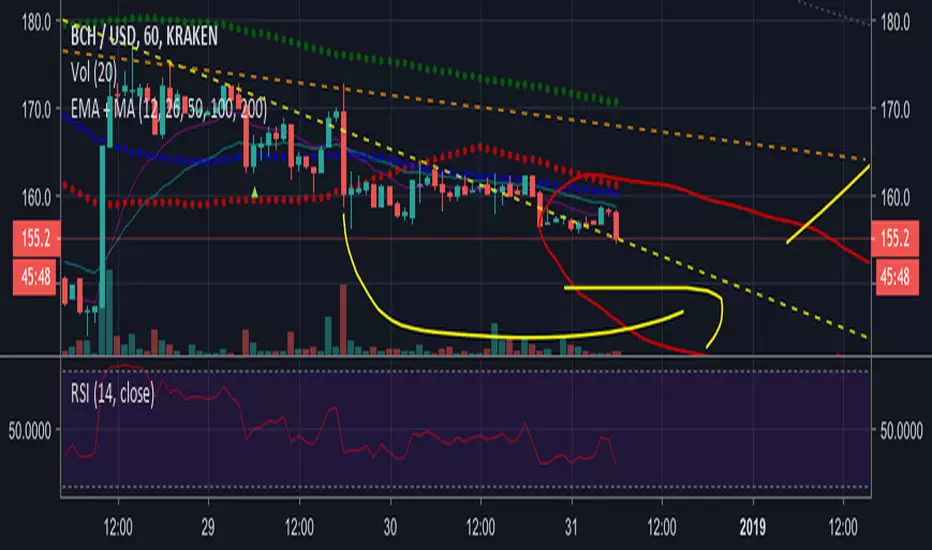
6MA: Moving Averages in One ScriptInstead of wasting 6 indicators this script lets you do custom 6 moving averages in one.
You are able to select MA EMA or WMA
Default values: 7, 30, 50, 100, 128, 200
6MA: Moving Averages in One ScriptInstead of wasting 6 indicators this script lets you do custom 6 moving averages in one.
You are able to select MA EMA or WMA
Default values: 7, 30, 50, 100, 128, 200

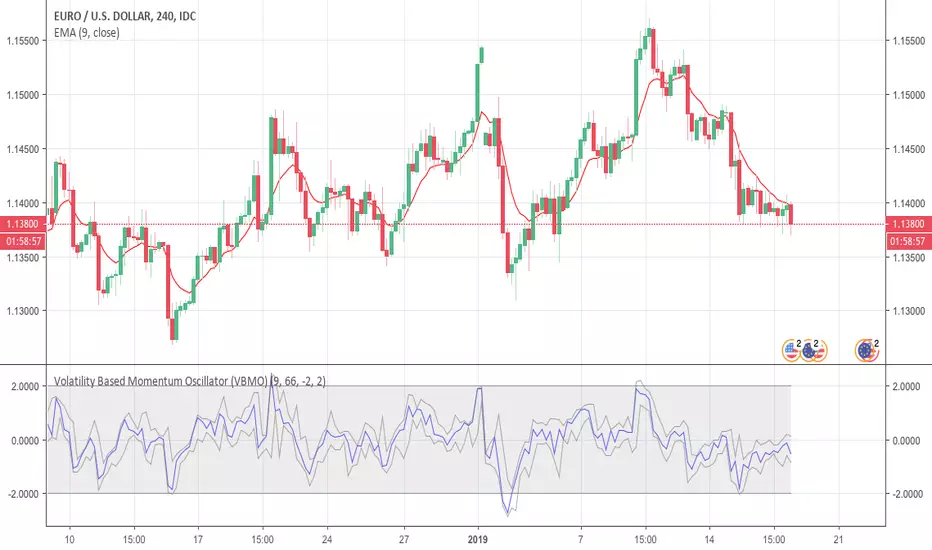
Volatility Based Momentum Oscillator (VBMO)There is a frequent and definitive pattern in price movement, whereby price will steadily drift lower, then accelerate before bottoming out. Similarly, price will often steadily rise, then accelerate into a climax top.
The Volatility Based Momentum Oscillator (VBMO) is designed to delineate between steady versus more accelerated and climactic price movements.
VBMO is calculated using a short-term moving average, the distance of price from this moving average, and the trading instrument’s historical volatility. Even though VBMO’s calculation is relatively simple, the resulting values can help traders identify, analyze and act upon many scenarios, such as climax tops, reversals, and capitulation. Moreover, since the units and scale for VBMO are always the same, the indicator can be used in a consistent manner across multiple timeframes and instruments.
For more details, there is an article further describing VBMO and its applicability.
Multiple Moving AveragesThis script plots up to five Moving Averages , either Simple or Exponential (9, 20, 50, 100 and 200 days period by default).

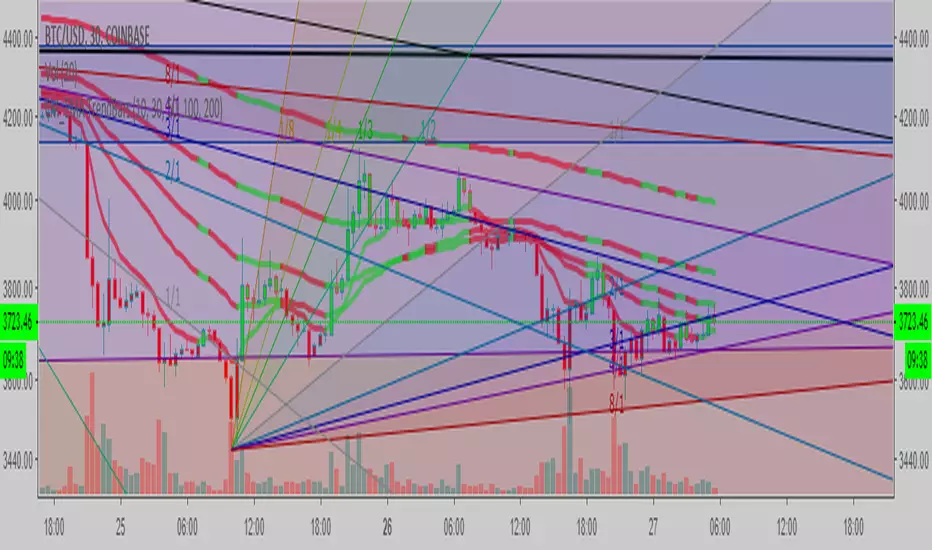
Fibonacci Trendlines 8-200In my opinion best EMA Trendlines there is, simple yet very reliable on any time frame, i found the version that had 8-13-21-55, so i decided to add 100 and 200 for higher time frames enjoy please share and like

SuperRadu's 3EMA MTF It's EMAx3 using 52,104 and 208 values using 4H lookback candle data to make them more smoothed,clean and easy to understand the trend.

Meister Shredder - Exponential Moving Averages x4 ForecastShows the 21, 50, 100, 200 Exponential Moving Average + 6 bar forecast

3 EMA/SMA + 2nd Time FrameYou have 3 EMA or SMA (you choose) having the current time Resolution. The next 3 EMA/SMA have an other Resolution (Default: Day)

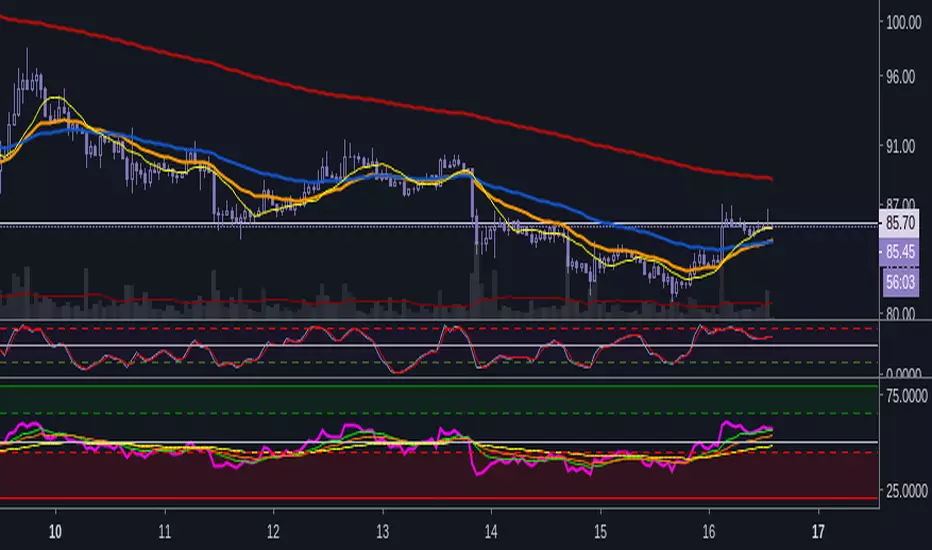
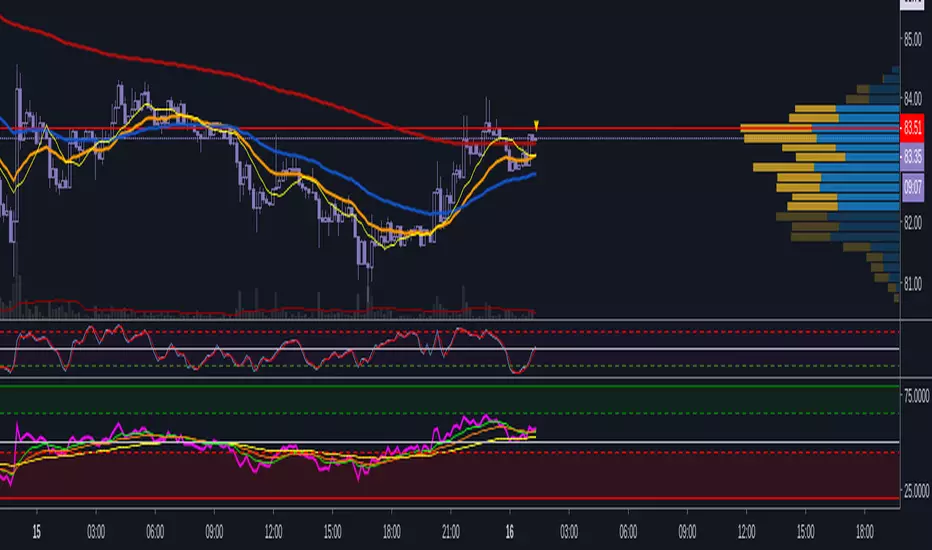
RSI_EMAx3_Stoch_SushiBased on the RSI + EMAx3 script, I further added the Stochastics to it, to create the all in one indicator for my current style of trading. It's more convenient to have just one indicator, imo, instead of two at the bottom.
Like I mentioned in the RSI_EMAx3 script, the EMAs can be used similar to the "Williams Alligator" and as Support & Resistance for the RSI, or any other way one can utilize them.

RSI_EMAx3_SushiThis indicator is mostly the same as other RSI+EMA indicators, the relevant difference is that it uses three EMAs instead of one.
The additional two EMAs can act as support/resistance and tell how strong a move is (eg. 'Williams Alligator'). It provides the same utility any MA does.
MA CrossA simple configurable MA Cross (3 MAs) script. You can choose between SMA and EMA , you will get arrows up or down when MAs cross each others. The arrows have different transparency and length parameters so you can easily identify them:
- small arrow and the most transparent for fast and medium MA crosses
- medium arrow for fast and slow MA crosses
- long arrow with no transparency for medium and slow MA crosses
Default values that can be changed:
- MA type = EMA
- Source for all MAs = close
- Fast MA length = 20
- Medium MA length = 50
- Slow MA length = 200
I plan on adding feartures overtime.

RSI & EMAx3_SushiThis indicator is mostly the same as other RSI+EMA indicators, the relevant difference is that it uses three EMAs instead of one.
The additional two EMAs can act as support/resistance and tell how strong a move is (eg. 'Williams Alligator'). It provides the same utility any MA does.
Quad Moving Avarage-Ichimoku Cloud-ALMA-Bollinger BandsAll-in-One
Ingradients:
* Ichimoku Cloud,
* 2 Simple Moving Avarage (SMA),
* 2 Exponential Moving Avarage (EMA),
* 2 Arnoud Legoux Moving Avarage (ALMA),
* Bollinger Bands and
* Volume Based Colored Bars (developed by KIVANÇ fr3762).
Compiled for limitations. Thank you.

5 Moving Averages ( 7,30,50,100,200 ) ( sma ema wma hullma )5 Moving Averages
Stock: works best on dark layout
7 Ma lime
30 Ma orange
50 Ma red
100 MA aqua
200 White
You can switch between
1 sma
2 ema
3 wma
4 hullma
5 vwma
6 rma
Change the coler and Ma value line with, ext

Intelligent Exponential Moving Average (AI)Introduction
This indicator uses machine learning (Artificial Intelligence) to solve a real human problem.
The Exponential Moving Average (EMA) is one of the most used indicators on the planet, yet no one really knows what pair of exponential moving average lengths works best in combination with each other.
A reason for this is because no two EMA lengths are always going to be the best on every instrument, time-frame, and at any given point in time.
The "Intelligent Exponential Moving Average" solves the moving average problem by adapting the period length to match the most profitable combination of exponential moving averages in real time.
How does the Intelligent Exponential Moving Average work?
The artificial intelligence that operates these moving average lengths was created by an algorithm that tests every single combination across the entire chart history of an instrument for maximum profitability in real-time.
No matter what happens, the combination of these exponential moving averages will be the most profitable.
Can we learn from the Intelligent Moving Average?
There are many lessons to be learned from the Intelligent EMA. Most will come with time as it is still a new concept. Adopting the usefulness of this AI will change how we perceive moving averages to work.
Limitations
Ultimately, there are no limiting factors within the range of combinations that has been programmed. The exponential moving averages will operate normally, but may change lengths in unexpected ways - maybe it knows something we don't?
Thresholds
The range of exponential moving average lengths is between 5 to 40.
Additional coverage resulted in TradingView server errors.
Future Updates!
Soon, I will be publishing tools to test the AI and visualise what moving average combination the AI is currently using.

Optimised Exponential Moving AverageAbout
This tool measures the profitability of every exponential moving average length combination for the entire history of the instrument that it is applied and only displays the most profitable combination in real-time meaning that this indicator is fully functional for trading.
The Optimised Exponential Moving Average can be tested using an Exponential Moving Average strategy and the Strategy Tester panel on any instrument or time-stamp. It will always display the lengths of the most profitable exponential moving average lengths at the current moment in time.
This can be used on its own, or paired with the Intelligent Exponential Moving Average (AI) for a better understanding of the indicators movements.
The Intelligent Exponential Moving Average (AI) uses this tool as a predictive method for machine learning.
