Ticker Pulse Meter + Fear EKG StrategyDescription
The Ticker Pulse Meter + Fear EKG Strategy is a technical analysis tool designed to identify potential entry and exit points for long positions based on price action relative to historical ranges. It combines two proprietary indicators: the Ticker Pulse Meter (TPM), which measures price positioning within short- and long-term ranges, and the Fear EKG, a VIX-inspired oscillator that detects extreme market conditions. The strategy is non-repainting, ensuring signals are generated only on confirmed bars to avoid false positives. Visual enhancements, such as optional moving averages and Bollinger Bands, provide additional context but are not core to the strategy's logic. This script is suitable for traders seeking a systematic approach to capturing momentum and mean-reversion opportunities.
How It Works
The strategy evaluates price action using two key metrics:
Ticker Pulse Meter (TPM): Measures the current price's position within short- and long-term price ranges to identify momentum or overextension.
Fear EKG: Detects extreme selling pressure (akin to "irrational selling") by analyzing price behavior relative to historical lows, inspired by volatility-based oscillators.
Entry signals are generated when specific conditions align, indicating potential buying opportunities. Exits are triggered based on predefined thresholds or partial position closures to manage risk. The strategy supports customizable lookback periods, thresholds, and exit percentages, allowing flexibility across different markets and timeframes. Visual cues, such as entry/exit dots and a position table, enhance usability, while optional overlays like moving averages and Bollinger Bands provide additional chart context.
Calculation Overview
Price Range Calculations:
Short-Term Range: Uses the lowest low (min_price_short) and highest high (max_price_short) over a user-defined short lookback period (lookback_short, default 50 bars).
Long-Term Range: Uses the lowest low (min_price_long) and highest high (max_price_long) over a user-defined long lookback period (lookback_long, default 200 bars).
Percentage Metrics:
pct_above_short: Percentage of the current close above the short-term range.
pct_above_long: Percentage of the current close above the long-term range.
Combined metrics (pct_above_long_above_short, pct_below_long_below_short) normalize price action for signal generation.
Signal Generation:
Long Entry (TPM): Triggered when pct_above_long_above_short crosses above a user-defined threshold (entryThresholdhigh, default 20) and pct_below_long_below_short is below a low threshold (entryThresholdlow, default 40).
Long Entry (Fear EKG): Triggered when pct_below_long_below_short crosses under an extreme threshold (orangeEntryThreshold, default 95), indicating potential oversold conditions.
Long Exit: Triggered when pct_above_long_above_short crosses under a profit-taking level (profitTake, default 95). Partial exits are supported via a user-defined percentage (exitAmt, default 50%).
Non-Repainting Logic: Signals are calculated using data from the previous bar ( ) and only plotted on confirmed bars (barstate.isconfirmed), ensuring reliability.
Visual Enhancements:
Optional moving averages (SMA, EMA, WMA, VWMA, or SMMA) and Bollinger Bands can be enabled for trend context.
A position table displays real-time metrics, including open positions, Fear EKG, and Ticker Pulse values.
Background highlights mark periods of high selling pressure.
Entry Rules
Long Entry:
TPM Signal: Occurs when the price shows strength relative to both short- and long-term ranges, as defined by pct_above_long_above_short crossing above entryThresholdhigh and pct_below_long_below_short below entryThresholdlow.
Fear EKG Signal: Triggered by extreme selling pressure, when pct_below_long_below_short crosses under orangeEntryThreshold. This signal is optional and can be toggled via enable_yellow_signals.
Entries are executed only on confirmed bars to prevent repainting.
Exit Rules
Long Exit: Triggered when pct_above_long_above_short crosses under profitTake.
Partial exits are supported, with the strategy closing a user-defined percentage of the position (exitAmt) up to four times per position (exit_count limit).
Exits can be disabled or adjusted via enable_short_signal and exitPercentage settings.
Inputs
Backtest Start Date: Defines the start of the backtesting period (default: Jan 1, 2017).
Lookback Periods: Short (lookback_short, default 50) and long (lookback_long, default 200) periods for range calculations.
Resolution: Timeframe for price data (default: Daily).
Entry/Exit Thresholds:
entryThresholdhigh (default 20): Threshold for TPM entry.
entryThresholdlow (default 40): Secondary condition for TPM entry.
orangeEntryThreshold (default 95): Threshold for Fear EKG entry.
profitTake (default 95): Exit threshold.
exitAmt (default 50%): Percentage of position to exit.
Visual Options: Toggle for moving averages and Bollinger Bands, with customizable types and lengths.
Notes
The strategy is designed to work across various timeframes and assets, with data sourced from user-selected resolutions (i_res).
Alerts are included for long entry and exit signals, facilitating integration with TradingView's alert system.
The script avoids repainting by using confirmed bar data and shifted calculations ( ).
Visual elements (e.g., SMA, Bollinger Bands) are inspired by standard Pine Script practices and are optional, not integral to the core logic.
Usage
Apply the script to a chart, adjust input settings to suit your trading style, and use the visual cues (entry/exit dots, position table) to monitor signals. Enable alerts for real-time notifications.
Designed to work best on Daily timeframe.
Fear

Candle Emotion Index (CEI) StrategyThe Candle Emotion Index (CEI) Strategy is an innovative sentiment-based trading approach designed to help traders identify and capitalize on market psychology. By analyzing candlestick patterns and combining them into a unified metric, the CEI Strategy provides clear entry and exit signals while dynamically managing risk. This strategy is ideal for traders looking to leverage market sentiment to identify high-probability trading opportunities.
How It Works
The CEI Strategy is built around three core oscillators that reflect key emotional states in the market:
Indecision Oscillator . Measures market uncertainty using patterns like Doji and Spinning Tops. High values indicate hesitation, signaling potential turning points.
Fear Oscillator . Tracks bearish sentiment through patterns like Shooting Star, Hanging Man, and Bearish Engulfing. Helps identify moments of intense selling pressure.
Greed Oscillator . Detects bullish sentiment using patterns like Marubozu, Hammer, Bullish Engulfing, and Three White Soldiers. Highlights periods of strong buying interest.
These oscillators are averaged into the Candle Emotion Index (CEI):
CEI = (Indecision + Fear + Greed) / 3
This single value quantifies overall market sentiment and drives the strategy’s trading decisions.
Key Features
Sentiment-Based Trading Signals . Long Entry: Triggered when the CEI crosses above a lower threshold (e.g., 0.1), indicating increasing bullish sentiment. Short Entry: Triggered when the CEI crosses above a higher threshold (e.g., 0.2), signaling rising bearish sentiment.
Volume Confirmation . Trades are validated only if volume exceeds a user-defined multiplier of the average volume over the lookback period. This ensures entries are backed by significant market activity.
Break-Even Recovery Mechanism . If a trade moves into a loss, the strategy attempts to recover to break-even instead of immediately exiting at a loss. This feature provides flexibility, allowing the market to recover while maintaining disciplined risk management.
Dynamic Risk Management . Maximum Holding Period: Trades are closed after a user-defined number of candles to avoid overexposure to prolonged uncertainty. Profit-Taking Conditions: Positions are exited when favorable price moves are confirmed by increased volume, locking in gains. Loss Threshold: Trades are exited early if the price moves unfavorably beyond a set percentage of the entry price, limiting potential losses.
Cooldown Period . After a trade is closed, a cooldown period prevents immediate re-entry, reducing overtrading and improving signal quality.
Why Use This Strategy?
The CEI Strategy combines advanced sentiment analysis with robust trade management, making it a powerful tool for traders seeking to understand market psychology and identify high-probability setups. Its unique features, such as the break-even recovery mechanism and volume confirmation, add an extra layer of discipline and reliability to trading decisions.
Best Practices
Combine with Other Indicators . Use trend-following tools (e.g., moving averages, ADX) and momentum oscillators (e.g., RSI, MACD) to confirm signals.
Align with Key Levels . Incorporate support and resistance levels for refined entries and exits.
Multi-Market Compatibility . Apply this strategy to forex, crypto, stocks, or any asset class with strong volume and price action.

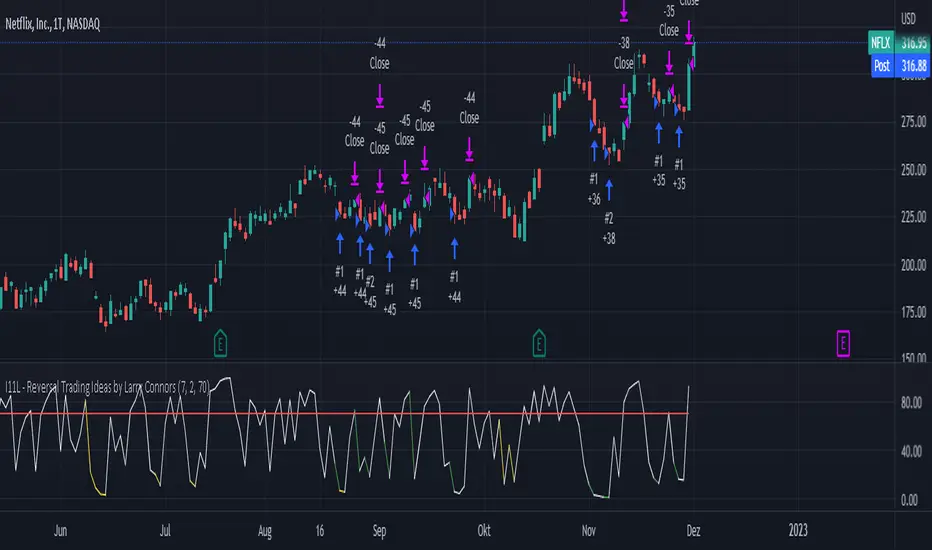
I11L - Reversal Trading Ideas by Larry ConnorsThis is my own Twist on Larry Connors Simple Tradingideas.
It Combines the RSI, Averaging In and the Lowest Bars in a Single System.
The current Configuration is designed for the Daily Timeframe.
Feel free to play with the Parameters and keep in mind that Larry Intended to buy fear and sell the greed!
The Rules are the following:
---Buy---
Buy, if the lowest Bar of your Configuration has been hit (default is set to 7).
---Average Down--
Buy, if the lowest Bar of your Configuration * Your open trades has been hit AND only if the buyin is atleast 1% cheaper.
---Close---
Close, if the RSI closes above a certain level (default is set to 70).
---TP---
There is no TP
---SL---
There is no SL, so be cautions of your tail Risk!
Bull and Bear Fear Expert by Walter Downs StrategyBull and Bear Fear Expert by Walter Downs Strategy
