RSI Value Table – match builtin🧭 Overview
“RSI Value Table – match builtin” displays the exact RSI value (identical to TradingView’s built-in RSI) for any selected timeframe — directly on your chart.
It’s designed for professional traders who need quick RSI confirmation without switching panels or opening multiple indicators.
⚙️ Core Logic
Reads RSI from any timeframe using request.security() with gaps_off and lookahead_off — ensuring a perfect match with the native RSI.
Optional EMA smoothing (non-standard) for visual stability.
Color-coded cell:
🟩 Green → RSI > 50 (bullish momentum)
🟥 Red → RSI < 50 (bearish momentum)
🟨 Yellow → Neutral zone around 50
Adjustable table position: top/bottom, left/right corners.
⚡ Alerts
Built-in alert conditions trigger automatically:
RSI > 50 → bullish momentum confirmation.
RSI < 50 → bearish momentum confirmation.
📈 How to Use
Select your preferred RSI timeframe (e.g., Daily, Weekly, 4H).
Watch the color-coded cell:
Green → trade long bias only.
Red → short bias only.
Ideal as a confirmation module for multi-timeframe systems or smart signal engines.
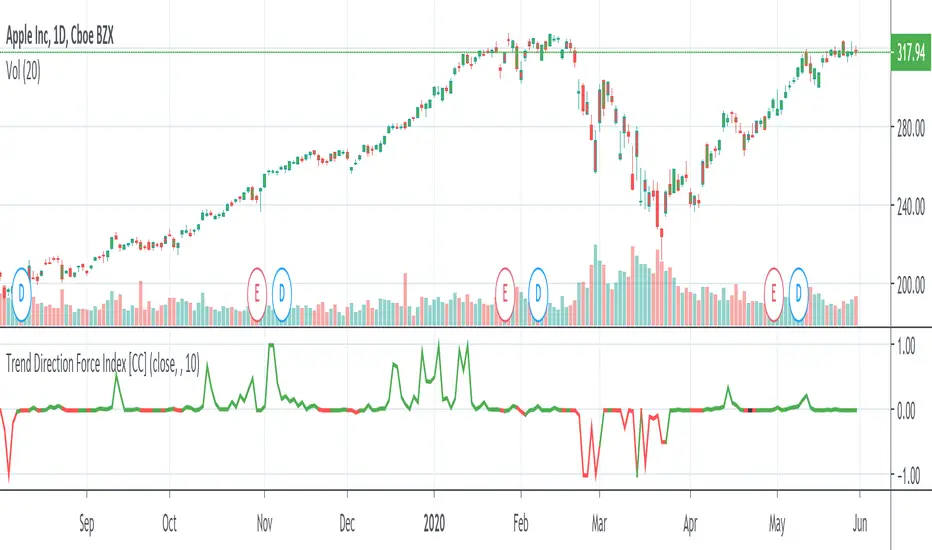
Forceindicator

Trend Direction Force IndexThis is my own version of the famous Trend Direction Force Index and I modified the original to make my version react quickly to any trend. I have color coded the indicator to make it extremely easy to read so if it is green then buy and red then sell.
This was a custom request so if you would like more then just send me a message!