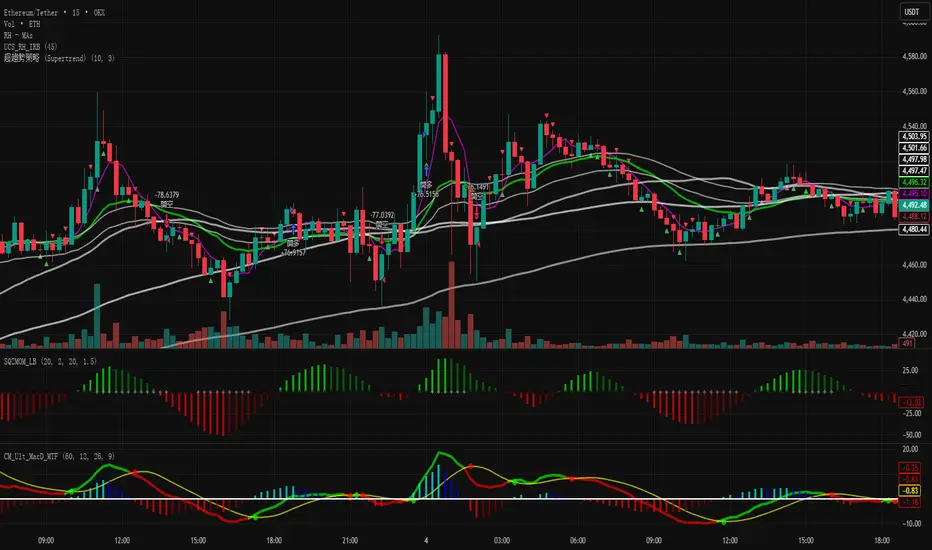
KRISHNAS GRACEBy far my most successful indicator, result of years of labor.
Works best on nifty 5 min TF.
Forecasting

Final Scalping Strategy - RELAXED ENTRY, jangan gopoh braderEMA Scalping System (MTF) Guide (1HR direction, 15 min entry)
Objective
To capture small, consistent profits by entering trades when 15-minute momentum aligns with the 1-hour trend.
Trades are executed only during high-liquidity London and New York sessions to increase the probability of execution and success.
Strategy Setup
Chart Timeframe (Execution): 15-Minute (M15).
Trend Filter (HTF): 1-Hour (H1) chart data is used for the long-term EMA.
Long-Term Trend Filter: 50-Period EMA (based on H1 data).
Short-Term Momentum Signal: 20-Period EMA (based on M15 data).
Risk
Metric: 14-period ATR for dynamic Stop Loss calculation.
✅ Trading Rules🟢
Long (Buy) Entry Conditions
Session: Must be within the London (0800-1700 GMT) or New York (1300-2200 GMT) sessions.
HTF Trend: Current price must be above the 1-Hour EMA 50.
Momentum Signal: Price crosses above the 15-Minute EMA 20.
Confirmation: The bar immediately following the crossover must close above the 15-Minute EMA 20.
Ent
ry: A market order is executed on the close of the confirmation candle.
🔴 Short (Sell) Entry Conditions
Session: Must be within the London (0800-1700 GMT) or New York (1300-2200 GMT) sessions.
HTF Trend: Current price must be below the 1-Hour EMA 50.
Momentum Signal: Price crosses below the 15-Minute EMA 20.
Confirmation: The bar immediately following the crossover must close below the 15-Minute EMA 20.
Entry: A market order is executed on the close of the confirmation candle.
🛑 Trade Management & Exits
Stop Loss (SL): Placed dynamically at 2.0 times the 14-period ATR distance from the entry candle's low (for Buys) or high (for Sells).
Take Profit (TP): Placed dynamically to achieve a 1.5 Risk-Reward Ratio (RR) (TP distance = 1.5 x SL d
istance).
📊 On-Chart Visuals
Detailed Labels: A box appears on the entry bar showing the action, SL/TP prices, Risk/Reward in Pips, and the exact R:R ratio.
Horizontal Lines: Dashed lines display the calculated SL (Red) and TP (Green) levels while the trade is active.
Background: The chart background is shaded to highlight the active London and New York tradi
ng sessions.

1-Min Binary Strategy (EMA + RSI + BB Optimized)creat signal for binary trading using ema rsi ans bolinger band combination

Roboquant RP Profits NY Open Retest StrategyRoboquant RP Profits NY Open Retest Strategy A good strategy for CL

Adaptive Cortex Strategy (ACS)Strategy Title: Adaptive Cortex Strategy (ACS)
This script is invite-only.
Part 1: Philosophy and the Fundamental Problem It Solves
Adaptive Cortex Strategy (ACS) is an advanced decision support system designed to dynamically adapt to the ever-changing characteristics of the market. A major weakness of traditional approaches is that while successful in a specific market condition (e.g., a strong trend), they become ineffective when the market changes course (e.g., enters a sideways range). ACS solves this problem by continuously analyzing the market's current "regime" and instantly adapting its decision-making logic accordingly.
Its primary goal is to enable the strategy itself to "think" and evolve with the market, without requiring the trader to change their strategy.
Part 2: Original Methodology and Proprietary Logic
A Note on the Original Methodology and Intellectual Property
This algorithm is not based on or copied from any open-source strategy code. The system utilizes the mathematical principles of widely accepted indicators such as ADX, RSI, and Ichimoku as data sources for its analyses.
However, the intellectual property and unique value of the algorithm lies in its unique and closed-source architecture that processes, prioritizes, and synthesizes data from these standard tools. The methods used in core components, particularly the adaptive 'Cortex' memory system and statistical 'Forecast' engine, represent a unique set of logic developed from scratch for this script. The parameters, order of operations, and conditional logic are entirely custom-designed. Therefore, the system's performance is a result of its unique design, not a repetition of publicly available code.
ACS's power lies not in the individual indicators it uses, but in the unique and proprietary logic layers that process the information from these indicators.
1. Multi-Factor Scoring and Adaptive Weighting:
The heart of the methodology is a scoring system that analyzes the market in four main categories: Trend, Support/Resistance, Momentum, and Volume. However, what makes ACS unique is that it dynamically changes the importance it assigns to these categories based on the market regime.
Unique Application: Using ADX, DMI, and ATR indicators, the system detects whether the market is in different regimes, such as "Strong Trend" or "High Volatility Squeeze." When it detects a strong trend, it automatically increases the weight of the Trend scores from the Ichimoku and proprietary AMF Trend Engine. When it detects sideways or tightness, it shifts its focus to Support/Resistance zones determined by Dynamic Channels and the author's "Cortex" Memory System. A different approach was added here, inspired by the classic Fibonacci estimation. This "adaptive weighting" ensures that the strategy always focuses its attention on the most appropriate area.
2. Statistical Forecast Engine:
ACS goes beyond standard indicators and includes a proprietary forecasting algorithm that measures the probability of a potential price movement's success.
Unique Implementation: The system stores the results of past tests (successful bounces/breakouts) at key price levels in a "brain" (memory). At the time of a new test, it compares the current RSI momentum, volume anomalies, and market regime with similar past situations. Based on this comparison, it calculates the probability of the current test being successful as a statistical percentage and adds this percentage to the final score as a "bonus" or "penalty."
3. Walk-Forward Architecture:
Markets constantly evolve. ACS continues to learn from the latest market dynamics by resetting its memory at regular intervals (e.g., monthly) through its "Re-Learn Mode," rather than being trapped by old data. This is an advanced approach aimed at ensuring the strategy remains current and effective over the long term.
Part 3: Practical Features and User Benefits
HOW DOES IT HELP INVESTORS?
Customizable Trading Profiles: ACS does not come with a single set of settings. Users can instantly adapt all the algorithm's key periods and decision thresholds to their trading style by selecting one of the pre-configured trading profiles, such as "SCALPING," "INTRADAY TREND," or "SWING TRADE." Additionally, they can further fine-tune the selected profile with "Speed Adjustment."
Full Automation Compatibility (JSON): The strategy is equipped with fully configurable JSON-formatted alert messages for buy, sell, and position closing transactions. This makes it possible to establish a fully automated trading system by connecting ACS signals to automation platforms such as 3Commas and PineConnector. Dynamic values such as position size ({{strategy.order.contracts}}) are automatically added to alerts.
Advanced and Adaptive Risk Management: Protecting capital is as important as making a profit. ACS offers a multi-layered risk management framework for this purpose:
Flexible Position Size: Allows you to set the risk for each trade as a percentage of capital or a fixed dollar amount.
Adaptive ATR Stop: The stop-loss level is dynamically expanded or contracted based on current market volatility (the ratio of short-term ATR to long-term ATR).
Contingency Mechanisms: Includes safety nets such as "Maximum Drawdown Protection" and the "Praetorian Guard" engine, which detects sudden market shocks.
Clear and Comprehensible Dashboard: Transforms dozens of complex data points into an intuitive dashboard that provides critical information such as market trends, major trends, support/resistance zones, and final signals at a glance.
Section 4: Disclaimers and Rules
Transparency Note: This algorithm uses the mathematical foundations of publicly available indicators such as ADX, ATR, RSI, and Ichimoku. However, ACS's intellectual property and unique value lies in its unique architecture, which combines data from these standard tools, prioritizes it by market trend, and synthesizes it with its proprietary "Cortex" and "Statistical Forecast" engines.
Educational Use:
IMPORTANT WARNING: The Adaptive Cortex Strategy is a professional decision support and analysis tool. It is NOT a system that promises "guaranteed profits." All trading activities involve the risk of capital loss. Past performance is no guarantee of future results. All signals and analysis generated by this script are for educational purposes only and should not be construed as investment advice. Users are solely responsible for applying their own risk management rules and making their final trading decisions.
Strategy Backtest Information
Please remember that past performance is not indicative of future results. The published chart and performance report were generated on the 4-hour timeframe of the BTC/USD pair with the following settings:
Test Period: January 1, 2016 - November 2, 2025
Default Position Size: 15% of Capital
Pyramiding: Closed
Commission: 0.0008
Slippage: 2 ticks (Please enter the slippage you used in your own tests)
Testing Approach: The published test includes 123 trades and is statistically significant. It is strongly recommended that you test on different assets and timeframes for your own analysis. The default settings are a template and should be adjusted by the user for their own analysis.

Buy&Hold Profitcalculator in EuroTitle: Buy & Hold Strategy in Euro
Description:
This Pine Script implements a simple yet flexible Buy & Hold strategy denominated in Euros, suitable for a wide range of assets including cryptocurrencies, forex pairs, and stocks.
Key Features:
Custom Investment Amount: Define your invested capital in Euros.
Flexible Start & End Dates: Specify exact entry and exit dates for the strategy.
Automatic Currency Conversion: Supports assets priced in USD or USDT, converting the invested capital to chart currency using the EUR/USD exchange rate.
Single Entry and Exit: Executes a one-time Buy & Hold position based on the defined timeframe.
Profit and Performance Tracking: Calculates total profit/loss in Euros and percentage returns.
Smart Exit Label: Displays a dynamic label at the exit showing final position value, net profit/loss, and return percentage. The label automatically adjusts its position above or below the price bar for optimal visibility.
Visual Enhancements:
Position value and profit/loss plotted on the chart.
Background color highlights the active investment period.
Buy and Sell markers clearly indicate entry and exit points.
This strategy is ideal for traders and investors looking to simulate long-term positions and evaluate performance in Euro terms, even when trading USD-denominated assets.
Usage Notes:
Best used on daily charts for medium- to long-term analysis.
Adjust start and end dates, as well as invested capital, to simulate different scenarios.
Works with any asset, but currency conversion is optimized for USD or USDT-pegged instruments.

US/SPY- Financial Regime Index Swing Strategy Credits: concept inspired by EdgeTools Bloomberg Financial Conditions Index (Proxy)
Improvements: eight component basket, inverse volatility weights, winsorization option( statistical technique used to limit the influence of outliers in a dataset by replacing extreme values with less extreme ones, rather than removing them entirely), slope and price gates, exit guards, table and gradients.
Summary in one paragraph
A macro regime swing strategy for index ETFs, futures, FX majors, and large cap equities on daily calculation with optional lower time execution. It acts only when a composite Financial Conditions proxy plus slope and an optional price filter align. Originality comes from an eight component macro basket with inverse volatility weights and winsorized return z scores that produce a portable yardstick.
Scope and intent
Markets: SPY and peers, ES futures, ACWI, liquid FX majors, BTC, large cap equities.
Timeframes: calculation daily by default, trade on any chart.
Default demo: SPY on Daily.
Purpose: convert broad financial conditions into clear swing bias and exits.
Originality and usefulness
Unique fusion: return z scores for eight liquid proxies with inverse volatility weighting and optional winsorization, then slope and price gates.
Failure mode addressed: false starts in chop and early shorts during easy liquidity.
Testability: all knobs are inputs and the table shows components and weights.
Portable yardstick: z scores center at zero so thresholds transfer across symbols.
Method overview in plain language
Base measures
Return basis: natural log return over a configurable window, standardized to a z score. Winsorization optional to cap extremes.
Components
EQ US and EQ GLB measure equity tone.
CREDIT uses LQD over HYG. Higher credit quality outperformance is risk off so sign is flipped after z score.
RATES2Y uses two year yield, sign flipped.
SLOPE uses ten minus two year yield spread.
USD uses DXY, sign flipped.
VOL uses VIX, sign flipped.
LIQ uses BIL over SPY, sign flipped.
Each component is smoothed by the composite EMA.
Fusion rule
Weighted sum where weights are equal or inverse volatility with exponent gamma, normalized to percent so they sum to one.
Signal rule
Long when composite crosses up the long threshold and its slope is positive and price is above the SMA filter, or when composite is above the configured always long floor.
Short when composite crosses down the short threshold and its slope is negative and price is below the SMA filter.
Long exit on cross down of the long exit line or on a fresh short signal.
Short exit on cross up of the short exit line or on a fresh long signal, or when composite falls below the force short exit guard.
What you will see on the chart
Markers on suggestion bars: L for long, S for short, LX and SX for exits.
Reference lines at zero and soft regime bands at plus one and minus one.
Optional background gradient by regime intensity.
Compact table with component z, weight percent, and composite readout.
Table fields and quick reading guide
Component: EQ US, EQ GLB, CREDIT, RATES2Y, SLOPE, USD, VOL, LIQ.
Z: current standardized value, green for positive risk tone where applicable.
Weight: contribution percent after normalization.
Composite: current index value.
Reading tip: a broadly green Z column with slope positive often precedes better long context.
Inputs with guidance
Setup
Calc timeframe: default Daily. Leave blank to inherit chart.
Lookback: 50 to 1500. Larger length stabilizes regimes and delays turns.
EMA smoothing: 1 to 200. Higher smooths noise and delays signals.
Normalization
Winsorize z at ±3: caps extremes to reduce one off shocks.
Return window for equities: 5 to 260. Shorter reacts faster.
Weighting
Weight lookback: 20 to 520.
Weight mode: Equal or InvVol.
InvVol exponent gamma: 0.1 to 3. Higher compresses noisy components more.
Signals
Trade side: Long Short or Both.
Entry threshold long and short: portable z thresholds.
Exit line long and short: soft exits that give back less.
Slope lookback bars: 1 to 20.
Always long floor bfci ≥ X: macro easy mode keep long.
Force short exit when bfci < Y: macro stress guard.
Confirm
Use price trend filter and Price SMA length.
View
Glow line and Show component table.
Symbols
SPY ACWI HYG LQD VIX DXY US02Y US10Y BIL are defaults and can be changed.
Realism and responsible publication
No performance claims. Past is not future.
Shapes can move intrabar and settle on close.
Execution is on standard candles only.
Honest limitations and failure modes
Major economic releases and illiquid sessions can break assumptions.
Very quiet regimes reduce contrast. Use longer windows or higher thresholds.
Component proxies are ETFs and indexes and cannot match a proprietary FCI exactly.
Strategy notice
Orders are simulated on standard candles. All security calls use lookahead off. Nonstandard chart types are not supported for strategies.
Entries and exits
Long rule: bfci cross above long threshold with positive slope and optional price filter OR bfci above the always long floor.
Short rule: bfci cross below short threshold with negative slope and optional price filter.
Exit rules: long exit on bfci cross below long exit or on a short signal. Short exit on bfci cross above short exit or on a long signal or on force close guard.
Position sizing
Percent of equity by default. Keep target risk per trade low. One percent is a sensible starting point. For this example we used 3% of the total capital
Commisions
We used a 0.05% comission and 5 tick slippage
Legal
Education and research only. Not investment advice. Test in simulation first. Use realistic costs.


Algoritmictrader2025 ALGO System profitability works with a minimum profit margin of 75% and the maximum profit margin per share is around 95%. The software costs $150 per month.

U.T.M.S v2🇷🇺 ОПИСАНИЕ (РУССКИЙ)
U.T.M.S v2 — Чистый EMA-кроссовер с фильтрами
Стратегия для 15м (в первую очередь) и 1ч таймфреймов.
Генерирует сигналы при пересечении EMA(8) и EMA(19) только при подтверждении тренда, объёма, волатильности и времени суток.
Каждая сделка закрывается по фиксированному Take Profit и Stop Loss.
✅ Минимум ложных входов
✅ Работает только в ликвидные часы
✅ Полная фильтрация шума и флэта
🔧 Настройки:
Fast EMA / Slow EMA — периоды скользящих (по умолчанию 8 / 19)
Take Profit % — уровень фиксации прибыли (рек. 2.5%)
Stop Loss % — уровень стоп-лосса (рек. 2.0%)
Фильтры (все включены по умолчанию):
Use 1H Trend Filter — вход разрешён только по направлению тренда на 1H (EMA50 > EMA200 для лонга)
Use Volume Filter — объём должен быть ≥ 1.5× среднего за 20 баров
Min Volume Multiplier — нижний порог объёма (рек. 1.5)
Max Volume Multiplier — верхний порог (рек. 3.0–4.0), отсекает аномальные пампы
Use ATR Volatility Filter — минимальная волатильность (рек. 0.3%)
Use Time Filter (UTC) — торговля только в часы высокой ликвидности: 12:00–18:00 и 20:00–02:00 UTC
💡 Идеальна для ручной торговли или подключения сигнальных ботов.
🇬🇧 DESCRIPTION (ENGLISH)
U.T.M.S v2 — Clean EMA Crossover with Filters
Strategy for 15m (primarily) and 1h timeframes.
Generates signals when the EMA(8) and EMA(19) cross, only if trend, volume, volatility, and time of day are confirmed.
Each trade is closed with a fixed Take Profit and Stop Loss.
✅ Low noise, high-quality signals
✅ Active only during high-liquidity hours
✅ Fully protected against flat and fakeouts
🔧 Inputs:
Fast EMA / Slow EMA — moving average periods (default: 8 / 19)
Take Profit % — profit target (suggested: 2.5%)
Stop Loss % — stop loss level (suggested: 2.0%)
Filters (all enabled by default):
Use 1H Trend Filter — trades only in 1H trend direction (EMA50 > EMA200 for long)
Use Volume Filter — volume must be ≥ 1.5× 20-bar average
Min Volume Multiplier — minimum volume threshold (suggested: 1.5)
Max Volume Multiplier — maximum volume cap (suggested: 3.0–4.0), filters out pumps/dumps
Use ATR Volatility Filter — minimum volatility (suggested: 0.3%)
Use Time Filter (UTC) — active only during high-liquidity sessions: 12:00–18:00 & 20:00–02:00 UTC
💡 Perfect for manual trading or webhook-based signal bots.

CE+ZLSMA RovTrading StrateryThe strategy is optimized for scalping in small timeframes like M15 and M30, as well as M5.
It combines two indicators: CE and ZLSMA.
Try it now!

AO3 BETA 3.9.0 (v9p)// 📦 VERSION UPGRADE NOTE
// Indicator:
// Version: BETA 3.9.0 (v9p)
// Previous: BETA 3.4.2 (v6)
//────────────────────────────────────────────
// 🔸 Upgrade Summary:
// • Upgraded to Pine Script v6 (backward compatible).
// • Improved trend filter logic:
// – H1/H4 Uptrend = AO > U1
// – AO ≤ U1 ⇒ not uptrend
// – **NEW:** When AO crosses back above U1 (while AO > 0) ⇒ uptrend resumes.
// – Vice versa for downtrend.
// • Removed Entry Option 1; Option 2 → new Option 1; Option 3 → new Option 2.
// • Optimized internal constants & default values.
// • Added hidden system parameters (RISK_CAP, MIN_BARS, MAX_SPREAD, etc.).
// • Exposed only key inputs (Length, UseFilter, ATR Length) for cleaner UI.
// • Organized inputs into groups with tooltips for usability.
// • Improved performance via var-caching and reduced redundant calculations.
// • Simplified dev structure for modular updates.
//────────────────────────────────────────────
// 🧩 Notes:
// This build focuses on end-user stability and simplified interface.
// Developer-only parameters are now locked (not user-editable).

Moving Average Trend Strategy V2.1 — With Stop Loss and Add Posi**Strategy Feature Description:**
---
### **Entry Logic:**
* When **MA7** crosses **MA15**, and the distance between **MA15** and **MA99** is less than **0.5%**
* When **MA15** crosses **MA99**, and the distance between **MA7** and **MA15** is less than **0.5%**
* When the distance among all three MAs (**MA7**, **MA15**, **MA99**) is less than **0.5%** (adjustable via parameters)
---
### **Capital Management:**
* Initial capital: **$100**
* Each position uses **15%** of total capital
* Opens **both long and short positions simultaneously** (dual-direction mode)
---
### **Risk Control:**
* **Long position stop-loss:** Entry price − 2%
* **Short position stop-loss:** Entry price + 2%
* Uses a **five-level take-profit grid**:
* Every 5% profit → close 20% of position
* Any pending take-profit orders are automatically canceled when stop-loss triggers
---
### **Visualization Features:**
* Real-time display of the three moving averages
* Chart annotations for entry signal points
* All trade signals and performance can be viewed through **TradingView backtest reports**
---
### **Notes:**
* Parameters can be adjusted based on the volatility of the instrument (historical backtesting is recommended first)
* Dual-direction positions may generate **hedging costs** — recommended for low-fee markets
* Real trading must consider **exchange minimum order size limits**
* Suggest enabling a **volume filter mechanism** (extension interface already reserved)
* Always perform **historical backtesting and parameter optimization** in TradingView before connecting to live trading systems

Sniper Algo TradingThis indicator analyzes market momentum and trend shifts using advanced multi-timeframe algorithms. It helps visualize potential reversals, continuations, and momentum flips with clear, intuitive signals designed for experienced traders.
Built for precision and adaptability — suitable for crypto, forex, and indices.
Note: For educational use only. Not financial advice.

Moon Phases Long/Short StrategyThis is an experiment of Moon Phases, likely buy when full moon and sell when new moon with few changes, like it would buy a day ahead or sometimes sell a day post these events, with Stop loss and take profits, 50% profitable so sounds good to me
Long only good for bitcoin gold, both modes(L+S) better for stocks and alt coins

超趨勢策略 (中文)-Caelusif ta.change(direction) < 0
strategy.entry("My Long Entry Id", strategy.long)
if ta.change(direction) > 0
strategy.entry("My Short Entry Id", strategy.short)
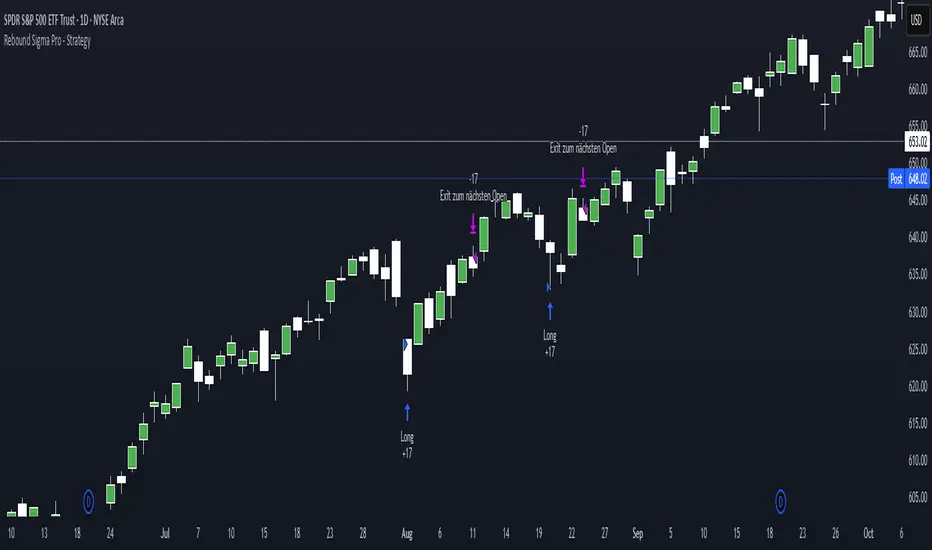
Rebound Sigma Pro - StrategyOverview
Rebound Sigma Pro is a mean-reversion indicator that detects statistically oversold conditions in trending markets.
It helps traders identify potential short-term rebounds based on momentum exhaustion and volatility-adjusted entry zones.
Concept
The indicator combines two quantitative components:
Short-term momentum to detect short-term exhaustion
Trend filter to ensure setups align with the long-term direction
When a stock in an uptrend becomes temporarily oversold, a limit-entry signal is plotted.
The trade is then tracked until short-term conditions normalize or a time-based exit occurs.
Visual Signals
Green Triangle: Suggests placing a limit order for the next session
Green Circle: Confirms entry was filled
Red Triangle: Signals an exit for the next session’s open
Orange Background: Pending order
Green Background: Position active
Red Background: Exit phase
Yellow Line: Entry reference price
User Inputs
Limit Entry (% below previous close) – Default 1 %
Use Limit Entry – Switch between limit or market entries
Enable Time Exit – Optional holding-period constraint
Maximum Holding Days
All other internal parameters (momentum length, filters) are pre-configured.
Alerts
Limit Order Signal: New setup detected
Entry Confirmed: Order filled
Exit Signal: Exit expected next day
Usage
Designed for liquid equities and ETFs
Works best in confirmed uptrends
Backtesting encouraged to adapt parameters per symbol and timeframe
Notes
Not an automated strategy; manual order execution required
Past behavior does not imply future performance
Always apply sound position sizing and risk management
Disclaimer
This indicator is provided for educational and analytical purposes only.
It does not constitute financial advice or performance assurance.
30分钟事件合约策略(Q群956383880)This strategy is applicable to the Binance ETHUSDT spot 1-minute candlestick chart, and the order size can be adjusted based on the security level. Theoretically, the higher the security level, the smaller the order size and the higher the win rate.
本策略适用于币安ETHUSDT现货1分钟k线图,可以通过安全等级自行调节单量。理论上,安全等级越高,单量越少,胜率越高。

my_strategy_2.0Overview:
This is a high-speed scalping strategy optimized for volatile crypto assets (BTC, ETH, etc.) on timeframes 1m–5m. It combines trend-following SuperTrend with confirmations from MACD, RSI, Bollinger Bands, and volume spikes for precise entries. Focus on quick profits (1–3 ATR) with strict risk control: partial take-profits, stop-loss, and trailing breakeven after the first TP.
Key Signals:
Long: SuperTrend flip up + MACD crossover up + RSI >50 + BB Upper breakout + volume spike + volatility filter (ATR >0.5%).
Short: Similar but downward.
Exits and Risks:
TP: 33% at +1 ATR, 33% at +2 ATR, 34% at +3 ATR (customizable).
SL: Initial at -1 ATR, after TP1 — to breakeven with trailing on BB midline (optional).
Filters: Minimum ATR to avoid flat markets; realistic commissions in backtests.
Recommendations:
Test on 2020–2025 data (out-of-sample 2024+). Expected Win Rate ~55%, Profit Factor >1.8, Drawdown <10%. Ideal for 1–2% risk per trade. Not for beginners — use paper trading.
Disclaimer: Past results do not guarantee future performance. Trade at your own risk.
(Pine v6 code, ready for publication. Author: gopog777 with expert fixes.)

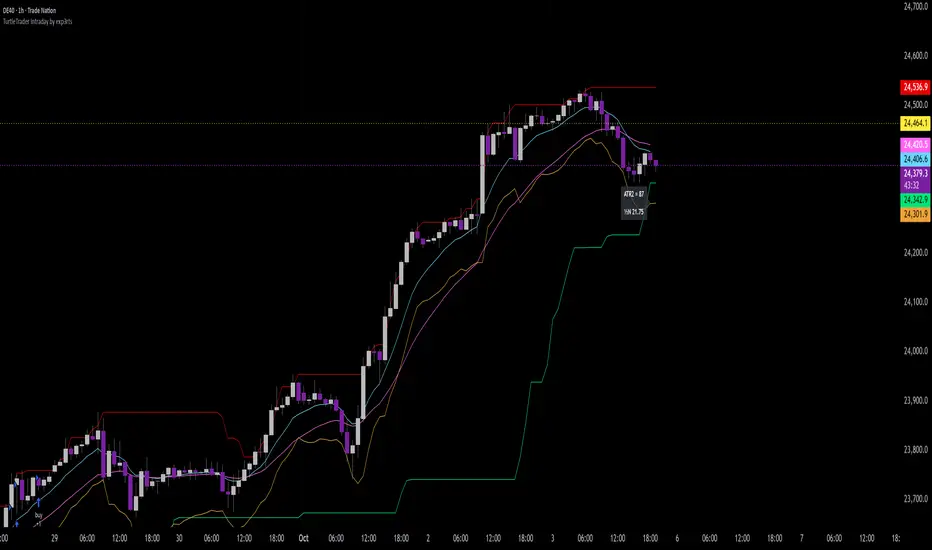
TurtleTrader Intraday Extended by exp3rts🐢 TurtleTrader Intraday Extended by exp3rts
A modern intraday adaptation of the classic Turtle Trading strategy, optimized for short-term breakout trading with built-in risk management, pyramiding, and optional trend filters.
This strategy captures strong directional moves by entering breakouts from price channels, using ATR-based stop losses and controlled position scaling.
🔑 Key Features:
📈 Channel Breakout Entries: Buy/sell on breakout of highest highs or lowest lows
🛑 Dynamic ATR Stop Loss: Automatically calculated from market volatility
🔁 Pyramiding: Adds up to 4 positions as price moves in your favor
🔄 Directional Mode: Choose Long-only or Short-only mode
🧠 Skip After Win Option: Avoid overtrading by skipping the next entry after a profitable trade
📊 Optional EMA Display: Plot up to 3 EMAs for trend filtering or visual confirmation
📉 On-Chart ATR Label: Displays real-time ATR metrics (including ½N size used in classic Turtle rules)
⚙️ Strategy Inputs:
Entry/Exit channel length
ATR multiplier and period
Entry delay (bar offset)
Optional trade filter after profitable trades
Show/hide EMAs and ATR label
🧪 Best For:
Intraday breakout traders (works well on 5m–1h timeframes)
Traders who prefer mechanical rules and structured risk
Anyone testing volatility-based entries and exits
Inspired by the original Turtle Trading system — redesigned for modern markets with more intraday flexibility and visual enhancements.
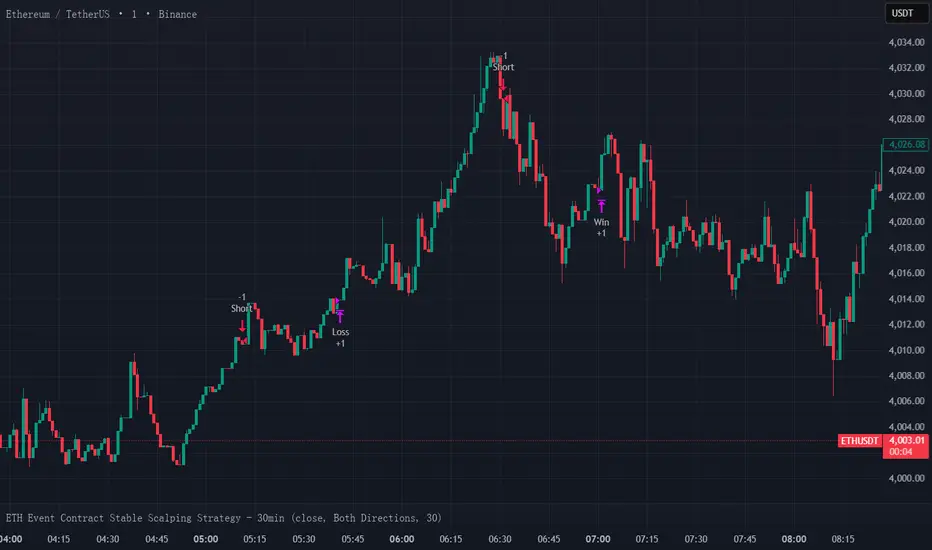
ETH Event Contract Stable Scalping Strategy - 30minKeep using it and you The winning rate of ETH event contract trading is stable at around 60%.ETH事件合约交易,胜率稳定在60%左右。
G. Santostasi Bitcoin Power Law StrategyG. Santostasi Bitcoin Power Law Strategy
Overview
The "G. Santostasi Bitcoin Power Law Strategy" is a TradingView strategy script built upon the foundational Bitcoin Power Law Theory by physicist Giovanni Santostasi.
Unlike the companion Monte Carlo indicator, this strategy focuses on generating actionable buy entry and exit signals for trading Bitcoin, leveraging the normalized "Daily Slopes" metric to detect deviations from the long-term power-law trend. It employs two moving windows to compute local means (mu) of the Daily Slopes—a short-term 3-day window for responsive signals and a longer 2-week (14-day) window for establishing baseline bands. By comparing the short-term mu against deviation bands derived from the longer window's parameters, the strategy identifies entry points during undervalued dips and exit points during overvalued peaks. This approach capitalizes on Bitcoin's scale-invariant behavior, where price follows a power law
P(t)= c t^n, with n~5.9.
since the Genesis Block, resulting in diminishing but predictable returns. Backtested over Bitcoin's full history, the strategy boasts a 77% winning rate and a profit factor of 3.2, making it a robust tool for trend-following with mean-reversion elements. It emphasizes Bitcoin's long-term stability while navigating short-term oscillations, treating cycles as temporary deviations from the core power-law "DNA.
"Core Concept: Daily Slopes
The strategy inherits the Daily Slopes metric from the power-law framework, which normalizes daily logarithmic returns to reveal a stable local slope that oscillates around the global value of ~5.9.Definition and Calculation:
Daily log returns: log(P2/P1)\, where P2 and P1 are consecutive closing prices.
Normalization: Divide by log((t+1)/t), where ( t ) is days since the Genesis Block, yielding:
Daily Slope=log(P2/P1)log((t+1)/t).
This produces a "local n" that remains stable over time, with no long-term drift observed in Bitcoin's 16+ years of data. The metric accounts for diminishing returns, showing constant relative volatility in recent years despite absolute price stabilization.
Distribution and Parameters:
Daily Slopes are fitted to a t-location scale distribution over moving windows, estimating:μ (mu): The location/mean, stable around 5.9 globally.
σ (sigma): Scale/volatility measure.
ν (nu): Degrees of freedom for tail heaviness.
For the strategy, focus is on mu and sigma from the windows, enabling deviation-based signals.
Strategy Logic: Dual Moving Window Mus and Deviation Bands
The strategy computes two mus via rolling fits to the t-distribution:
Short Window mu (3 days): A fast-moving average of Daily Slopes, sensitive to immediate price action for timely signals.
Long Window mu (2 weeks/14 days): A slower baseline, capturing medium-term trends and providing stability.
Deviation bands are derived from the long window's mu and sigma:
Upper Band: Long mu + Long sigma
Lower Band: Long mu - Long sigma
These bands represent 1-standard-deviation ranges around the longer-term mean, highlighting overbought and oversold conditions relative to the power-law trend. The short mu acts as a "signal line," crossing the bands to trigger trades.
Plotting:
Short mu: Responsive line for crossovers.
Long mu: Central baseline.
Bands: Upper (+σ) and lower (-σ) lines from the long window.
Additional elements: Raw Daily Slopes and strategy signals (arrows for entries/exits).
Entry and Exit Rules:
The strategy generates long-only signals (buy/sell) based on crossovers, assuming a single-position approach without leverage or shorting:
Buy Entry: Triggered when the short-window mu crosses above the lower band (long mu - long sigma). This detects potential local minima, signaling undervaluation and a reversion to the power-law mean.
Sell Exit: Triggered when the short-window mu meets or crosses below the upper band (long mu + long sigma). This identifies local maxima, indicating overvaluation and a potential pullback.
Trade Management:
No stop-loss or take-profit hardcoded; users can add via TradingView settings.
Positions close on exit signals, with re-entry on the next valid buy.
Filters for false signals: Optional confirmation from global slope (e.g., only trade if long mu > 5.0) to align with bullish regimes.
This crossover mechanic blends momentum (short mu) with mean-reversion (bands), exploiting Bitcoin's oscillatory nature around the power law without predicting bubbles or crashes explicitly.
Performance Metrics:
Backtested on BTCUSD daily data from the Genesis Block to present (assuming continuous updates):Winning Rate: 77% – A high hit rate due to the strategy's focus on statistically stable deviations.
Profit Factor: 3.2 – Gross profits are 3.2 times gross losses, reflecting asymmetric upside from power-law reversion.
Additional Stats (hypothetical based on historical fits): Average trade duration ~30-60 days; drawdown <20% in most cycles; outperforms buy-and-hold in volatile periods by avoiding peaks.
Caveats: Past performance is not indicative of future results. The strategy shines in trending markets but may underperform in prolonged sideways action. Transaction costs (e.g., fees, slippage) not included in base metrics.
Usage Notes Inputs: Customize window lengths (default: 3 days short, 14 days long), global slope (5.9), and signal thresholds. Enable alerts for entries/exits.
Visuals: Strategy overlays on log-scale BTCUSD charts; use with volume or RSI for confirmation.
Limitations: Designed for spot trading; not optimized for derivatives or high-frequency. Assumes power-law persistence—major regime shifts (e.g., adoption plateaus) could impact efficacy.
Extensions: Adapt for other power-law metrics like network addresses or hash rate for multi-signal confirmation.
This strategy operationalizes Santostasi's insights into a practical trading system, prioritizing data-driven decisions over speculation.
