Level LinesThis indicator displays levels in close proximity to the current price, enabling users to identify psychological levels on charts that serve as support/resistance zones or key reference points for price action.
In the settings, you can customize the number of lines shown above and below the current price, along with the interval size for rendering them.
As the price moves higher or lower, the lines dynamically adjust to reflect the most relevant levels.
In settings you can fully customize the style of lines (color, width, style) with separate settings available for lines above & below the current price.
Forecasting

Clock&Flow – Market Pulse IndicatorClock&Flow – Market Pulse Indicator
1) General Purpose
The Market Pulse Indicator is designed to visualize the strength and direction of market flow in a clear, intuitive way.
Unlike common volume or momentum indicators, it blends three essential dimensions — price velocity, normalized volume, and volatility (ATR) — to highlight when market pressure is truly meaningful.
It helps identify genuine liquidity inflows/outflows, potential exhaustion zones, and moments of compression or expansion within the price structure.
2) Data Sources
All data is directly taken from the current chart’s feed on TradingView:
Price (close): to measure relative price change.
Volume: to detect the intensity of market participation (normalized to average).
ATR (Average True Range): to evaluate volatility relative to price levels.
No external data or off-platform sources are used.
3) Logic and Calculation Steps
Price Velocity: calculates the percentage change between the current close and the close N bars ago.
priceChange = (close - close ) / close
Normalized Volume: compares current volume to its moving average over the same period.
volNorm = volume / sma(volume, length)
Normalized Volatility: ATR divided by price to adjust for instrument scale.
atrNorm = atr(length) / close
Combination : multiplies the three components into one raw value that represents market pulse intensity.
rawPulse = priceChange * volNorm * (1 + atrNorm)
Smoothing: a moving average (smoothLen) is applied to create a cleaner and more readable oscillator line.
flowPulse = sma(rawPulse * multiplier, smoothLen)
4) Parameters (Default Settings)
length (20): analysis period for price change, volume, and ATR.
smoothLen (5): smoothing factor; higher values reduce noise.
multiplier (100): scales the output for readability; adjust to fit chart scale.
5) How to Read the Indicator
Market Pulse > 0 (green): net inflow of liquidity; buying pressure dominates.
Market Pulse < 0 (red): net outflow of liquidity; selling pressure dominates.
Near 0: neutral phase; market balance or consolidation.
Sudden peaks: strong bursts of flow — often coincide with news releases or session overlaps.
Confirmations: use as a second-level filter before entering trades or to confirm momentum behind a breakout.
6) Divergences
Divergences between price and Market Pulse are key signals of weakening flow strength:
Bullish divergence: price forms lower lows while Market Pulse forms higher lows → selling pressure is fading; potential reversal or bounce.
Bearish divergence: price forms higher highs while Market Pulse fails to confirm → buying momentum is losing strength; potential correction ahead.
For reliability, look for divergences on higher timeframes (H4, Daily).
On lower timeframes, treat them as early warnings.
7) Typical Use Cases
Breakout confirmation: price breaks resistance with a rising Market Pulse → confirms genuine participation.
False signal filter: price breaks a level but Market Pulse remains flat/negative → likely fake breakout.
Pullback entry: after a breakout, wait for a short retracement and a new positive pulse → safer entry point.
Exit signal: if you’re long and Market Pulse suddenly turns negative with strong volume → consider partial exit or tighter stops.
8) Recommended Timeframes
Intraday / Scalping: 5–30 min charts with length 10–14, smoothLen 3–5.
Swing trading: 1h–4h charts with length 20–50.
Position trading: Daily charts with larger length (50–100) for smoother data.
Always optimize parameters to the specific asset — there are no universal settings.
9) Limitations
This indicator is not a trading system — it’s a decision-support tool.
Results depend on the quality of the volume data available for the symbol.
Performance and sensitivity are influenced by length, smoothing, and multiplier values — always test before live trading.
Use alongside sound risk and money management.
10) Disclaimer
This script is provided for educational purposes only and does not constitute financial advice.
Trading and investing involve significant risk, including the potential loss of capital.
Always test indicators in simulation environments and make independent decisions based on your own analysis and risk tolerance.
Italiano
1) Scopo generale
Flow Pulse è un oscillatore pensato per visualizzare la forza e la direzione del flusso di mercato in modo immediato. Non è un semplice indicatore di volume né una copia di RSI/MACD: combina tre dimensioni fondamentali — variazione di prezzo, volume normalizzato e volatilità — per mettere in evidenza i momenti in cui la pressione dei partecipanti è realmente significativa.
È ideale per identificare: entrate guidate da flussi reali, potenziali esaurimenti, momenti di compressione/espansione del movimento e segnali di conferma per breakout o rimbalzi.
2) Dati utilizzati
L’indicatore usa esclusivamente dati disponibili sulla piattaforma TradingView del grafico corrente:
price (close) — per calcolare la variazione percentuale del prezzo;
volume per misurare l’intensità degli scambi (normalizzato su media);
ATR (Average True Range) — per normalizzare la volatilità rispetto al prezzo;
Tutti i feed (prezzo e volume) sono quelli forniti dall’exchange/fornitore dati collegato al simbolo sul grafico.
3) Logica e passaggi di calcolo
Velocità del prezzo: calcolo della variazione percentuale tra la chiusura corrente e la chiusura N barre fa:
priceChange = (close - close ) / close
— misura la direzione e magnitudine del movimento in termine relativo.
Volume normalizzato: rapporto tra il volume corrente e la media mobile semplice del volume su length barre:
volNorm = volume / sma(volume, length)
— evidenzia volumi anomali rispetto alla media.
Volatilità normalizzata (ATR): rapporto ATR/close per rendere la volatilità comparabile across price levels:
atrNorm = atr(length) / close
Combinazione: il prodotto di questi fattori (con un piccolo offset su ATR) genera un valore grezzo:
rawPulse = priceChange * volNorm * (1 + atrNorm)
— se priceChange e volNorm sono positivi e l’ATR è presente, il rawPulse sarà significativamente positivo.
Smoothing: media mobile semplice (SMA) applicata al rawPulse e moltiplicazione per un fattore scalare (multiplier) per portare il range su livelli leggibili:
flowPulse = sma(rawPulse * multiplier, smoothLen)
4) Parametri esposti (default consigliati)
length (periodo analisi) — default 20: influenza calcolo Δ% e media volumi; allunga la finestra storica.
smoothLen (smussamento) — default 5: smoothing del segnale per ridurre rumore.
multiplier — default 100: fattore di scala per rendere l’oscillatore più leggibile.
5) Interpretazione pratica dei valori
FlowPulse > 0 (verde): predominanza di flusso d’ingresso — pressione d’acquisto. Maggiore il valore, più forte la convinzione (volume + movimento + volatilità).
FlowPulse < 0 (rosso): predominanza di flusso in uscita — pressione di vendita.
Vicino a 0: assenza di flussi netti chiari; mercato piatto o bilanciato.
Picchi repentini: indicano accelerate di flusso — spesso coincidono con rotture, open/close session, news.
Sostegno al trade: usa FlowPulse come conferma prima di entrare su breakout o come avviso di attenzione su esaurimenti.
6) Divergenze (come leggerle)
Le divergenze tra prezzo e FlowPulse sono segnali importanti:
Divergenza rialzista (bullish divergence): prezzo fa nuovi minimi mentre FlowPulse non fa nuovi minimi (o forma minimo relativo più alto) → indica che la spinta di vendita non è supportata da volume/volatilità, possibile inversione/rimbalzo.
Divergenza ribassista (bearish divergence): prezzo fa nuovi massimi mentre FlowPulse non li conferma (o forma massimo relativo più basso) → la spinta d’acquisto è “debole”, possibile esaurimento e inversione.
Note pratiche: cercare divergenze su timeframe maggiori (H4, D) per maggiore attendibilità; sui timeframe minori prendere solo come early warning.
7) Esempi d’uso operativo
Conferma breakout: prezzo rompe resistenza + FlowPulse positivo e crescente → breakout più probabile e con volumi reali.
Filtro per falsi segnali: prezzo rompe ma FlowPulse è piatto/negativo → alto rischio di false breakout.
Entrata per pullback: dopo breakout, attendere un pullback con FlowPulse che torna positivo → ingresso più prudente.
Gestione delle uscite: se sei long e FlowPulse improvvisamente si inverte in negativo su volumi elevati → considerare riduzione posizione o stop.
8) Timeframe consigliati
Intraday / Scalping: M5–M30 con length ridotto (es. 10–14) e smoothLen piccolo.
Swing trading: H1–H4 con length 20–50.
Position trading: D1 con length maggiore per filtrare rumore.
Testa i parametri sul tuo asset e timeframe; nessun parametro è universale.
9) Limitazioni e avvertenze
L’indicatore non è un sistema di trading completo: è un tool di informazione e timing.
Dipende dalla qualità dei dati di volume del simbolo: su alcuni titoli/mercati (es. alcuni ETF, Forex su certi broker) il volume può essere parziale o non rappresentativo.
I valori di margine/multiplier e smoothing influenzano sensibilmente sensibilità e falsi segnali: backtest e ottimizzazione sono raccomandati.
Non usare il solo FlowPulse per entrare su leva elevata senza gestione del rischio12) Disclaimer da inserire
Disclaimer: Questo indicatore è fornito solo a scopo didattico e non costituisce consulenza finanziaria. L’uso comporta rischi: valuta sempre la gestione del rischio e testa su conto demo prima dell’applicazione in reale.

Indicator Overview主力籌碼預判買賣力道 (JUMBO)Pro+ 2.0主力預判買賣力道 Pro+ 是一個先進的多維度交易分析系統,專為台灣股市投資者設計。本指標整合了趨勢、成交量、動量、價格位置和波動率五大維度,通過加權評分系統生成綜合的「Power指標」,精準預判主力資金動向。
🔧 核心技術架構
1. 多維度評分系統
趨勢維度 (30%):雙EMA系統 + MACD + ADX趨勢強度
成交量維度 (25%):OBV能量潮 + 成交量比率分析
動量維度 (20%):RSI + MFI資金流量指標
價格位置維度 (20%):VWAP + 布林通道位置分析
波動率維度 (5%):ATR波動率調整
2. 多重確認機制
趨勢確認:EMA金叉/死叉 + 超級趨勢方向
成交量確認:成交量脈衝檢測 + OBV趨勢確認
動量確認:RSI超買超賣 + MFI資金流向
位置確認:布林通道位置 + VWAP相對位置
📊 主要功能特色
訊號系統
主力佈局訊號 🟥
趨勢多頭確認 + Power > 35
成交量放大 + 動量指標多頭
RSI未超買 + 價格突破基準
主力出貨訊號 🟩
趨勢空頭確認 + Power < -35
成交量異常 + 動量指標空頭
RSI未超賣 + 價格跌破基準
Power交叉訊號 🟠🔵
黃金交叉:Power線向上穿越Power MA線
死亡交叉:Power線向下穿越Power MA線
視覺化系統
台灣股市顏色標準:紅色上漲/多頭,綠色下跌/空頭
多層級K線著色:強力訊號→普通訊號→偏多偏空→盤整
智能資訊面板:實時顯示8大關鍵指標狀態
⚙️ 參數設定說明
主要參數
EMA週期:13/55(短期/長期)
Power閾值:35(靈敏度調整)
成交量濾波:1.2倍(異常成交量檢測)
超級趨勢:10週期/3倍數(趨勢過濾)
進階參數
布林通道:20週期/2倍標準差
波動率設定:14週期ATR
動量指標:14週期RSI/MFI
🎯 交易應用策略
進場時機
強力買入:🔥標記 + Power黃金交叉
常規買入:紅色向上箭頭 + Power > 35
確認買入:多重條件同時滿足
出場時機
強力賣出:💧標記 + Power死亡交叉
常規賣出:綠色向下箭頭 + Power < -35
風險控制:趨勢反轉 + 動量減弱
風險管理
止損設定:ATR波動率參考
倉位控制:Power數值強度分級
訊號過濾:ADX趨勢強度確認
📈 指標優勢
高準確率:多重條件過濾,減少假訊號
及時性:領先指標預判主力動向
完整性:涵蓋技術分析主要維度
用戶友好:直觀的視覺化設計
自定義:參數可調適應不同交易風格
🎯 Indicator Overview
Main Force Prediction Buying/Selling Strength Pro+ is an advanced multi-dimensional trading analysis system specifically designed for Taiwan stock market investors. This indicator integrates five key dimensions: trend, volume, momentum, price position, and volatility, generating a comprehensive "Power Indicator" through a weighted scoring system to accurately predict institutional fund movements.
🔧 Core Technical Architecture
1. Multi-Dimensional Scoring System
Trend Dimension (30%): Dual EMA system + MACD + ADX trend strength
Volume Dimension (25%): OBV accumulation + Volume ratio analysis
Momentum Dimension (20%): RSI + MFI money flow index
Price Position Dimension (20%): VWAP + Bollinger Bands position analysis
Volatility Dimension (5%): ATR volatility adjustment
2. Multi-Confirmation Mechanism
Trend Confirmation: EMA golden/death cross + SuperTrend direction
Volume Confirmation: Volume spike detection + OBV trend confirmation
Momentum Confirmation: RSI overbought/oversold + MFI money flow
Position Confirmation: Bollinger Bands position + VWAP relative position
📊 Key Features
Signal System
Institutional Accumulation Signals 🟥
Bullish trend confirmation + Power > 35
Volume expansion + Momentum indicators bullish
RSI not overbought + Price breakthrough baseline
Institutional Distribution Signals 🟩
Bearish trend confirmation + Power < -35
Abnormal volume + Momentum indicators bearish
RSI not oversold + Price breakdown below baseline
Power Cross Signals 🟠🔵
Golden Cross: Power line crosses above Power MA line
Death Cross: Power line crosses below Power MA line
Visualization System
Taiwan Market Color Standard: Red for uptrend/bullish, Green for downtrend/bearish
Multi-level Candlestick Coloring: Strong signals → Regular signals → Bias signals → Consolidation
Smart Info Panel: Real-time display of 8 key indicator statuses
⚙️ Parameter Settings
Main Parameters
EMA Periods: 13/55 (Short-term/Long-term)
Power Threshold: 35 (Sensitivity adjustment)
Volume Filter: 1.2x (Abnormal volume detection)
SuperTrend: 10 period/3 multiplier (Trend filtering)
Advanced Parameters
Bollinger Bands: 20 period/2 standard deviations
Volatility Settings: 14 period ATR
Momentum Indicators: 14 period RSI/MFI
🎯 Trading Application Strategies
Entry Timing
Strong Buy: 🔥 Mark + Power Golden Cross
Regular Buy: Red upward arrow + Power > 35
Confirmed Buy: Multiple conditions simultaneously met
Exit Timing
Strong Sell: 💧 Mark + Power Death Cross
Regular Sell: Green downward arrow + Power < -35
Risk Control: Trend reversal + Momentum weakening
Risk Management
Stop Loss Setting: ATR volatility reference
Position Sizing: Power value strength grading
Signal Filtering: ADX trend strength confirmation
📈 Indicator Advantages
High Accuracy: Multiple condition filtering reduces false signals
Timeliness: Leading indicators predict institutional movements
Completeness: Covers main dimensions of technical analysis
User-Friendly: Intuitive visualization design
Customizable: Adjustable parameters adapt to different trading styles
🔍 Professional Usage Tips
Trend Confirmation: Use in conjunction with major trend direction
Volume Validation: Ensure volume confirms price movements
Risk Management: Always use appropriate position sizing
Timeframe Analysis: Apply across multiple timeframes for confirmation
Market Context: Consider overall market conditions and sector rotation
版本: Pro+ 2.0
適用市場: 台股、亞股、全球股市
最佳時間框架: 日線、4小時線、1小時線
開發者: JUMBO Trading System
更新日期: 2025版本

Paste Horizontal LinesThis script automictically will draw horizontal line for previous key Price Action levels. I created this script to facilitate line drawing process. I receive key price targets from a trading service for a few stocks every morning. I needed a fast way to lay them out. I copy and past and BAM! Unique situation I know, so you may or may have a need. So if you do it works perfectly. If you want changes let me know.

GTI Buy/SellGTI Buy/Sell – Precision Reversal & Trend Confirmation Tool
The GTI Buy/Sell is an indicator designed to identify potential trend reversals and confirm ongoing trends with precision.
What It Does
This indicator generates Buy and Sell signals based on dynamic positioning relative to price action. A Buy signal is printed when the GTI line closes below the candle’s close, indicating a potential transition from a bearish to bullish phase. A Sell signal occurs when the GTI line appears above the candle’s close, suggesting a possible bearish reversal.
The GTI Buy/Sell doesn’t repaint and provides clear, actionable signals based on live market conditions.
How It Works
GTI Buy/Sell combines Average True Range (ATR) for volatility filtering, Smoothed Moving Averages (RMA), Simple Moving Average (SMA), and Exponential Moving Average (EMA) to generate a responsive trend-following structure.
Rather than using static crossovers, the script evaluates price interaction with multiple weighted moving averages and ATR thresholds to identify exhaustion points and turning moments. These calculated confluences enhance signal quality and reduce false positives.
Strategy & Usage Tips
Combine with a 38-period SMA: When the GTI prints a Buy signal and price is above the 38 SMA, it reinforces bullish continuation or reversal. Similarly, a Sell signal with price under the 38 SMA supports a bearish outlook.
Use with VWAP for Validation: In high-liquidity assets such as indices, pairing GTI with VWAP helps identify institutional support/resistance zones to validate the signal strength.
Confluence with GTI Trend: For best results, use this indicator alongside our GTI Trend, which analyzes broader trend context across timeframes. This combination allows traders to align micro signals with macro market direction.
Recommended Assets
GTI Buy/Sell performs best on assets with significant intraday volatility such as:
NASDAQ
US30 / Dow Jones
S&P 500
Gold (XAUUSD)
Brazilian Mini Index (WIN)
However, it can be applied to any instrument where meaningful trend behavior and price movement are present.

Pearson SL/TP📘 Description
Pearson SL/TP — Advanced Correlation-Based Strategy with Full Risk Management
The Pearson SL/TP indicator is an advanced market analysis tool that combines Pearson correlation, volatility-based stop/target levels, and dynamic signal strength evaluation.
It is designed for traders who want to visualize potential momentum shifts and risk/reward zones in a single, integrated chart.
🔍 Core Concept
This script measures the **Pearson correlation coefficient between recent price movements and time progression, highlighting potential trend exhaustion or momentum reversals when the correlation reaches extreme values.
* High positive correlation (near +1) → price moving steadily upward → possible overbought condition.
* High negative correlation (near -1) → price moving steadily downward → possible oversold condition.
When these extremes are reached, and confirmed by several internal filters, the script generates LONG or SHORT signals with fully calculated Stop Loss and Take Profit levels.
⚙️ Main Features
📈 Signal Generation
* Uses Pearson correlation as a primary indicator of trend intensity.
* Detects potential reversal zones when correlation crosses user-defined thresholds.
* Optional divergence confirmation enhances signal reliability.
💰 Risk Management
* Stop Loss (SL) and Take Profits (TP1 & TP2) automatically adapt to volatility using the ATR (Average True Range).
* Dynamic risk/reward ratios help assess trade quality.
* Adjustable multipliers let you fine-tune your risk parameters.
🧠 Signal Strength Analysis
Each signal is graded from Weak to Very Strong based on four factors:
1. Volume activity
2. Trend alignment
3. Pearson momentum
4. Correlation change intensity
🎨 Visualization
* Overbought / Oversold background zones
* Signal arrows (LONG / SHORT)
* SL / TP** price levels and labels
* Interactive dashboard** displaying:
* Current Pearson value
* Market state (Overbought / Oversold / Neutral)
* Signal strength
* Latest trade data (Entry, SL, TP1, TP2, Risk:Reward)
🔔 Alerts
Built-in alerts for:
* Confirmed LONG / SHORT signals
* Bullish / Bearish divergences
🧩 Customization
All major parameters — including **Pearson length, thresholds, ATR multipliers, and visual options — are fully customizable.
This allows you to adapt the indicator to any market, timeframe, or trading style.

Power Balance ForecasterHey trader buddy! Remember the old IBM 5150 on Wall Street back in the 80s? :) Well, I wanted to pay tribute to it with this retro-style code when MS DOS and CRT screens were the cutting edge of technology...
Analysis of the balance of power between buyers and sellers with price predictions
What This Indicator Does
The Power Balance Forecaster indicator analyzes the relationship between buyer and seller strength to predict future price movements. Here's what it does in detail:
Main Features:
Power Balance Analysis: Calculates real-time percentage of buyer power vs seller power
Price Predictions: Estimates next closing level based on current momentum
Market State Detection: Identifies 5 different market conditions
Visual Signals: Shows directional arrows and price targets
How the Trading Logic Works
Power Balance Calculation:
Analyzes Consecutive Bars - Counts consecutive bullish and bearish bars
Calculates Momentum - Uses ATR-normalized momentum to measure trend strength
Determines Market State - Assigns one of 5 market states based on conditions
Market States:
Bull Control: Strong uptrend (75% buyer power)
Bear Control: Strong downtrend (75% seller power)
Buying Pressure: Bullish pressure (65% buyer power)
Selling Pressure: Bearish pressure (65% seller power)
Balance Area: Market in equilibrium (50/50)
Prediction System:
Bullish Condition: Buyer power > 55% + Positive momentum = Bullish prediction
Bearish Condition: Seller power > 55% + Negative momentum = Bearish prediction
Price Target: Based on ATR multiplied by timeframe factor
Configurable Parameters:
Analysis Sensitivity (5-50): Controls how responsive the indicator is
Low values (5-15): More sensitive, ideal for scalping
High values (30-50): More stable, ideal for swing trading
Table Position: Choose from 9 positions to display the data table
Trading Signals:
Green Triangle ▲: Bullish signal, price expected to increase
Green Triangle ▼: Bearish signal, price expected to decrease
Dashed Line: Shows the price target projection
Label: Displays the exact target value
Recommended Timeframes:
Lower Timeframes (1-15 minutes):
Sensitivity: 10-20
Automatic Low TF mode
Higher Timeframes (1 hour - 1 day):
Sensitivity: 25-40
Automatic High TF mode
Important Notes:
Always use this indicator in combination with:
Market context analysis
Proper risk management
Confirmation from other indicators
Mandatory stop losses
The indicator works best in trending markets and may be less effective during extreme consolidation periods.

Astrology Events
Astrology Events
This indicator marks critical astronomical events that correlate with significant market movements, based on established principles of financial astrology and planetary cycle analysis.
CORE ASTRONOMICAL EVENTS TRACKED:
Planetary Sign Ingress (0 degrees)
Outer planet sign changes: Saturn, Jupiter, Uranus, Neptune, Pluto.
Inner planet sign changes: Sun (monthly), Moon (every 2.5 days approximately).
Special emphasis on 0 degrees Aries ingress across all celestial bodies.
Critical Degrees
Ending degrees (29 degrees) - Anaretic degree before sign transition.
24-hour harmonic divisions (15-degree intervals).
Zero-degree ingress points for all major planets.
Planetary Stations
Retrograde stations: When planets appear to stop and reverse direction.
Direct stations: When retrograde planets resume forward motion.
Includes all outer planets (Jupiter, Saturn, Uranus, Neptune, Pluto) plus Mercury.
Mercury Retrograde Periods
Complete retrograde cycles with start and end dates.
One of the most reliable indicators for market volatility and reversals.
Major Planetary Aspects
Conjunctions (0 degrees separation).
Squares (90 degrees).
Oppositions (180 degrees).
Trines (120 degrees).
Focus on slow-moving outer planet pairs that historically correlate with market movements.
Lunar Cycles
Automatically calculated New Moon phases.
Automatically calculated Full Moon phases.
Uses astronomical algorithms for precise ephemeris calculation.
RULE OF 3 CLUSTER DETECTION
Markets typically require multiple simultaneous astronomical events to produce significant movements. This indicator automatically detects when three or more events occur within a configurable time window (default: 3 days). Clusters are highlighted with background shading and labeled for easy identification.
HIERARCHICAL IMPORTANCE PRINCIPLE
Events are weighted by planetary velocity:
Slower-moving planets (Pluto, Neptune, Uranus) produce larger, longer-lasting market effects.
Faster-moving planets (Sun, Moon) produce shorter-duration effects.
Outer planet events occur less frequently and are therefore more significant.
CONFIGURABLE PARAMETERS:
Event Toggles:
Planet sign changes (0 degrees).
Ending degrees (29 degrees).
Retrograde and Direct stations.
24-degree harmonic intervals.
Sun sign changes.
Moon sign changes.
Mercury retrograde periods.
Major planetary aspects.
Moon phases (auto-calculated).
Aries ingress highlighting.
Rule of 3 cluster detection.
Display Settings:
Label size options (tiny, small, normal).
Individual color customization for each event category.
Cluster detection time window (1-14 days).
Minimum events for cluster threshold (2-5 events).
VISUAL INDICATORS:
Labels: Event markers positioned above/below price bars.
Lines: Vertical lines for significant events (Mercury retrograde, Aries ingress).
Background shading: Highlights Rule of 3 clusters.
Information table: Real-time display of active event filters.
DATA INPUT REQUIREMENTS:
Sample astronomical event dates are provided as templates. For accurate real-time analysis, users should update dates using:
Professional astronomical ephemeris data.
Planetary position calculators.
Astronomical almanacs.
ASTRONOMICAL CALCULATION METHODS:
Moon phases are calculated using:
Julian Date conversion algorithms.
Solar and lunar anomaly calculations.
Ecclesiastical moon phase formulas.
Automatic adjustment for leap years.
APPLICATION IN MARKET ANALYSIS:
This indicator is designed to identify potential timing windows for market reversals, accelerations, or consolidations. It should be used in conjunction with:
Traditional technical analysis, volume trend indicators, risk management practices
LIMITATIONS:
Astronomical events indicate potential timing windows, not directional bias.
Correlation does not imply causation!!!
Historical correlation varies across different markets and time periods.
Should not be used as a standalone trading system.
RCOMANDATIONS:
Update event dates quarterly using current ephemeris data.
Monitor for Rule of 3 clusters as high-probability timing windows.
Pay particular attention to outer planet events (occur less frequently, higher significance).
Cross-reference astronomical timing with traditional support/resistance levels.
Use 0-degree Aries ingress and 29-degree positions as primary alerts.
This indicator is for educational purposes. Astronomical timing methods should be integrated with comprehensive market analysis, data and proper risk management practices.
P.S THIS IS VERSION 1 AND STILL IN TEST

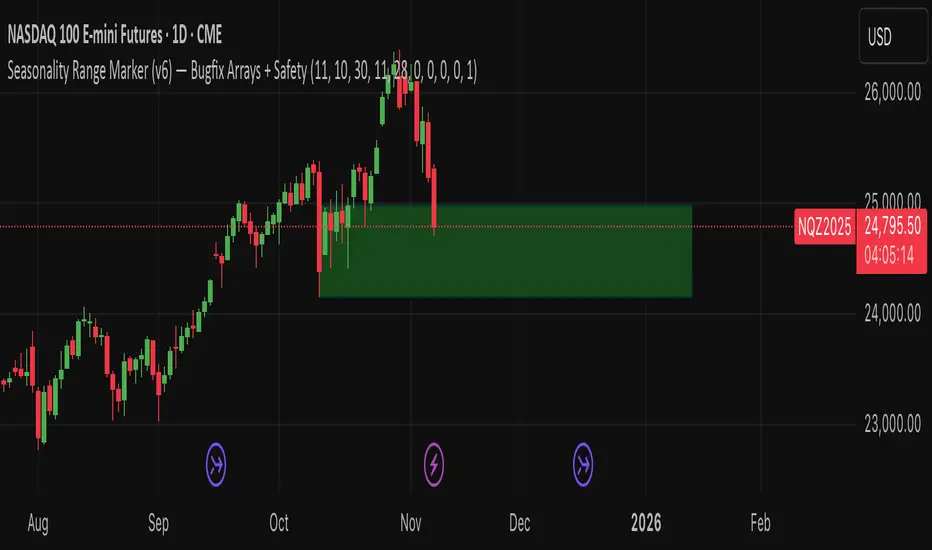
Seasonality Range Marker For better Seasonality Analysation. To see Seasionality patterns in the chart.
CPR Scenario and 2 days CPR relationship Analysis -Here’s a detailed explanation of the CPR (Central Pivot Range) relationships :
1. Higher Value Relationship
Definition: Today’s entire CPR (from BC to TC) is completely above yesterday’s entire CPR.
Indicates: Strongly Bullish Bias
Today’s BC (Bottom Central) > Yesterday’s TC (Top Central)
Implies the market sentiment is much more bullish than the previous day.
Trading Insight: Look for long trades, especially if the opening price is above CPR.
2. Overlapping Higher Value Relationship
Definition: Today’s CPR is higher than yesterday’s, but partially overlaps with it.
Indicates: Moderate Bullish Bias
Pivot shifted up, but some overlap exists between the ranges.
Trading Insight: Bias is positive; confirm trade with open above CPR or price action.
3. Lower Value Relationship
Definition: Today’s entire CPR is completely below yesterday’s CPR.
Indicates: Strong Bearish Bias
Today’s TC < Yesterday’s BC
Trading Insight: Look for short trades, especially if opening is below CPR.
4. Overlapping Lower Value Relationship
Definition: Today’s CPR is lower than the previous day’s, with partial overlap.
Indicates: Moderate Bearish Bias
Pivot shifted down, but ranges still overlap partly.
Trading Insight: Initial bias negative, look for shorting opportunities.
5. Unchanged Value Relationship
Definition: Today’s CPR is virtually unchanged (locations very close) compared to yesterday’s CPR.
Indicates: Sideways or Potential Breakout Day
Range and pivot nearly the same.
Trading Insight: Watch for breakout trades if price emerges out of the range.
6. Outside Value Relationship
Definition: Today’s CPR engulfs or completely surrounds yesterday’s CPR.
Indicates: Range-bound/Sideways Bias
Today’s BC < Yesterday’s BC and Today’s TC > Yesterday’s TC.
Trading Insight: Expect sideways action, mean reversion trades, or range trading.
7. Inside Value Relationship
Definition: Today’s CPR is completely inside yesterday’s CPR.
Indicates: Breakout Expected
Both TC and BC are within yesterday’s TC and BC.
Trading Insight: Watch for sharp breakout moves; trade in the direction of the breakout.
How to Use These Relationships
Initial Bias: Where today’s CPR sits relative to yesterday’s gives a directional clue.
Confirmation: How today’s market opens relative to CPR adds confidence.
Strategy: Align your trades (long or short) with the dominant CPR relationship and price’s position relative to the CPR band.

LP's Distribution KillzonesLukesProjections High Volume Kill Zones
This includes the London and New York session Killzones.

Inter-symmetric Forecast (ISF)Concept:
The Inter-Symmetric Forecast (ISF) is a physics-inspired price projection tool that visualizes both trend-continuation and mean-reversion scenarios in one dynamic structure. It extends the classic ADAM Projection by introducing a regime-sensitive weighting based on the Market Reynolds Number (Reₘ), a dimensionless ratio of market momentum × liquidity to volatility-derived “viscosity.”
Mechanism:
ISF mirrors past price action around the current close (the continuation path) while also forward-pasting the same pattern unreflected (the anti-trend path). It then blends these paths bar-by-bar using time-reflected Reₘ values — meaning the liquidity-momentum regime of each past segment determines how much its future mirror leans toward continuation or reversion.
Interpretation:
High Reₘ → strong inertia/liquidity, favors trend continuation.
Low Reₘ → high friction/volatility, favors mean reversion.
The yellow blended forecast shows the regime-weighted midpoint between both outcomes.
Use:
ISF offers traders a visual probability corridor rather than a fixed prediction — illustrating how far a move might extend if momentum persists, or fade if conditions become viscous. It’s best used as a contextual forecasting overlay for discretionary or systematic analysis.

Hybrid Linear Regression Channel with Fibonacci LevelsHow to Use the LRC Fib Hybrid Indicator (Detailed Guide)
1. Read the Trend
2.The thick blue line is the linear regression midline.
If it’s sloping upward → uptrend (favor longs).
If sloping downward → downtrend (favor shorts).
The gray channel bounds are ±2 standard deviations (adjustable).
3. Understand Fibonacci Levels
Fib lines are projected parallel to the regression slope using the channel width as 100%:
Red dashed lines (0.0 to 0.786): Support zones in uptrends.
Blue dashed line (0.5): Midline/neutral.
Green dashed lines (1.0 to 2.618): Resistance zones in downtrends.
Strongest levels: 0.618 (support) and 1.618 (resistance).
4. Buy Signal (Long Entry)
Triggered when:
Midline is rising (uptrend confirmed).
Price crosses above a red Fib level (0.0–0.786).
Volume > 20-period average (if confirmation enabled).
Action:
Enter long on the green triangle (▲).
Stop Loss: Below the lower gray channel or recent swing low.
Take Profit: At 1.0, 1.272, or 1.618 green Fibs.
5. Sell Signal (Short Entry)
Triggered when:
Midline is falling (downtrend).
Price crosses below a green Fib level (1.272–2.618).
Volume > average.
Action:
Enter short on the red triangle (▼).
Stop Loss: Above the upper gray channel.
Take Profit: At 1.0, 0.786, or 0.618 red Fibs.
6. Use the Info Table (Bottom-Right)
Shows live prices of all Fib levels, current trend ("Up"/"Down"), and signal status ("BUY"/"SELL"/"None").
7. Customize via Settings (Gear Icon)
Regression Length: 50–200 (shorter = faster response).
Std Dev Multiplier: 1.5–3.0 (tighter/wider channel).
Toggle Fibs: Hide unused levels to declutter.
Volume Confirmation: Turn off for pure price action.
8. Set Alerts
Right-click chart → Add Alert → Select "Buy Signal" or "Sell Signal" → Enable popup/email/webhook.
9. Best Practices
Best in trending markets (avoid chop).
Wait for volume spike on bounce.
Combine with higher timeframe bias.
Use 0.618/1.618 as primary reversal zones.
This indicator gives you adaptive trend, precise entries, volume filter, and dynamic targets — all in one clean overlay.

Liquidity Pools by Ivanliquidity is marked by red and green
RED is institutions
GREEN is retail
it works by time frames so chart doesnt get clutterd
so for example on 15 min you will only get 15 min tf liquidity on 4h you will only get liquidity for 4h tf liquidity and so on

Predicta Futures – Scalping Predictor with Confidence FilterPredicta Futures is an advanced short-term forecasting indicator that combines historical pattern similarity analysis with weighted technical signals to predict price movements 1–10 minutes ahead.
**Core Functionality**
The script scans up to 5,000 historical bars to identify structurally similar price patterns. It aggregates forward outcomes from matched patterns and integrates real-time signals from RSI, MACD, Bollinger Bands, volume momentum, and volatility. A composite confidence score filters signals, displaying only those meeting the user-defined threshold (default ≥68%).
**Key Outputs**
- Buy/sell triangles with text labels
- Dashed projection line to predicted price
- Dotted target and ATR-based stop lines
- Info panel showing forecast direction, confidence %, expected move %, pattern count, order book status, and data access details
**Customization & Performance**
- Execution modes: Fast, Balanced, Accurate
- Adaptive sampling with recency bias option
- Filters for volatility and market hours
- Adjustable weights, lookback period, and prediction horizon
**Use Cases**
Scalping, intraday trading, futures, cryptocurrencies, equities.
*Order book metrics are simulated (platform limitation). Technical analysis tool; not financial advice.*

Latest Up/Down StreakThis indicator allows following the latest streak of ups and downs according to clos price. It is made as a tool for investors wanting to time their buy/sell according to streaks.
The indicator allows for creating alerts to notify when a certain streak has reached.

PDH PDL Open ClosePDH/PDL/Open/Close Levels Indicator
Overview
This Pine Script indicator plots the Previous Day High (PDH), Previous Day Low (PDL), Previous Day Open (PDO), and Previous Day Close (PDC) levels on your chart. It's designed for traders who rely on key daily levels to identify potential support, resistance, and intraday reference points. The indicator supports multiple timeframes, allowing you to visualize these levels from higher timeframes (e.g., weekly or monthly) directly on lower timeframe charts.
Built with Pine Script v6, it's lightweight, customizable, and overlays seamlessly on any symbol. Lines extend slightly into the future for better visibility, and labels provide clear identification with price values.
Key Features
- Multi-Timeframe Support: Choose from predefined timeframes (5m to 1M) via the input settings to fetch and plot levels from the selected period.
- Clean Visualization:
- PDH and PDL: Solid black lines for high/low levels.
- PDO: Dotted blue line for the opening price.
- PDC: Dotted red line for the closing price.
- Dynamic Labels: Automatically placed at the end of each line, showing the timeframe and exact price (e.g., "1D High: 150.25").
- Efficient Updates: Lines and labels update in real-time without cluttering the chart—old elements are automatically cleaned up.
- Extension Handling: Lines extend 2 bars ahead by default, adjustable if needed via code modifications.
How to Use
1. Add to Chart**: Copy the script into TradingView's Pine Editor, save, and add it to your chart.
2. Customize Timeframe: In the indicator settings, select your desired timeframe (default: 1D). This pulls levels from the previous period of that timeframe.
3. Interpret Levels:
- Use PDH/PDL as potential resistance/support zones.
- PDO/PDC can highlight session biases (e.g., gap fills or continuation patterns).
- Ideal for day trading, swing setups, or aligning with higher timeframe context.
4. Best Practices: Works on any market (stocks, forex, crypto). Combine with volume or momentum indicators for confluence.
Settings
- Timeframe: Dropdown with options: 5m, 10m, 15m, 30m, 45m, 1H, 2H, 3H, 4H, 1D, 1W, 1M.
- No other inputs for simplicity—colors, styles, and extensions are hardcoded for a clean default look. Edit the script to tweak (e.g., line colors or extension length).

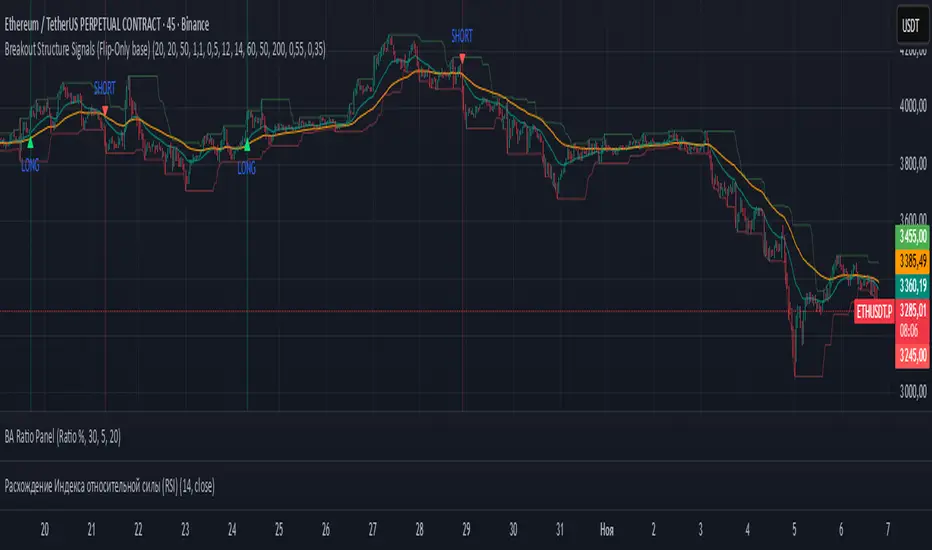
Breakout Structure SignalsBreakout Structure Signals
Trend-following Donchian breakouts with optional retests, HTF trend filter, volume & ADX gates, and one-signal-per-direction control.
What it does
Prints LONG / SHORT when price breaks the prior Donchian High/Low and/or makes a qualified retest of that level.
Works with trend via EMAs on the chart TF; optional HTF EMA filter confirms higher-timeframe bias.
Optional Volume and ADX filters, plus soft candle-quality checks.
Signals confirm on bar close (no intrabar repaint on your chart TF). Duplicate signals can be suppressed until direction flips.
Core logic
Breakout Long: close > DonchianHigh AND EMAfast > EMAslow AND close > EMAslow .
Breakout Short: close < DonchianLow AND EMAfast < EMAslow AND close < EMAslow .
Retest (optional): after breakout, wait up to maxBarsWait for a pullback within ATR × retestTolATR around the breakout level; price must also align with the fast EMA (above for longs, below for shorts).
Filters (optional): Volume > SMA20 × volMult , ADX > 20 , candle-quality: close position within range ≥ closePosMin and body/range ≥ impulseBodyMin .
HTF trend (optional): Longs require HTF EMAfast > HTF EMAslow ; shorts require the opposite (via request.security on htf_tf ).
Inputs (key)
lengthRange — Donchian N (high/low lookback).
emaFastLen , emaSlowLen — chart-TF trend filter.
useVolumeFilt , volMult — volume gate (turn OFF where volume is unreliable).
useRetest , retestTolATR , maxBarsWait — retest behavior & tolerance.
useADX , adxLen — trend-strength filter.
useHTF , htf_tf , htfEmaFastLen , htfEmaSlowLen — higher-TF confirmation.
useCandleQual , closePosMin , impulseBodyMin — soft candle-quality checks.
confirmOnClose — confirm signals on close.
suppressSameSide — block repeats until reversal.
showBg — background highlight on signal bars.
Visuals
Plots: EMA Fast , EMA Slow , Donchian High/Low .
Markers: triangle LONG below bars, triangle SHORT above bars.
Optional background tint on signal bars.
Alerts
LONG signal — breakout or qualified retest (long).
SHORT signal — breakout or qualified retest (short).
How to use
Start with Donchian 20 , EMA 20/50 ; for LTF trading, consider HTF = 60m/240m.
Retests: try 0.3–0.6 ATR tolerance and 8–12 bars wait for cleaner fills.
Stops: beyond breakout/retest by 1–1.5 ATR or beyond fast EMA; manage with partials and a trailing exit.
Turn Volume filter OFF where volume isn’t informative.
This indicator provides signals only; always combine with risk management.
ATM LEIW23C° Pivot SD Zones Conclusion
I hope you find an use to it, i really like this indicator.
Thanks for reading

Gann_RSGann_RS — Precision Gann Level Indicator (RightSpade Edition)
Gann_RS (RightSpade Edition) is a professional-grade indicator that applies Gann’s square-root progression technique to identify dynamic support and resistance levels around a key reference point (price X).
✅ Key Features
• Auto-detects base level using daily close or daily low.
• Plots symmetrical Gann levels above / below initial X using √X + Step logic.
• Adjustable step size and number of levels.
• Distinct color coding for alternate bands.
⚙️ Usage Tips
• Works on any symbol and timeframe.
• Use smaller Step values (1-2) for tighter intraday analysis, larger values (2-4) for swing setups.
• Combine with trend-based confirmation indicators for maximum accuracy.
🧭 Developed & maintained by
RightSpade Capital Advisors Pvt. Ltd. — SEBI Reg. INH000018799
📌 Disclaimer
This script is for educational & research purposes only and does not constitute investment advice or a buy/sell recommendation. Market participation involves risk; please consult your financial advisor before making trading decisions.
© 2025 RightSpade Capital Advisors Pvt. Ltd. All Rights Reserved.
