Blick Trades Position Size CalculatorThe Blick Trades Position Size indicator is a comprehensive Position Size Calculator designed for futures traders on TradingView. It automatically detects the asset type (Gold, Nasdaq, or ES futures - both regular and micro contracts) and calculates the optimal number of contracts to trade based on your risk amount and stop loss price.
The indicator features a "Maximize Risk" option that intelligently switches between regular and micro contracts to get as close as possible to your target risk amount, plus support for limit orders with custom entry prices. It displays visual elements on the chart including entry and stop loss lines with live risk calculations, and uses an asset-specific display system so you can control which charts show the indicator (preventing parameter confusion when switching between different futures contracts).
The calculator handles all the complex math automatically - just input your risk amount and stop loss, and it tells you exactly how many contracts to trade while showing your precise dollar risk in real-time.
Futures

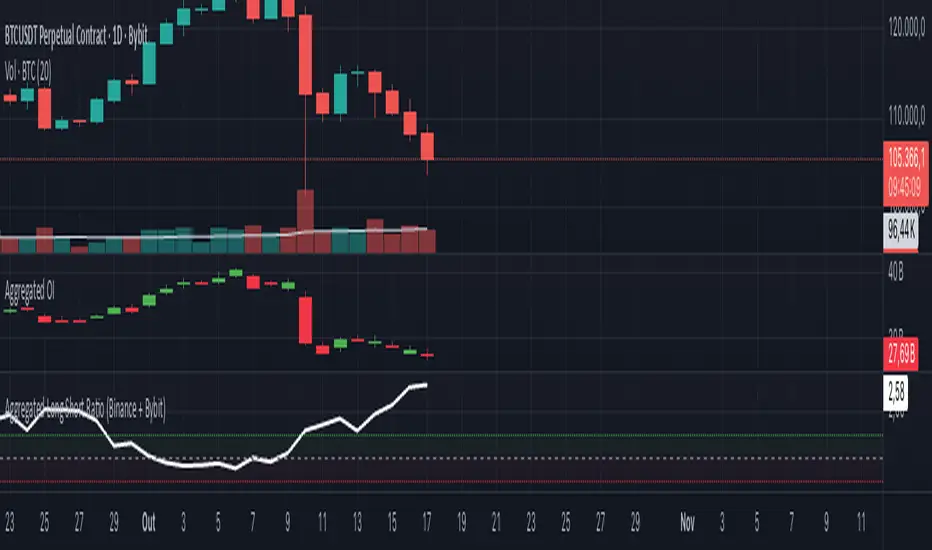
Aggregated Long Short Ratio (Binance + Bybit)This indicator displays the Long/Short Ratio (LSR) from Binance and Bybit exchanges, plus an aggregated average. LSR shows the ratio between traders holding long positions vs short positions.
Settings AvailableExchanges Group:
☑️Show Binance - Display Binance LSR line
☑️ Show Bybit - Display Bybit LSR line
☑️ Show Aggregated LSR - Display combined average
Timeframe - Choose data timeframe (leave empty for chart timeframe)
Visualization Group:
🎨 Binance Color - Default: Yellow
🎨 Bybit Color - Default: Orange
🎨 Aggregated Color - Default: White
📖 How to Read the Indicator
⚠️ CRITICAL: Always analyze LSR together with Open Interest (OI)
Key Levels:
LSR = 1.0 (gray dashed line) = Balance - Equal longs and shorts
LSR > 1.0 = More longs than shorts (bullish sentiment)
LSR < 1.0 = More shorts than longs (bearish sentiment)
Extreme Zones:
LSR > 1.5 (green zone) = Very bullish - Possible market top
LSR < 0.5 (red zone) = Very bearish - Possible market bottom
Why Open Interest Matters:
LSR alone doesn't tell the full story. You MUST check Open Interest:
Rising OI + High LSR (>1.5) = New longs opening → Strong momentum OR potential trap
Rising OI + Low LSR (<0.5) = New shorts opening → Strong momentum OR potential trap
Falling OI + Extreme LSR = Positions closing → Weak signal, avoid trading
Stable OI + Extreme LSR = No new positions → Less reliable signal
💡 Trading Interpretation
⚠️ ALWAYS combine LSR with Open Interest analysis!
Contrarian Strategy (High Leverage Zones):
High LSR (>1.5) + Rising OI → Many new longs → Potential short squeeze OR reversal down
Low LSR (<0.5) + Rising OI → Many new shorts → Potential long squeeze OR reversal up
Trend Confirmation:
Rising LSR + Rising price + Rising OI = Strong bullish trend with new positions
Falling LSR + Falling price + Rising OI = Strong bearish trend with new positions
Weak Signals (Avoid):
Extreme LSR + Falling OI = Positions closing → Low conviction
Extreme LSR + Stable OI = No new money → Wait for confirmation
Divergences:
Price higher highs but LSR falling + Rising OI = Bearish divergence (shorts accumulating)
Price lower lows but LSR rising + Rising OI = Bullish divergence (longs accumulating)
Best Setups:
Reversal: Extreme LSR (>1.5 or <0.5) + Rising OI + Price rejection
Trend: LSR trending with price + Steadily rising OI
Caution: Extreme LSR + Falling OI = Ignore signal
Built-in Alerts
The indicator includes 4 preset alerts:
LSR Crossed Above 1.0 - Market turned bullish
LSR Crossed Below 1.0 - Market turned bearish
LSR Very High - Above 1.5 (possible top)
LSR Very Low - Below 0.5 (possible bottom)
To Set Up Alerts:
Click the "..." on the indicator
Select "Add Alert"
Choose the condition you want
Configure notification method
Best Practices
MANDATORY: Always add Open Interest indicator to your chart alongside LSR
To add OI: Click Indicators → Search "Open Interest" → Add official TradingView OI
Use on perpetual futures charts (symbols ending in .P)
Works best on USDT pairs (BTCUSDT, ETHUSDT, etc.)
Combine LSR + OI + price action + support/resistance levels
Higher timeframes (4h, 1D) give more reliable signals
Don't trade LSR extremes without confirming OI direction
Golden Rule: Rising OI = Strong signal | Falling OI = Weak signal
⚠️ Important Notes
Indicator requires TradingView Premium or above (uses Request library)
Only works on crypto perpetual futures
Data availability depends on exchange API
NA values mean data is not available for that exchange/symbol
Never use LSR without Open Interest context
Aggregated Open Interest Multi-Exchange (USD)This indicator aggregates Open Interest (OI) data from multiple major cryptocurrency exchanges into a single unified view in USD, using data available on TradingView. It automatically adapts to the asset you're viewing on the chart.
Features:
Aggregates OI from 7 major exchanges: Binance, Bybit, OKX, Bitget, Deribit, HTX, and Coinbase
All values converted to USD - unlike native OI which shows contracts/coins
Uses only data available on TradingView platform
Automatically detects the asset from your chart (BTC, ETH, SOL, etc.)
True apples-to-apples comparison across exchanges
Displays as candlesticks showing OI open, high, low, and close
Toggle exchanges on/off individually
Handles different contract types per exchange automatically
Why USD conversion matters:
Traditional OI indicators show values in contracts or crypto units, making it difficult to compare across exchanges. This indicator converts everything to USD, giving you the real dollar value of open positions across all exchanges.
How it works:
Simply add the indicator to any crypto perpetual futures chart. It will automatically fetch and aggregate OI data from all supported exchanges for that asset using TradingView's built-in data feeds, converting everything to USD.
Supported Exchanges:
Binance, Bybit, Bitget, HTX: USDT perpetuals
Deribit: BTC/ETH use USD contracts, others use USDC
OKX: Contract-based (automatically converted)
Coinbase: USDC perpetuals
Perfect for traders who want a comprehensive view of total market Open Interest in USD across exchanges using reliable TradingView data.

Adaptive Trend Breaks Adaptive Trend Breaks
## WHAT IT DOES
This script is a modified and enhanced version of "Trendline Breakouts With Targets" concept by ChartPrime.
Adaptive Trend Breaks (ATB) is a trendline breakout system optimized for scalping liquid futures contracts. The indicator automatically draws dynamic support and resistance trendlines based on pivot points, then generates trade signals when price breaks through these levels with confirmation filters. It includes automated target and stop-loss placement with real-time P&L tracking in dollars.
## HOW IT WORKS
**Trendline Detection Method:**
The indicator uses pivot high/low detection to identify significant price turning points. When a new pivot forms, it calculates the slope between consecutive pivots to draw dynamic trendlines. These lines extend forward based on the established trend angle, creating actionable support and resistance zones.
**Band System:**
Around each trendline, the script creates a "band" using a volatility-adjusted calculation: `ATR(14) * 0.2 * bandwidth multiplier / 2`. This adaptive band accounts for current market conditions - wider during volatile periods, tighter during quiet markets.
**Breakout Logic:**
A breakout signal triggers when:
1. Price closes beyond the trendline + band zone
2. Volume exceeds the 20-period moving average by your set multiplier (default 1.2x)
3. Price is within Regular Trading Hours (9:30-16:00 EST) if session filter enabled
4. Current ATR meets minimum volatility threshold (prevents trading dead markets)
**Target & Stop Calculation:**
Upon breakout confirmation:
- **Entry**: Trendline breach point
- **Target**: Entry ± (bandwidth × target multiplier) - default 8x for quick scalps
- **Stop**: Entry ± (bandwidth × stop multiplier) - default 8x for 1:1 risk/reward
- Multipliers adjust automatically to market volatility through the ATR-based band
**P&L Conversion:**
The script converts point movements to dollars using:
```
Dollar P&L = (Price Points × Contract Point Value × Quantity)
```
For example, a 10-point NQ move with 2 contracts = 10 × $20 × 2 = $400
## HOW TO USE IT
**Setup:**
1. Select your instrument (NQ/ES/YM/RTY) - point values auto-configure
2. Set contract quantity for accurate dollar P&L
3. Choose pivot period (lower = more signals but more noise, default 5 for scalping)
4. Adjust bandwidth multiplier if trendlines are too tight/loose (1-5 range)
**Filters Configuration:**
- **Volume Filter**: Requires breakout volume > moving average × multiplier. Increase multiplier (1.5-2.0) for higher conviction trades
- **Session Filter**: Enable to trade only RTH. Disable for 24-hour trading
- **ATR Filter**: Prevents signals during low volatility. Increase minimum % for more active markets only
**Risk Management:**
- Set target/stop multipliers based on your risk tolerance
- 8x bandwidth = approximately 1:1 risk/reward for most liquid futures
- Enable trailing stops for trend-following approach (moves stop to protect profits)
- Adjust line length to see targets further into the future
**Statistics Table:**
- Choose timeframe to analyze: all-time, today, this week, custom days
- Monitor win rate, profit factor, and net P&L in dollars
- Track long vs short performance separately
- See real-time unrealized P&L on active trades
**Reading Signals:**
- **Green triangle below bar** = Long breakout (resistance broken)
- **Red triangle above bar** = Short breakout (support broken)
- **White dashed line** = Entry price
- **Orange line** = Take profit target with dollar value
- **Red line** = Stop loss with dollar value
- **Green checkmark (✓)** = Target hit, winning trade
- **Red X (✗)** = Stop hit, losing trade
## WHAT IT DOES NOT DO
**Limitations to Understand:**
- Does not predict future trendline formations - it reacts to breakouts after they occur
- Historical trendlines disappear after breakout (not kept on chart for clarity)
- Requires sufficient volatility - may not signal in extremely quiet markets
- Volume filter requires exchange volume data (not available on all symbols)
- Statistics are indicator-based simulations, not actual trading results
- Does not account for slippage, commissions, or order fills
## BEST PRACTICES
**Recommended Settings by Market:**
- **NQ (Nasdaq)**: Default settings work well, consider volume multiplier 1.3-1.5
- **ES (S&P 500)**: Slightly slower, try period 7-8, volume 1.2
- **YM (Dow)**: Lower volatility, reduce bandwidth to 1.5-2
- **RTY (Russell)**: Higher volatility, increase bandwidth to 3-4
**Risk Management:**
- Never risk more than 2-3% of account per trade
- Use contract quantity calculator: Max Risk $ ÷ (Stop Distance × Point Value)
- Start with 1 contract while learning the system
- Backtest your specific timeframe and instrument before live trading
**Optimization Tips:**
- Increase pivot period (7-10) for fewer but higher-quality signals
- Raise volume multiplier (1.5-2.0) in choppy markets
- Lower target/stop multipliers (5-6x) for tighter profit taking
- Use trailing stops in strong trending conditions
- Disable session filter for overnight gaps and Asia session moves
## TECHNICAL DETAILS
**Key Calculations:**
- Pivot Detection: `ta.pivothigh(high, period, period/2)` and `ta.pivotlow(low, period, period/2)`
- Slope Calculation: `(newPivot - oldPivot) / (newTime - oldTime)`
- Adaptive Band: `min(ATR(14) * 0.2, close * 0.002) * multiplier / 2`
- Breakout Confirmation: Price crosses trendline + 10% of band threshold
**Data Requirements:**
- Minimum bars in view: 500 for proper pivot calculation
- Volume data required for volume filter accuracy
- Intraday timeframes recommended (1min - 15min) for scalping
- Works on any timeframe but optimized for fast execution
**Performance Metrics:**
All statistics calculate based on indicator signals:
- Tracks every signal as a trade from entry to TP/SL
- P&L in actual contract dollar values
- Win rate = (Winning trades / Total trades) × 100
- Profit factor = Gross profit / Gross loss
- Separates long/short performance for bias analysis
## IDEAL FOR
- Futures scalpers and day traders
- Traders who prefer visual trendline breakouts
- Those wanting automated TP/SL placement
- Traders tracking performance in dollar terms
- Multiple timeframe analysis (compare 1min vs 5min signals)
## NOT SUITABLE FOR
- Swing trading (targets too close)
- Stocks/forex without modifying point values
- Extremely low timeframes (<30 seconds) - too much noise
- Markets without volume data if using volume filter
- Illiquid contracts (signals may not execute at shown prices)
---
**Settings Summary:**
- Core: Period, bandwidth, extension, trendline style
- Filters: Volume, RTH session, ATR volatility
- Risk: R:R ratio, target/stop multipliers, trailing stop
- Display: Stats table position, size, colors
- Stats: Timeframe selection (all-time to custom days)
**License:** This indicator is published open-source under Mozilla Public License 2.0. You may use and modify the code with proper attribution.
**Disclaimer:** This indicator is for educational purposes. Past performance does not guarantee future results. Always practice proper risk management and test thoroughly before live trading.
---
## CREDITS & ATTRIBUTION
This script builds upon the "Trendline Breakouts With Targets" concept by ChartPrime with significant enhancements:
**Major Improvements Added:**
- **Futures-Specific Calculations**: Automated dollar P&L conversion using actual contract point values (NQ=$20, ES=$50, YM=$5, RTY=$50)
- **Advanced Statistics Engine**: Comprehensive performance tracking with customizable timeframe analysis (today, week, month, custom ranges)
- **Multi-Layer Filtering System**: Volume confirmation, RTH session filter, and ATR volatility filter to reduce false signals
- **Professional Trade Management**: Enhanced visual trade tracking with separate TP/SL lines, dollar value labels, and optional trailing stops
- **Optimized for Scalping**: Faster pivot periods (5 vs 10), tighter bands, and reduced extension bars for quick entries
Original trendline detection methodology by ChartPrime - used with modification under Mozilla Public License 2.0.

CISD & OB [BLAZ]Version 1.0 – Published October 2025: Initial release
1. Overview & Purpose
The CISD & OB indicator identifies and plots Order Blocks (OB) and Changes in State of Delivery (CISD) on price charts using a strict rule-based approach designed to highlight structural turning points and continuation zones in price action. It automatically detects these formations when price creates confirmed swing highs or lows, followed by opposing directional moves that break predefined structural levels.
Detection logic is consistently applied across all market conditions, allowing the indicator to identify areas where notable price reactions or liquidity shifts have occurred. These levels are plotted as horizontal lines on the chart and are updated in real time to reflect the latest structural developments, helping traders visualise potential reversal or continuation zones.
The methodology used in this indicator represents the author's specific approach to Order Block and CISD identification, incorporating custom criteria for swing validation and confirmation logic that differ from standard implementations. Detection operates entirely mechanically, without discretionary intervention, to ensure consistency and objectivity across use cases. This indicator functions on all standard timeframes and supports multiple asset classes, including Forex, Stocks, Cryptocurrencies, Futures, and Commodities.
The indicator is unique in its ability to apply detection logic to a custom timeframe, enabling multi-timeframe structural analysis without switching charts. Let’s begin by explaining key terminologies based on the author’s perception to aid in understanding the functionality of the indicator.
2. Order Block (OB)
An Order Block is identified when price creates a swing high or swing low followed by a directional move that closes beyond the open of the opposing candle(s) structure.
2.1. For bearish Order Blocks:
Price must form a confirmed swing high (higher than surrounding candles).
A subsequent bearish candle must close below the open of the bullish candle(s) that created the swing high.
2.2. For bullish Order Blocks:
Price must form a confirmed swing low (lower than surrounding candles).
A subsequent bullish candle must close above the open of the bearish candle(s) that created the swing low.
The indicator only validates Order Blocks where the structural formation meets minimum swing criteria and the confirming move demonstrates sufficient momentum beyond the identified level.
3. Change in State of Delivery (CISD)
A CISD occurs when a valid Order Block forms in the opposite direction to the previously confirmed Order Block, indicating a potential shift in market structure.
3.1. Formation criteria:
A bullish CISD forms when a valid bullish Order Block is detected after the most recent confirmed structure was a bearish Order Block.
A bearish CISD forms when a valid bearish Order Block is detected after the most recent confirmed structure was a bullish Order Block.
Each CISD represents the first opposing Order Block in a sequence, distinguishing it from continuation Order Blocks that follow in the same direction.
The indicator tracks the sequence of Order Block formations to automatically classify each new structure as either a CISD (directional change) or continuation Order Block based on the preceding confirmed structure.
4. Detection Logic & Visual Management
The indicator continuously scans price action in real time, validating only those patterns that meet predefined technical thresholds. Once a structure is confirmed, it is plotted as a horizontal line extending from the origin candle’s open to the confirming close.
To maintain chart clarity, the script integrates automatic display management, limiting the number of plotted lines according to user-defined settings. Independent styling options are available for bullish and bearish structures, including colour, width, and line thickness. CISD and OB structures are styled separately to provide a clear distinction between reversal and continuation events.
Developing structures appear as dotted potential horizontal lines until they are validated, at which point they transition to solid lines. The indicator also allows users to restrict visibility of plotted lines above a selected timeframe, ensuring that higher timeframe charts remain clean and readable.
If configuration settings conflict, such as incompatible timeframe or visibility filters, the indicator displays on-chart warning messages to guide users in adjusting their setup appropriately.
The indicator supports multi-timeframe plotting capability, allowing structures identified on higher timeframes to be visualised directly on the active lower timeframe chart. This feature allows traders to observe how market structures align across multiple timeframes, providing greater confirmation of overall trend direction, reinforcing analytical confidence through cross‑timeframe confluence, and ensuring short‑term decisions remain aligned with the prevailing market context.
Traders can configure alerts to receive notifications when new CISD or OB structures are confirmed. Alerts are fully customisable via the indicator input settings and can be defined by direction (bullish/bearish) and pattern type (OB or CISD).
5. Usage Instructions
5.1. Alert Setup:
Enable "Set Alert?" toggle in indicator settings.
Configure alert preferences for specific pattern types.
On the chart, click the three dots menu beside the indicator's name or press Alt + A.
Select "Add Alert" and click “Create” to activate the alert.
Alerts trigger when new patterns are confirmed.
5.2. Display Controls:
Use "Bullish Lines" and "Bearish Lines" toggles to show/hide patterns by direction.
Adjust line quantity settings (1-25) to control how many patterns display simultaneously.
Enable “Timeframe” to apply detection logic to a higher timeframe of choice, displaying CISD and OB patterns directly on the active chart.
5.3. Visibility Filter:
Use “Show below” to limit indicator visibility to specific timeframes. When enabled, the indicator hides automatically on any timeframe equal to or higher than the selected setting.
5.4. Appearance Customisation:
Toggle “CISD” or “OB” on/off to show or hide individual pattern types.
Modify colours and line widths independently for bullish and bearish structures.
The “Show potential line” option displays developing patterns as dotted horizontal lines until confirmed.
5.5. Warning Message:
Enable “Show warning messages” to display on‑chart guidance for conflicting or invalid configurations.
Choose the preferred message box position and colour styling for readability.
6. Protected Logic & Original Design
This indicator has been developed from the ground up using proprietary algorithms and a custom structural classification logic derived from original research into Order Block and CISD identification methods. The internal mechanics, including real-time pre-confirmation logic, multi-timeframe adaptation, directional classification sequencing, and automated display management, are not based on any publicly available script or third-party resource.
7. Disclaimer
This indicator is provided for educational and analytical purposes only. It does not constitute financial advice, investment recommendations, or trading signals. All trading and investment decisions remain solely the responsibility of the user.
Trading financial instruments involves substantial risk of loss. Past performance of any trading methodology or indicator does not guarantee future results. Users should conduct their own research and consider consulting with qualified financial professionals before making trading decisions.
The indicator's pattern detection is based on technical analysis principles and should be used as part of a comprehensive trading approach. No trading tool can guarantee profitable outcomes or eliminate market risk.
By using this indicator, users acknowledge they understand these risks and accept full responsibility for their trading decisions and outcomes.

Futures Day Trading Key Levels by Dhawal Ranka
Hey everyone, thank you for using this script, let me know in the comments how you feel about it!
What this script does:
This indicator renders one consolidated map of intraday reference levels for futures (e.g., ES, NQ, GC, CL). It is session-aware and draws:
- Previous ETH day High/Low/Close
- Previous RTH High/Low/Close (built from your RTH session)
- Today’s developing RTH High/Low and Mid
- Overnight (ON) session High/Low
- Opening Range (first N minutes of RTH): OR High/Low
- VWAP (day-anchored) with optional ±σ bands
- Floor Pivots (PP/R1/S1/R2/S2) from prior ETH daily bar
- ADR projections (Up/Down) using a configurable lookback and anchor
- Settlement: prior official settlement and today’s projected settle (with manual override)
- Weekly/Monthly context: prior W/M High/Low/Close and current W/M Open
- Minimal right-edge text tags (instead of big boxes) that sit on the price scale line and auto-pack when levels coincide
All lines extend across the chart to make confluence obvious without clutter.
How it works (methods & calculations)
Sessions
The script exposes two user sessions and a time zone:
RTH (e.g., 09:30–16:00 America/New_York)
ON (e.g., 18:00–09:29 America/New_York)
Session membership is computed with time(timeframe, session, tz) != 0.
RTH H/L/C (prev) are aggregated intrabar: on RTH start we seed H/L; while inRTH we update; on RTH end we store the close.
Previous Day (ETH) levels
request.security(syminfo.tickerid, "D", high /low /close ) supplies PDH/PDL/PDC on the continuous ETH daily.
Opening Range
On RTH start we mark orStartTime.
While RTH is active and elapsed time < N minutes, we track the running high/low.
When elapsed ≥ N minutes, we freeze OR High/Low.
VWAP & ±σ bands (intraday)
Day-anchored VWAP uses ta.vwap(hlc3).
Bands: standard deviation of (close − vwap) from day start, accumulated inline:
stdev = sqrt( mean(dev^2) − mean(dev)^2 )
Bands = vwap ± k * stdev (user multiplier).
Floor Pivots (classic)
Using prior ETH daily H/L/C:
PP = (H + L + C) / 3
R1 = 2*PP − L, S1 = 2*PP − H
R2 = PP + (H − L), S2 = PP − (H − L).
ADR projections
Daily range series rng = request.security(..., "D", high - low).
ADR = SMA(rng, L) (default L=14).
Anchor is user-selectable: today’s open or yesterday’s close.
Projections: ADR Up = anchor + ADR/2, ADR Down = anchor − ADR/2.
Settlement
Prev Settle defaults to prior ETH daily close but can be overridden manually for markets where official settlement differs from feed close.
Today Projected Settle uses the current ETH daily close value.
Weekly / Monthly context
Prior W/M H/L/C from "W"/"M" with , plus current W/M Open.
Rendering & label logic (originality)
Lines are persistent: each named level owns one line object that is updated, not re-created—keeps resource use low and avoids “too many plots”.
Right-edge labels are text-only (no box) placed at x = bar_index + offset and yloc.price.
When multiple levels share (almost) the same price, labels are packed side-by-side using a small bucketing algorithm:
Prices are bucketed within ±½ tick.
Each label gets a position index inside its bucket; the final x-offset = baseOffset + index*step + priority.
Priorities nudge important tags (e.g., Settle/RTH levels) closer to the price scale so they remain readable.
Why this is published & what’s original
It’s not a simple mashup: the script’s utility is the session-aware aggregation, the OR timing logic, the intraday σ calculation around VWAP, the line-persistence manager, and the label packing with priorities that keeps the right edge readable even when many levels coincide.
The closed-source protection covers the packing/priority scheme and the persistent object management that make it practical on busy futures charts without hitting Pine limits.
How to use
Set your sessions & time zone
Choose RTH/ON session windows (the defaults match CME equity index futures) and the time zone of your charting workflow.
Toggle components
Enable only the layers you need (e.g., VWAP bands off if you want a cleaner chart).
Opening Range length (minutes) is adjustable.
Settlement
If your broker/feed’s daily close isn’t the official settlement, enter a manual settle value for the prior day.
Read the right edge
Labels sit on the price scale line. When two labels share the same price, they appear side-by-side rather than overlapping.
Timeframes & symbols
Designed for intraday futures on 1–30m. Works on other symbols/timeframes but intent is day trading.
Inputs (summary)
Sessions/TZ: RTH window, ON window, time zone
Today: RTH H/L/Mid, ON H/L, OR (minutes)
VWAP: on/off, ±σ bands, multiplier
Pivots: PP/R1/S1/R2/S2 (ETH)
ADR: lookback, anchor (open vs. prev close)
Settlement: show prev/proj, manual override
Weekly/Monthly: prior H/L/C + current open
Style: line transparency; right-edge tag size, base offset, and step; optional inline labels
Limitations & notes
“Prev Settle” equals the prior daily close unless overridden.
Session definitions matter: if your exchange hours differ, set your own RTH/ON windows.
No alerts are included to minimize plot count and keep performance high (you can add alert conditions on any level in a private copy).
Disclaimer
For educational purposes only; not financial advice. Futures trading involves significant risk.
Versioning
This script will be maintained under a single publication using Update (no minor forks). Major changes will be documented in the Change Log section of the script description.

RTH & ETH High/Low (Today & Prev)RTH and ETH High Low Indicator. This draws a line for the ETH and RTH highs and lows for todays session and yesterdays session. it allows you to toggle off any of the 8 potential levels as well as change the colour of the 8 levels. WIP

BOCS Channel Scalper Indicator - Mean Reversion Alert System# BOCS Channel Scalper Indicator - Mean Reversion Alert System
## WHAT THIS INDICATOR DOES:
This is a mean reversion trading indicator that identifies consolidation channels through volatility analysis and generates alert signals when price enters entry zones near channel boundaries. **This indicator version is designed for manual trading with comprehensive alert functionality.** Unlike automated strategies, this tool sends notifications (via popup, email, SMS, or webhook) when trading opportunities occur, allowing you to manually review and execute trades. The system assumes price will revert to the channel mean, identifying scalp opportunities as price reaches extremes and preparing to bounce back toward center.
## INDICATOR VS STRATEGY - KEY DISTINCTION:
**This is an INDICATOR with alerts, not an automated strategy.** It does not execute trades automatically. Instead, it:
- Displays visual signals on your chart when entry conditions are met
- Sends customizable alerts to your device/email when opportunities arise
- Shows TP/SL levels for reference but does not place orders
- Requires you to manually enter and exit positions based on signals
- Works with all TradingView subscription levels (alerts included on all plans)
**For automated trading with backtesting**, use the strategy version. For manual control with notifications, use this indicator version.
## ALERT CAPABILITIES:
This indicator includes four distinct alert conditions that can be configured independently:
**1. New Channel Formation Alert**
- Triggers when a fresh BOCS channel is identified
- Message: "New BOCS channel formed - potential scalp setup ready"
- Use this to prepare for upcoming trading opportunities
**2. Long Scalp Entry Alert**
- Fires when price touches the long entry zone
- Message includes current price, calculated TP, and SL levels
- Notification example: "LONG scalp signal at 24731.75 | TP: 24743.2 | SL: 24716.5"
**3. Short Scalp Entry Alert**
- Fires when price touches the short entry zone
- Message includes current price, calculated TP, and SL levels
- Notification example: "SHORT scalp signal at 24747.50 | TP: 24735.0 | SL: 24762.75"
**4. Any Entry Signal Alert**
- Combined alert for both long and short entries
- Use this if you want a single alert stream for all opportunities
- Message: "BOCS Scalp Entry: at "
**Setting Up Alerts:**
1. Add indicator to chart and configure settings
2. Click the Alert (⏰) button in TradingView toolbar
3. Select "BOCS Channel Scalper" from condition dropdown
4. Choose desired alert type (Long, Short, Any, or Channel Formation)
5. Set "Once Per Bar Close" to avoid false signals during bar formation
6. Configure delivery method (popup, email, webhook for automation platforms)
7. Save alert - it will fire automatically when conditions are met
**Alert Message Placeholders:**
Alerts use TradingView's dynamic placeholder system:
- {{ticker}} = Symbol name (e.g., NQ1!)
- {{close}} = Current price at signal
- {{plot_1}} = Calculated take profit level
- {{plot_2}} = Calculated stop loss level
These placeholders populate automatically, creating detailed notification messages without manual configuration.
## KEY DIFFERENCE FROM ORIGINAL BOCS:
**This indicator is designed for traders seeking higher trade frequency.** The original BOCS indicator trades breakouts OUTSIDE channels, waiting for price to escape consolidation before entering. This scalper version trades mean reversion INSIDE channels, entering when price reaches channel extremes and betting on a bounce back to center. The result is significantly more trading opportunities:
- **Original BOCS**: 1-3 signals per channel (only on breakout)
- **Scalper Indicator**: 5-15+ signals per channel (every touch of entry zones)
- **Trade Style**: Mean reversion vs trend following
- **Hold Time**: Seconds to minutes vs minutes to hours
- **Best Markets**: Ranging/choppy conditions vs trending breakouts
This makes the indicator ideal for active day traders who want continuous alert opportunities within consolidation zones rather than waiting for breakout confirmation. However, increased signal frequency also means higher potential commission costs and requires disciplined trade selection when acting on alerts.
## TECHNICAL METHODOLOGY:
### Price Normalization Process:
The indicator normalizes price data to create consistent volatility measurements across different instruments and price levels. It calculates the highest high and lowest low over a user-defined lookback period (default 100 bars). Current close price is normalized using: (close - lowest_low) / (highest_high - lowest_low), producing values between 0 and 1 for standardized volatility analysis.
### Volatility Detection:
A 14-period standard deviation is applied to the normalized price series to measure price deviation from the mean. Higher standard deviation values indicate volatility expansion; lower values indicate consolidation. The indicator uses ta.highestbars() and ta.lowestbars() to identify when volatility peaks and troughs occur over the detection period (default 14 bars).
### Channel Formation Logic:
When volatility crosses from a high level to a low level (ta.crossover(upper, lower)), a consolidation phase begins. The indicator tracks the highest and lowest prices during this period, which become the channel boundaries. Minimum duration of 10+ bars is required to filter out brief volatility spikes. Channels are rendered as box objects with defined upper and lower boundaries, with colored zones indicating entry areas.
### Entry Signal Generation:
The indicator uses immediate touch-based entry logic. Entry zones are defined as a percentage from channel edges (default 20%):
- **Long Entry Zone**: Bottom 20% of channel (bottomBound + channelRange × 0.2)
- **Short Entry Zone**: Top 20% of channel (topBound - channelRange × 0.2)
Long signals trigger when candle low touches or enters the long entry zone. Short signals trigger when candle high touches or enters the short entry zone. Visual markers (arrows and labels) appear on chart, and configured alerts fire immediately.
### Cooldown Filter:
An optional cooldown period (measured in bars) prevents alert spam by enforcing minimum spacing between consecutive signals. If cooldown is set to 3 bars, no new long alert will fire until 3 bars after the previous long signal. Long and short cooldowns are tracked independently, allowing both directions to signal within the same period.
### ATR Volatility Filter:
The indicator includes a multi-timeframe ATR filter to avoid alerts during low-volatility conditions. Using request.security(), it fetches ATR values from a specified timeframe (e.g., 1-minute ATR while viewing 5-minute charts). The filter compares current ATR to a user-defined minimum threshold:
- If ATR ≥ threshold: Alerts enabled
- If ATR < threshold: No alerts fire
This prevents notifications during dead zones where mean reversion is unreliable due to insufficient price movement. The ATR status is displayed in the info table with visual confirmation (✓ or ✗).
### Take Profit Calculation:
Two TP methods are available:
**Fixed Points Mode**:
- Long TP = Entry + (TP_Ticks × syminfo.mintick)
- Short TP = Entry - (TP_Ticks × syminfo.mintick)
**Channel Percentage Mode**:
- Long TP = Entry + (ChannelRange × TP_Percent)
- Short TP = Entry - (ChannelRange × TP_Percent)
Default 50% targets the channel midline, a natural mean reversion target. These levels are displayed as visual lines with labels and included in alert messages for reference when manually placing orders.
### Stop Loss Placement:
Stop losses are calculated just outside the channel boundary by a user-defined tick offset:
- Long SL = ChannelBottom - (SL_Offset_Ticks × syminfo.mintick)
- Short SL = ChannelTop + (SL_Offset_Ticks × syminfo.mintick)
This logic assumes channel breaks invalidate the mean reversion thesis. SL levels are displayed on chart and included in alert notifications as suggested stop placement.
### Channel Breakout Management:
Channels are removed when price closes more than 10 ticks outside boundaries. This tolerance prevents premature channel deletion from minor breaks or wicks, allowing the mean reversion setup to persist through small boundary violations.
## INPUT PARAMETERS:
### Channel Settings:
- **Nested Channels**: Allow multiple overlapping channels vs single channel
- **Normalization Length**: Lookback for high/low calculation (1-500, default 100)
- **Box Detection Length**: Period for volatility detection (1-100, default 14)
### Scalping Settings:
- **Enable Long Scalps**: Toggle long alert generation on/off
- **Enable Short Scalps**: Toggle short alert generation on/off
- **Entry Zone % from Edge**: Size of entry zone (5-50%, default 20%)
- **SL Offset (Ticks)**: Distance beyond channel for stop (1+, default 5)
- **Cooldown Period (Bars)**: Minimum spacing between alerts (0 = no cooldown)
### ATR Filter:
- **Enable ATR Filter**: Toggle volatility filter on/off
- **ATR Timeframe**: Source timeframe for ATR (1, 5, 15, 60 min, etc.)
- **ATR Length**: Smoothing period (1-100, default 14)
- **Min ATR Value**: Threshold for alert enablement (0.1+, default 10.0)
### Take Profit Settings:
- **TP Method**: Choose Fixed Points or % of Channel
- **TP Fixed (Ticks)**: Static distance in ticks (1+, default 30)
- **TP % of Channel**: Dynamic target as channel percentage (10-100%, default 50%)
### Appearance:
- **Show Entry Zones**: Toggle zone labels on channels
- **Show Info Table**: Display real-time indicator status
- **Table Position**: Corner placement (Top Left/Right, Bottom Left/Right)
- **Long Color**: Customize long signal color (default: darker green for readability)
- **Short Color**: Customize short signal color (default: red)
- **TP/SL Colors**: Customize take profit and stop loss line colors
- **Line Length**: Visual length of TP/SL reference lines (5-200 bars)
## VISUAL INDICATORS:
- **Channel boxes** with semi-transparent fill showing consolidation zones
- **Colored entry zones** labeled "LONG ZONE ▲" and "SHORT ZONE ▼"
- **Entry signal arrows** below/above bars marking long/short alerts
- **TP/SL reference lines** with emoji labels (⊕ Entry, 🎯 TP, 🛑 SL)
- **Info table** showing channel status, last signal, entry/TP/SL prices, risk/reward ratio, and ATR filter status
- **Visual confirmation** when alerts fire via on-chart markers synchronized with notifications
## HOW TO USE:
### For 1-3 Minute Scalping with Alerts (NQ/ES):
- ATR Timeframe: "1" (1-minute)
- ATR Min Value: 10.0 (for NQ), adjust per instrument
- Entry Zone %: 20-25%
- TP Method: Fixed Points, 20-40 ticks
- SL Offset: 5-10 ticks
- Cooldown: 2-3 bars to reduce alert spam
- **Alert Setup**: Configure "Any Entry Signal" for combined long/short notifications
- **Execution**: When alert fires, verify chart visuals, then manually place limit order at entry zone with provided TP/SL levels
### For 5-15 Minute Day Trading with Alerts:
- ATR Timeframe: "5" or match chart
- ATR Min Value: Adjust to instrument (test 8-15 for NQ)
- Entry Zone %: 20-30%
- TP Method: % of Channel, 40-60%
- SL Offset: 5-10 ticks
- Cooldown: 3-5 bars
- **Alert Setup**: Configure separate "Long Scalp Entry" and "Short Scalp Entry" alerts if you trade directionally based on bias
- **Execution**: Review channel structure on alert, confirm ATR filter shows ✓, then enter manually
### For 30-60 Minute Swing Scalping with Alerts:
- ATR Timeframe: "15" or "30"
- ATR Min Value: Lower threshold for broader market
- Entry Zone %: 25-35%
- TP Method: % of Channel, 50-70%
- SL Offset: 10-15 ticks
- Cooldown: 5+ bars or disable
- **Alert Setup**: Use "New Channel Formation" to prepare for setups, then "Any Entry Signal" for execution alerts
- **Execution**: Larger timeframes allow more analysis time between alert and entry
### Webhook Integration for Semi-Automation:
- Configure alert webhook URL to connect with platforms like TradersPost, TradingView Paper Trading, or custom automation
- Alert message includes all necessary order parameters (direction, entry, TP, SL)
- Webhook receives structured data when signal fires
- External platform can auto-execute based on alert payload
- Still maintains manual oversight vs full strategy automation
## USAGE CONSIDERATIONS:
- **Manual Discipline Required**: Alerts provide opportunities but execution requires judgment. Not all alerts should be taken - consider market context, trend, and channel quality
- **Alert Timing**: Alerts fire on bar close by default. Ensure "Once Per Bar Close" is selected to avoid false signals during bar formation
- **Notification Delivery**: Mobile/email alerts may have 1-3 second delay. For immediate execution, use desktop popups or webhook automation
- **Cooldown Necessity**: Without cooldown, rapidly touching price action can generate excessive alerts. Start with 3-bar cooldown and adjust based on alert volume
- **ATR Filter Impact**: Enabling ATR filter dramatically reduces alert count but improves quality. Track filter status in info table to understand when you're receiving fewer alerts
- **Commission Awareness**: High alert frequency means high potential trade count. Calculate if your commission structure supports frequent scalping before acting on all alerts
## COMPATIBLE MARKETS:
Works on any instrument with price data including stock indices (NQ, ES, YM, RTY), individual stocks, forex pairs (EUR/USD, GBP/USD), cryptocurrency (BTC, ETH), and commodities. Volume-based features are not included in this indicator version. Multi-timeframe ATR requires higher-tier TradingView subscription for request.security() functionality on timeframes below chart timeframe.
## KNOWN LIMITATIONS:
- **Indicator does not execute trades** - alerts are informational only; you must manually place all orders
- **Alert delivery depends on TradingView infrastructure** - delays or failures possible during platform issues
- **No position tracking** - indicator doesn't know if you're in a trade; you must manage open positions independently
- **TP/SL levels are reference only** - you must manually set these on your broker platform; they are not live orders
- **Immediate touch entry can generate many alerts** in choppy zones without adequate cooldown
- **Channel deletion at 10-tick breaks** may be too aggressive or lenient depending on instrument tick size
- **ATR filter from lower timeframes** requires TradingView Premium/Pro+ for request.security()
- **Mean reversion logic fails** in strong breakout scenarios - alerts will fire but trades may hit stops
- **No partial closing capability** - full position management is manual; you determine scaling out
- **Alerts do not account for gaps** or overnight price changes; morning alerts may be stale
## RISK DISCLOSURE:
Trading involves substantial risk of loss. This indicator provides signals for educational and informational purposes only and does not constitute financial advice. Past performance does not guarantee future results. Mean reversion strategies can experience extended drawdowns during trending markets. Alerts are not guaranteed to be profitable and should be combined with your own analysis. Stop losses may not fill at intended levels during extreme volatility or gaps. Never trade with capital you cannot afford to lose. Consider consulting a licensed financial advisor before making trading decisions. Always verify alerts against current market conditions before executing trades manually.
## ACKNOWLEDGMENT & CREDITS:
This indicator is built upon the channel detection methodology created by **AlgoAlpha** in the "Smart Money Breakout Channels" indicator. Full credit and appreciation to AlgoAlpha for pioneering the normalized volatility approach to identifying consolidation patterns. The core channel formation logic using normalized price standard deviation is AlgoAlpha's original contribution to the TradingView community.
Enhancements to the original concept include: mean reversion entry logic (vs breakout), immediate touch-based alert generation, comprehensive alert condition system with customizable notifications, multi-timeframe ATR volatility filtering, cooldown period for alert management, dual TP methods (fixed points vs channel percentage), visual TP/SL reference lines, and real-time status monitoring table. This indicator version is specifically designed for manual traders who prefer alert-based decision making over automated execution.

BOCS AdaptiveBOCS Adaptive Strategy - Automated Volatility Breakout System
WHAT THIS STRATEGY DOES:
This is an automated trading strategy that detects consolidation patterns through volatility analysis and executes trades when price breaks out of these channels. Take-profit and stop-loss levels are calculated dynamically using Average True Range (ATR) to adapt to current market volatility. The strategy closes positions partially at the first profit target and exits the remainder at the second target or stop loss.
TECHNICAL METHODOLOGY:
Price Normalization Process:
The strategy begins by normalizing price to create a consistent measurement scale. It calculates the highest high and lowest low over a user-defined lookback period (default 100 bars). The current close price is then normalized using the formula: (close - lowest_low) / (highest_high - lowest_low). This produces values between 0 and 1, allowing volatility analysis to work consistently across different instruments and price levels.
Volatility Detection:
A 14-period standard deviation is applied to the normalized price series. Standard deviation measures how much prices deviate from their average - higher values indicate volatility expansion, lower values indicate consolidation. The strategy uses ta.highestbars() and ta.lowestbars() functions to track when volatility reaches peaks and troughs over the detection length period (default 14 bars).
Channel Formation Logic:
When volatility crosses from a high level to a low level, this signals the beginning of a consolidation phase. The strategy records this moment using ta.crossover(upper, lower) and begins tracking the highest and lowest prices during the consolidation. These become the channel boundaries. The duration between the crossover and current bar must exceed 10 bars minimum to avoid false channels from brief volatility spikes. Channels are drawn using box objects with the recorded high/low boundaries.
Breakout Signal Generation:
Two detection modes are available:
Strong Closes Mode (default): Breakout occurs when the candle body midpoint math.avg(close, open) exceeds the channel boundary. This filters out wick-only breaks.
Any Touch Mode: Breakout occurs when the close price exceeds the boundary.
When price closes above the upper channel boundary, a bullish breakout signal generates. When price closes below the lower boundary, a bearish breakout signal generates. The channel is then removed from the chart.
ATR-Based Risk Management:
The strategy uses request.security() to fetch ATR values from a specified timeframe, which can differ from the chart timeframe. For example, on a 5-minute chart, you can use 1-minute ATR for more responsive calculations. The ATR is calculated using ta.atr(length) with a user-defined period (default 14).
Exit levels are calculated at the moment of breakout:
Long Entry Price = Upper channel boundary
Long TP1 = Entry + (ATR × TP1 Multiplier)
Long TP2 = Entry + (ATR × TP2 Multiplier)
Long SL = Entry - (ATR × SL Multiplier)
For short trades, the calculation inverts:
Short Entry Price = Lower channel boundary
Short TP1 = Entry - (ATR × TP1 Multiplier)
Short TP2 = Entry - (ATR × TP2 Multiplier)
Short SL = Entry + (ATR × SL Multiplier)
Trade Execution Logic:
When a breakout occurs, the strategy checks if trading hours filter is satisfied (if enabled) and if position size equals zero (no existing position). If volume confirmation is enabled, it also verifies that current volume exceeds 1.2 times the 20-period simple moving average.
If all conditions are met:
strategy.entry() opens a position using the user-defined number of contracts
strategy.exit() immediately places a stop loss order
The code monitors price against TP1 and TP2 levels on each bar
When price reaches TP1, strategy.close() closes the specified number of contracts (e.g., if you enter with 3 contracts and set TP1 close to 1, it closes 1 contract). When price reaches TP2, it closes all remaining contracts. If stop loss is hit first, the entire position exits via the strategy.exit() order.
Volume Analysis System:
The strategy uses ta.requestUpAndDownVolume(timeframe) to fetch up volume, down volume, and volume delta from a specified timeframe. Three display modes are available:
Volume Mode: Shows total volume as bars scaled relative to the 20-period average
Comparison Mode: Shows up volume and down volume as separate bars above/below the channel midline
Delta Mode: Shows net volume delta (up volume - down volume) as bars, positive values above midline, negative below
The volume confirmation logic compares breakout bar volume to the 20-period SMA. If volume ÷ average > 1.2, the breakout is classified as "confirmed." When volume confirmation is enabled in settings, only confirmed breakouts generate trades.
INPUT PARAMETERS:
Strategy Settings:
Number of Contracts: Fixed quantity to trade per signal (1-1000)
Require Volume Confirmation: Toggle to only trade signals with volume >120% of average
TP1 Close Contracts: Exact number of contracts to close at first target (1-1000)
Use Trading Hours Filter: Toggle to restrict trading to specified session
Trading Hours: Session input in HHMM-HHMM format (e.g., "0930-1600")
Main Settings:
Normalization Length: Lookback bars for high/low calculation (1-500, default 100)
Box Detection Length: Period for volatility peak/trough detection (1-100, default 14)
Strong Closes Only: Toggle between body midpoint vs close price for breakout detection
Nested Channels: Allow multiple overlapping channels vs single channel at a time
ATR TP/SL Settings:
ATR Timeframe: Source timeframe for ATR calculation (1, 5, 15, 60, etc.)
ATR Length: Smoothing period for ATR (1-100, default 14)
Take Profit 1 Multiplier: Distance from entry as multiple of ATR (0.1-10.0, default 2.0)
Take Profit 2 Multiplier: Distance from entry as multiple of ATR (0.1-10.0, default 3.0)
Stop Loss Multiplier: Distance from entry as multiple of ATR (0.1-10.0, default 1.0)
Enable Take Profit 2: Toggle second profit target on/off
VISUAL INDICATORS:
Channel boxes with semi-transparent fill showing consolidation zones
Green/red colored zones at channel boundaries indicating breakout areas
Volume bars displayed within channels using selected mode
TP/SL lines with labels showing both price level and distance in points
Entry signals marked with up/down triangles at breakout price
Strategy status table showing position, contracts, P&L, ATR values, and volume confirmation status
HOW TO USE:
For 2-Minute Scalping:
Set ATR Timeframe to "1" (1-minute), ATR Length to 12, TP1 Multiplier to 2.0, TP2 Multiplier to 3.0, SL Multiplier to 1.5. Enable volume confirmation and strong closes only. Use trading hours filter to avoid low-volume periods.
For 5-15 Minute Day Trading:
Set ATR Timeframe to match chart or use 5-minute, ATR Length to 14, TP1 Multiplier to 2.0, TP2 Multiplier to 3.5, SL Multiplier to 1.2. Volume confirmation recommended but optional.
For Hourly+ Swing Trading:
Set ATR Timeframe to 15-30 minute, ATR Length to 14-21, TP1 Multiplier to 2.5, TP2 Multiplier to 4.0, SL Multiplier to 1.5. Volume confirmation optional, nested channels can be enabled for multiple setups.
BACKTEST CONSIDERATIONS:
Strategy performs best during trending or volatility expansion phases
Consolidation-heavy or choppy markets produce more false signals
Shorter timeframes require wider stop loss multipliers due to noise
Commission and slippage significantly impact performance on sub-5-minute charts
Volume confirmation generally improves win rate but reduces trade frequency
ATR multipliers should be optimized for specific instrument characteristics
COMPATIBLE MARKETS:
Works on any instrument with price and volume data including forex pairs, stock indices, individual stocks, cryptocurrency, commodities, and futures contracts. Requires TradingView data feed that includes volume for volume confirmation features to function.
KNOWN LIMITATIONS:
Stop losses execute via strategy.exit() and may not fill at exact levels during gaps or extreme volatility
request.security() on lower timeframes requires higher-tier TradingView subscription
False breakouts inherent to breakout strategies cannot be completely eliminated
Performance varies significantly based on market regime (trending vs ranging)
Partial closing logic requires sufficient position size relative to TP1 close contracts setting
RISK DISCLOSURE:
Trading involves substantial risk of loss. Past performance of this or any strategy does not guarantee future results. This strategy is provided for educational purposes and automated backtesting. Thoroughly test on historical data and paper trade before risking real capital. Market conditions change and strategies that worked historically may fail in the future. Use appropriate position sizing and never risk more than you can afford to lose. Consider consulting a licensed financial advisor before making trading decisions.
ACKNOWLEDGMENT & CREDITS:
This strategy is built upon the channel detection methodology created by AlgoAlpha in the "Smart Money Breakout Channels" indicator. Full credit and appreciation to AlgoAlpha for pioneering the normalized volatility approach to identifying consolidation patterns and sharing this innovative technique with the TradingView community. The enhancements added to the original concept include automated trade execution, multi-timeframe ATR-based risk management, partial position closing by contract count, volume confirmation filtering, and real-time position monitoring.

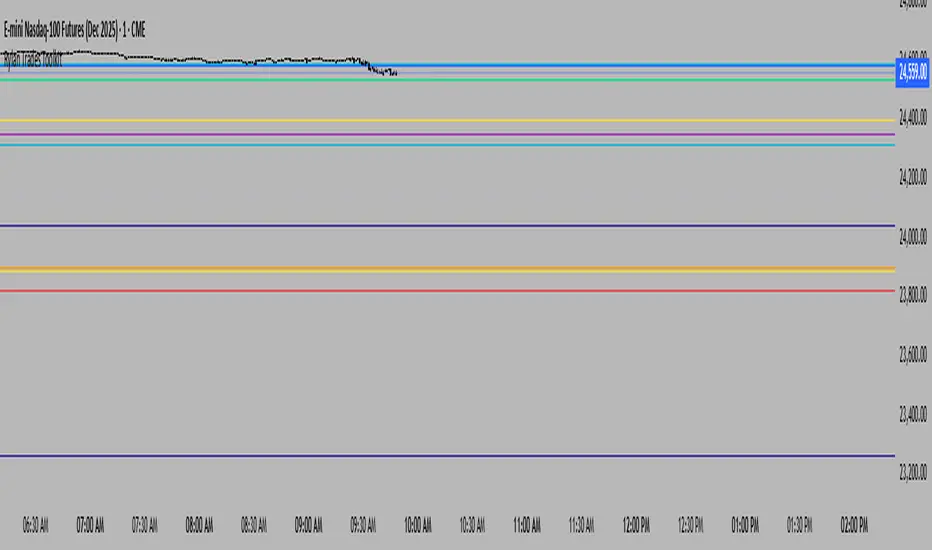
Rylan Trades ToolkitStay ahead of the market with this all-in-one levels indicator.
It automatically plots key opens (Midnight, Day Session, Week, Month, Quarter, Year, or custom time) plus previous Highs and Lows from multiple timeframes.
Customize your style, width, and extensions, while the indicator keeps charts clean by auto-replacing old lines as new periods begin.
Trade smarter, cut through the noise, and focus only on the levels that matter most.
FlowSpike ES — BB • RSI • VWAP + AVWAP + News MuteThis indicator is purpose-built for E-mini S&P 500 (ES) futures traders, combining volatility bands, momentum filters, and session-anchored levels into a streamlined tool for intraday execution.
Key Features:
• ES-Tuned Presets
Automatically optimized settings for scalping (1–2m), daytrading (5m), and swing trading (15–60m) timeframes.
• Bollinger Band & RSI Signals
Entry signals trigger only at statistically significant extremes, with RSI filters to reduce false moves.
• VWAP & Anchored VWAPs
Session VWAP plus anchored VWAPs (RTH open, weekly, monthly, and custom) provide high-confidence reference levels used by professional order-flow traders.
• Volatility Filter (ATR in ticks)
Ensures signals are only shown when the ES is moving enough to offer tradable edges.
• News-Time Mute
Suppresses signals around scheduled economic releases (customizable windows in ET), helping traders avoid whipsaw conditions.
• Clean Alerts
Long/short alerts are generated only when all conditions align, with optional bar-close confirmation.
Why It’s Tailored for ES Futures:
• Designed around ES tick size (0.25) and volatility structure.
• Session settings respect RTH hours (09:30–16:00 ET), the period where most liquidity and institutional flows concentrate.
• ATR thresholds and RSI bands are pre-tuned for ES market behavior, reducing the need for manual optimization.
⸻
This is not a generic indicator—it’s a futures-focused tool created to align with the way ES trades day after day. Whether you scalp the open, manage intraday swings, or align to weekly/monthly anchored flows, FlowSpike ES gives you a clear, rules-based signal framework.

Futures Playbook: VWAP + OR + Cross-Asset TellsFutures Playbook: VWAP + OR + Cross-Asset Tells (with Trade Messages + Coach Panel)
This all-in-one futures trading toolkit combines Opening Range (OR) levels, VWAP, and cross-asset signals to help traders quickly read intraday structure, manage execution, and filter noise.
Core Features
• Opening Range (OR):
• Customizable OR window with High/Low and Midpoint.
• Automatic shading of the OR zone.
• VWAP & Bands:
• Built-in or session-anchored VWAP.
• Optional standard deviation bands for context.
• Cross-Asset Tells:
• Live reads on US 10Y yield, DXY, Crude, and Gold.
• Regime detection: rates risk, USD strength, energy softness, and real-rate easing.
• Confirmations:
• Volume vs. moving average filter.
• Cumulative delta with smoothing.
• ATR-based chop filter to avoid low-quality trends.
Trade Messages + Coach Panel
• Trade Messages (labels): Automatic on-chart prompts for OR completion, VWAP reclaim/loss, long/short setups, and EU close flows.
• Coach Panel (table): Real-time dashboard with regime context, directional bias, execution notes, risk reminders, and key levels (ORH, ORL, VWAP).
Alerts
• OR breakout (long/short with confirmations).
• VWAP reclaim or loss.
• 10Y yield crossing risk threshold.
Use Case
Designed for futures traders and scalpers who rely on VWAP + OR dynamics and need cross-asset confirmation before committing to trades. Great for structuring entries, managing risk, and filtering market noise throughout the session.

NDX Ladder → Adjusted to Active Ticker (5s & 10s)This indicator allows you to a grid of NDX levels directly on the NQ! (E-mini NASDAQ 100 Futures) chart, automatically adjusting for the spread between NDX and NQ1!. This is particularly useful for traders who perform technical analysis on SPX but execute trades on NQ1!.
Features:
Renders every 5 and 10 points steps of the NDX in your current chart.
The script adjusts these levels in real-time based on the current spread between NDX and NQ / MNQ
Plots updated horizontal lines that move with the spread

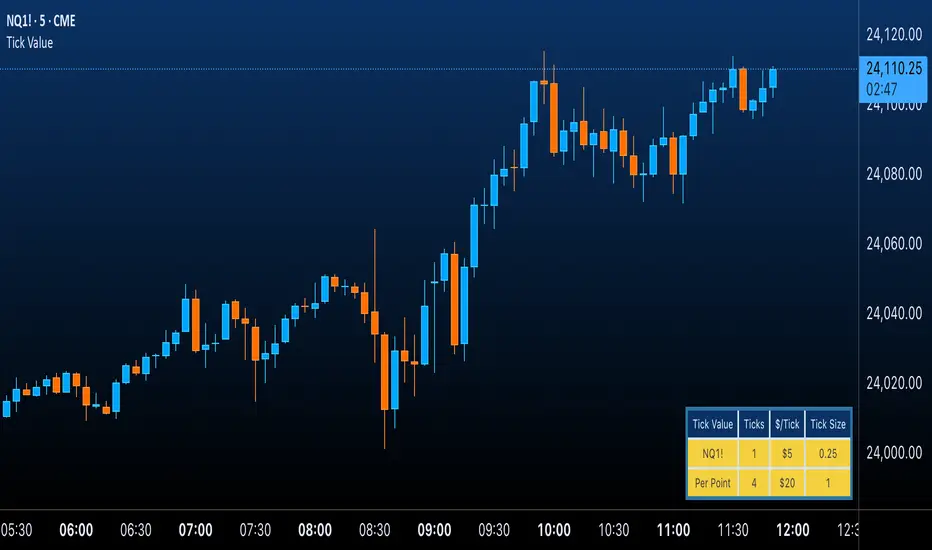
Futures Tick & Point Value [BoredYeti]Futures Tick & Point Value
This utility displays tick size, dollars per tick, and (optionally) a per-point row for the current futures contract.
Features
• Hardcoded $/tick map for common CME/NYMEX/CBOT/COMEX contracts
• Automatic fallback using pointvalue * mintick for any other symbol
• Table settings: adjustable position, text size, customizable colors
• Optional “Per Point” row showing ticks and $/point
Notes
• Contract specs can vary by broker/exchange and may change over time. Always confirm with official specifications.
• Educational tool only; not financial advice.
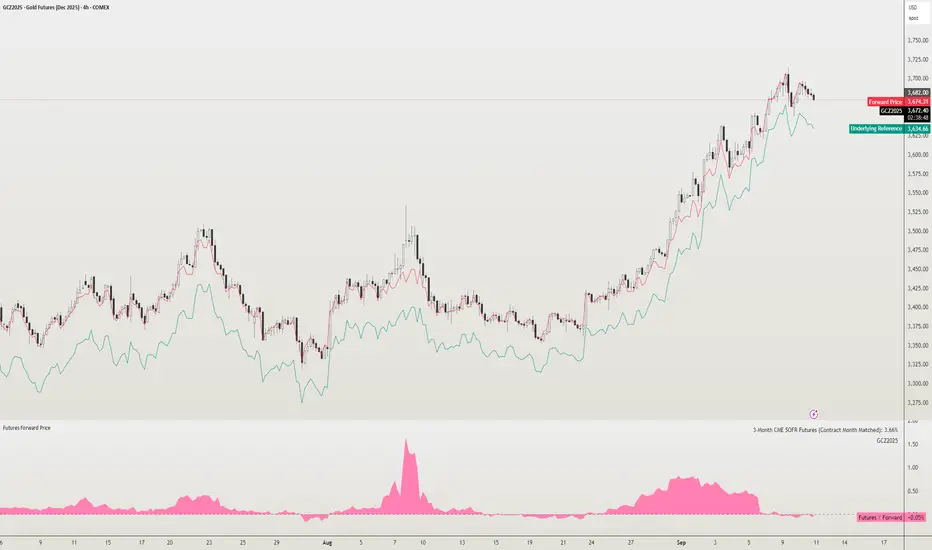
Futures Forward Price [NeoButane]In futures markets, the theoretical value of a futures contract can be derived from its underlying price and cost of carry. By baking in the costs and potential yields, the theoretical forward price then be used in basis against futures prices in place of the underlying spot price.
Usage
The script creates plots on the main chart and a separate window pane. Both are meant to be used to visualize dislocations in the market.
By using a futures vs. forward basis instead of futures vs. spot basis, discounts in the market are clearer.
Last month, the gold futures market GCZ2025 traded >1% above forward price when tariffs were announced and fell back in line once the tariffs were verbally retracted.
View roll spreads over a back-adjusted continuous chart. I guess. I don't think spread traders only look at one chart. This is as educational for me as it is you.
Configuration
The underlying reference needs to be changed to match the futures contract you are using.
The Risk-Free Rate defaults to FRED:SOFR. I found the contract month matched 3-Month SOFR Futures to be the closest for forward price.
Risk-Free Rate: The interest rate source for forward price.
Constant Risk-Free Rate: a static interest rate that can be used in advance of future changes in risk-free rate.
Underlying Reference: spot or index price. Some examples include TVC:SPX, TVC:GOLD, CRYPTO:BTCUSD, TVC:USOIL.
Forward Price Compounding: determines which formula to use. They're similar and become closer as the contract matures.
Alternative Contract: enable and select a futures contract to use it on a chart different than the main.
Storage Cost and Yield: for use with commodities. I haven't found a proper use for them yet but enabling is simple if you are able to.
The following are meant to be used with the continuous formula as they are compounded. However the rate sources don't differ much for the purpose of futures prices.
3-Month CME SOFR Futures
3-Month ICEEUR SONIA Futures
3-Month Osaka TONA Futures
The other rate sources are either meant for futures contracts shorter than quarterly such as monthly crypto futures or were meant to help myself understand how different rates would align with futures prices, like inflation.
What this script does
It uses the cost of carry formula to output the forward price (red line). The underlying reference (green line) is plotted alongside and a futures-derived reference (blue line) can be displayed to see how it looks next to the real reference price.
The data pane displays either the nominal difference or percentage difference between the real futures price and the calculated forward price.
Further reading
www.investopedia.com
www.cmegroup.com
www.oxfordenergy.org
www-2.rotman.utoronto.ca
www.cmegroup.com
3-month rate futures
www.cmegroup.com
www.ice.com
www.bankofengland.co.uk
www.jpx.co.jp
SPX Ladder → Adjusted to Active Ticker (5s & 10s)This indicator allows you to a grid of SPX levels directly on the ES1! (E-mini S&P 500 Futures) chart, automatically adjusting for the spread between SPX and ES1!. This is particularly useful for traders who perform technical analysis on SPX but execute trades on ES1!.
Features:
Renders every 5 and 10 points steps of the SPX in your current chart.
The script adjusts these levels in real-time based on the current spread between SPX and ES1!
Plots updated horizontal lines that move with the spread
Supports Multiple Tickers, ES1!, SPY and SPX500USD.
Ideal for futures traders who want SPX context while trading ES1!.

EMA + RSI Daily Bias Clarity Indi📊 EMA + RSI Daily Bias • Clarity Panel
This indicator is built for clarity, structure, and confidence in trading.
It combines EMAs, RSI, and a Daily Bias filter into one panel that helps you quickly understand trend, momentum, and alignment without cluttering your chart.
It does not provide signals or financial advice — instead, it simplifies your decision-making process by presenting conditions in a clear format.
🔧 Features
📈 Customizable EMAs (Fast & Slow)
Define short-term vs. medium-term trend direction.
Adjust the lengths for scalping, intraday, or swing trading.
🎯 RSI Integration
Tracks momentum on your active timeframe.
Highlights overbought (OB) and oversold (OS) conditions.
Used to filter entries and avoid chasing stretched moves.
🧭 Daily Bias (Higher Timeframe RSI)
Pulls RSI from the Daily chart (or chosen HTF).
Helps confirm if your local trade setup is aligned with higher timeframe momentum.
✨ Clarity Panel with Emojis
Displays Trend, HTF Bias, RSI reading, and State.
States include:
⏳ WAIT → No alignment or unclear conditions.
🟢 / 🔴 CONFIRM → Trend, RSI, and bias all align for a setup.
💰 COLLECT → RSI stretched to OB/OS, take partials or be cautious.
⚡ Optional Chart Markers
BUY/SELL labels appear when conditions align.
Alerts can be enabled for CONFIRM and COLLECT conditions.
💡 How to Use
Start with EMAs → Check if price is trending above or below EMAs to determine short-term direction.
Look at Daily Bias → See if RSI bias from higher timeframe (Daily by default) agrees with your local setup.
Check RSI → If RSI is neutral, WAIT. If RSI confirms momentum with trend + bias, CONFIRM. If RSI is stretched into OB/OS, COLLECT.
Use Panel for Quick Reads → The panel gives you a “dashboard” view of conditions so you don’t second-guess.
Combine with Your Own Strategy → This script is best used as a clarity filter to stay disciplined, not as a standalone signal generator.
📊 Example Workflow
Price above both EMAs ✅
Daily Bias shows BULL ✅
RSI at 62 (above midline, not yet overbought) ✅
→ Panel shows 🟢 CONFIRM → consider entering long.
Later, RSI rises to 72 (overbought) → Panel switches to 💰 COLLECT → take profits or tighten stops.
⚠️ Disclaimer
This script is for clarity and educational purposes only.
It does not provide financial advice, signals, or guaranteed profits.
Always use proper risk management and combine with your own trading plan.

Crypto Perp Calc v1Advanced Perpetual Position Calculator for TradingView
Description
A comprehensive position sizing and risk management tool designed specifically for perpetual futures trading. This indicator eliminates the confusion of calculating leveraged positions by providing real-time position metrics directly on your chart.
Key Features:
Interactive Price Selection: Click directly on chart to set entry, stop loss, and take profit levels
Accurate Lot Size Calculation: Instantly calculates the exact position size needed for your margin and leverage
Multiple Entry Support: DCA into positions with up to 3 entry points with customizable allocation
Multiple Take Profit Levels: Scale out of positions with up to 3 TP targets
Comprehensive Risk Metrics: Shows dollar P&L, account risk percentage, and liquidation price
Visual Risk/Reward: Color-coded boxes and lines display your trade setup clearly
Real-time Info Table: All critical position data in one organized panel
Perfect for traders using perpetual futures who need precise position sizing with leverage.
---------
How to Use
Quick Start (3 Clicks)
1. Add the indicator to your chart
2. Click three times when prompted:
First click: Set your entry price
Second click: Set your stop loss
Third click: Set your take profit
3. Read the TOTAL LOTS value from the info table (highlighted in yellow)
4. Use this lot size in your exchange when placing the trade
Detailed Setup
Step 1: Configure Your Account
Enter your account balance (total USDT in account)
Set your margin amount (how much USDT to risk on this trade)
Choose your leverage (1x to 125x)
Select Long or Short position
Step 2: Set Price Levels
Main levels use interactive clicking (Entry, SL, TP)
For multiple entries or TPs, use the settings panel to manually input prices and percentages
Step 3: Read the Results
The info table shows:
TOTAL LOTS - The position size to enter on your exchange
Margin Used - Your actual capital at risk
Notional - Total position value (margin × leverage)
Max Risk - Dollar amount you'll lose at stop loss
Total Profit - Dollar amount you'll gain at take profit
R:R Ratio - Risk to reward ratio
Account Risk - Percentage of account at risk
Liquidation - Price where position gets liquidated
Step 4: Advanced Features (Optional)
Multiple Entries (DCA):
Enable "Use Multiple Entries"
Set up to 3 entry prices
Allocate percentage for each (must total 100%)
See individual lot sizes for each entry
Multiple Take Profits:
Enable "Use Multiple TPs"
Set up to 3 TP levels
Allocate percentage to close at each level (must total 100%)
View profit at each target
Visual Elements
Blue lines/labels: Entry points
Red lines/labels: Stop loss
Green lines/labels: Take profit targets
Colored boxes: Visual risk (red) and reward (green) zones
Info table: Can be positioned anywhere on screen
Alerts
Set price alerts for:
Entry zones reached
Stop loss approached
Take profit levels hit
Works with TradingView's alert system
Tips for Best Results
Always verify the lot size matches your intended risk
Check the liquidation price stays far from your stop loss
Monitor the account risk percentage (recommended: keep under 2-3%)
Use the warning indicators if risk exceeds margin
For quick trades, use single entry/TP; for complex strategies, use multiple levels
Example Workflow
Find your trade setup using your analysis
Add this indicator and click to set levels
Check risk metrics in the table
Copy the TOTAL LOTS value
Enter this exact position size on your exchange
Set alerts for key levels if desired
This tool bridges the gap between TradingView charting and exchange execution, ensuring your position sizing is always accurate when trading with leverage.
Disclaimer, this was coded with help of AI, double check calculations if they are off.

(ES, NQ) Trend Checker SB1(ES, NQ) Trend Checker SB1
Stay ahead of the market by tracking whether the E-mini S&P 500 (ES) and the Nasdaq 100 (NQ) are moving in sync.
📊 How it works:
The script checks whether each index is bullish (close > open) or bearish (close < open).
If both are aligned (all bullish or all bearish), conditions are stable.
If they diverge, the indicator instantly flags a mismatch in trend.
🎯 Features:
Background shading to highlight mismatched conditions.
Real-time alerts when ES and NQ fall out of sync.
Works on any timeframe.
🔥 Why it matters:
When ES and NQ move together, market momentum is usually stronger and cleaner.
But when they disagree, expect choppiness, fakeouts, or caution zones — the perfect heads-up before entering trades.
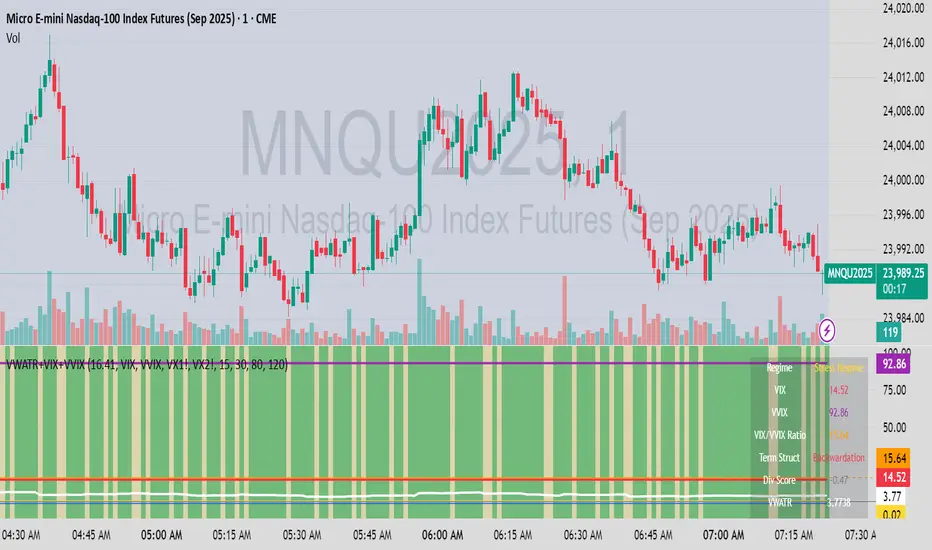
VWATR + VIX + VVIX Trend Regime### 🤖 VWATR + VIX + VVIX Trend Regime — Your Ultimate Volatility Dashboard! 📊
This isn't just another indicator; it's a comprehensive dashboard that brings together everything you need to understand market volatility focused on Futures. It merges price-based movement with market-wide fear and sentiment, giving you a powerful edge in your trading and risk management. Think of it as your personal volatility sidekick, ready to help you navigate market uncertainty like a pro!
***
### ✨ What's Inside?
* **VWATR (Volume-Weighted ATR):** A super-smart measure of price movement that pays close attention to where the big money is flowing.
* **VIX (The "Fear Gauge"):** Tracks the expected volatility of the S&P 500, essentially telling you how nervous the market is feeling.
* **VVIX (The "VIX of VIX"):** This one's for the pros! It measures how volatile the VIX itself is, giving you an early heads-up on potential fear spikes.
* **VX Term Structure:** A clever way to see if traders are preparing for a crisis. It compares the two nearest VIX futures to spot a rare signal called "backwardation."
* **Z-Scores:** It helps you spot when VIX and VVIX are at historic highs or lows, making it easier to predict when things might return to normal.
* **Divergence Score:** A unique tool to flag potential market shifts when the VIX and VVIX start moving in completely different directions.
* **Regime Classification:** The script automatically labels the market as "Full Panic," "Known Crisis," "Surface Calm," "Stress," or "Normal," so you always know where you stand.
* **Gradient Bars:** A visual treat! The background of your chart changes color to reflect real-time volatility shifts, giving you an instant feel for the market's mood.
* **Alerts:** Get push notifications on your phone for key events like "Full Panic" or "Backwardation" so you never miss a beat.
***
### 📝 Panel/Table Outputs
This is your mission control! The on-screen table gives you a clean summary of the current market regime, VIX and VVIX values, their ratios, term structure, Z-scores, and signals. Everything you need, right where you can see it.
***
### 🚀 How to Get Started
1. **Check your data:** You'll need access to real-time data for VIX, VVIX, VX1!, and VX2!. A paid subscription might be necessary for this.
2. **Add it to your chart:** Use the indicator on any chart (we've set it to `overlay=false`) to get your full volatility dashboard.
3. **Tweak it to perfection:** Head over to the Settings panel to customize the thresholds, colors, and your all-important "Jolt Value."
4. **Start trading smarter:** Use the dashboard to inform your trades, hedge your portfolio, and manage risk with confidence.
***
### ⚙️ Customization & Key Settings
* `showVWATR`: Toggle your price-volatility metric on or off.
* `showExpectedVol`: See the expected volatility as a percentage of the current price.
* `joltLevel`: This is a very important line on your chart! It's your personal trigger for when volatility is getting a little too wild. More on this below.
* `enableGradientBars`: Turn the awesome colored background on or off.
* `enableTable`: Hide or show your information table.
* `VIX/VVIX/VX1!/VX2! symbols`: If your broker uses different symbols for these, you can change them here.
* `VIX/VVIX thresholds`: Adjust these levels to fine-tune the indicator to your personal risk tolerance.
***
### 💡 Jolt Value: A Quick Guide for Smart Traders 🧠
The **jolt value** is your personal tripwire for volatility. Think of it as a warning light on your car's dashboard. You set the level, and when volatility (VWATR) crosses that line, you get an instant signal that something interesting is happening.
**How to Set Your Jolt Value:**
The ideal jolt value is dynamic. You want to keep it just a little above the current VIX level to stay alert without getting too many false alarms.
| Current VIX Level | Market Regime | Recommended Jolt Value |
| :--- | :--- | :--- |
| Under 15 | Calm/Complacent | 15–16 |
| 15–20 | Typical/Normal | 16–18 |
| 20–30 | Cautious/Active | 18–22 |
| Over 30 | Stress/Panic | 30+ |
**A Pro Tip for August 2025:** Since the VIX is hovering around 14.7, setting your jolt value to **16.5** is a great starting point for keeping an eye on things. If the VIX starts to climb above 20, you should adjust your jolt level to match the new reality.
***
### ⚠️ Important Things to Note
* You might experience some data delays if you're not on a paid TradingView plan or your broker does not provide real-time data for the VIX also VIX is only active during NY session, so it's not advised to use it outside of normal trading hours!
MTF Confluence Dashboard (Multi‑Timeframe Trend/Bias)MTF Confluence Dashboard — Multi‑Timeframe Trend/Bias Table + EMA
The MTF Confluence Dashboard is a fast, non‑repainting multi‑timeframe (MTF) confluence tool that shows higher‑timeframe trend and bias alignment in a compact, on‑chart table. It’s built for prop‑firm challenges and futures day traders who need instant top‑down confirmation without switching charts. Get a clean read of trend direction across your selected timeframes, plus on‑chart MAs for timing.
Why traders use it
* MTF Confluence at a glance: Trend/Bias table aggregates short vs long MA on 1m→1W (you pick which TFs show).
* Non‑repainting: Uses closed-bar higher‑TF data; reliable for alerts and evaluations.
* Futures + prop‑firm friendly: Minimal lag, lightweight, session‑agnostic; perfect for ES/NQ/CL/GC scalping or intraday swings.
Core features
* Trend/Bias Table: “Up / Down” per timeframe and an overall AVG sentiment.
* MA Engine: Choose MA type (SMA/EMA/WMA/HMA) and lengths (e.g., 50/200) to define bias.
* On‑Chart Confirmation: Plots short/long MAs for entry timing on your trading TF.
* Smart Alerts: Built‑in alerts for Strong Up/Up/Neutral/Down/Strong Down average bias.
* Custom Layout: Vertical or Horizontal table, resizable text (Tiny → Huge), corner positioning.
* Pro Visual Themes:
* Dark Intergalactic (neon/futuristic for dark charts)
* Light Minimal (clean light mode)
* Pro Modern (low‑saturation, desk‑ready)
How to trade it
* Scalps (1m–5m): Only take longs when 5m/15m/1H/D are “Up” and AVG is Up/Strong Up; use MA crosses/pulls for entries.
* Intraday swings (5m–15m–1H): Wait for a higher‑TF flip to align; trail under the long MA.
* Risk discipline: If AVG shifts to Neutral/Down, stop looking for longs until bias realigns.
Settings you’ll care about
* Timeframes to display (1m, 2m, 3m, 5m, 10m, 15m, 30m, 1H, 2H, 4H, 6H, 12H, 1D, 1W).
* MA Type: SMA / EMA / WMA / HMA.
* Short/Long lengths (defaults 50/200).
* Theme, orientation, and size.
Notes
* Works on all symbols and timeframes.
* No repainting; alerts trigger on closed conditions.
* Built by PineProfits.
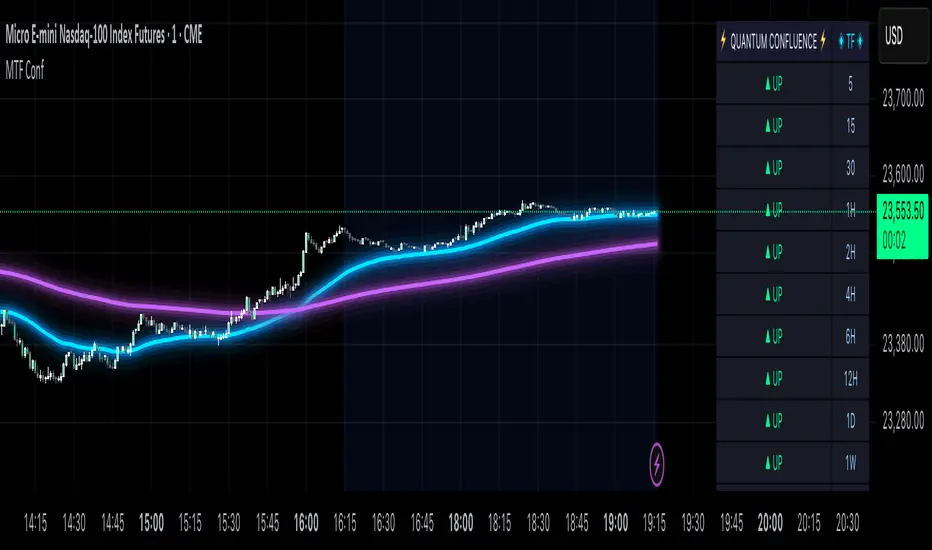
Futures PnL Levels [MFFU]Futures PnL Levels is a purpose-built indicator designed specifically for futures traders using TradingView. Whether you're backtesting strategies, planning trades, or managing live positions, this tool gives you a clean, visual overlay of your Profit & Loss directly on the chart, based on your custom input.
Why This Indicator is Different
If you trade using Tradovate through TradingView , you’ve likely noticed a major limitation: TradingView does not show your real-time PnL. This has made it nearly impossible to track live profits and losses within the charting platform until now.
Futures PnL Levels bridges that gap . By inputting your entry, TP, SL, and contract size, you can now replicate a live, dynamic PnL experience directly on your TradingView chart. This solves a long-standing issue for Tradovate users and significantly improves real-time trade awareness.
Key Features
Trade Modeling
Define your trade parameters upon activating the indicator:
Set your entry price , profit target , and stop loss
Input the number of contracts to reflect real-world position sizing
Visual PnL Display
Auto-drawing Take Profit (TP) , Stop Loss (SL) , and Breakeven levels
Live PnL tracking that moves with current market price
Optional live display of floating PnL values and breakeven zones
Styling & Display Options
Adjust line colors and widths for TP/SL/Breakeven
Differentiate real-time positive vs. negative PnL with separate colors
Toggle visibility of label lines and full readouts
Customize label size , price rounding , and other chart elements
Position Summary Table
View a compact summary of your trade parameters
Float this table anywhere on the chart (e.g., top right )
Provides an at-a-glance view of your current setup
Built for CME Futures
Fully compatible with CME instruments like ES, NQ, CL, GC , and more
Supports both long and short positions
Works with auto-detected or manually defined futures contracts
Who It’s For
Futures traders looking to plan trades visually before entering a position
Backtesters and strategy developers who need PnL clarity during analysis
Active traders using Tradovate through TradingView who are missing live PnL tracking
Why Use Futures PnL Levels ?
Unlike generic TP/SL indicators, this tool offers a true replacement for missing PnL visibility in the TradingView + Tradovate ecosystem. Instead of manually inputting your profits, this indicator lets you see your trade’s performance unfold in real time — directly on the chart .
Whether you're preparing a precise entry or managing an open position, Futures PnL Levels adds structure, confidence, and clarity to every trade.

Fractal Market Model [BLAZ]Version 1.0 – Published August 2025: Initial release
1. Overview & Purpose
1.1. What This Indicator Does
The Fractal Market Model is an original multi-timeframe technical analysis tool that bridges the critical gap between macro-level market structure and micro-level price execution. Designed to work across all financial markets including Forex, Stocks, Crypto, Futures, and Commodities. While traditional Smart Money Concepts indicators exist, this implementation analyses multi-timeframe liquidity zones and price action shifts, marking potential reversal points where Higher Timeframe (HTF) liquidity sweeps coincide with Low Timeframe (LTF) price action dynamics changes.
Snapshot details: NASDAQ:GOOG , 1W Timeframe, Year 2025
1.2. What Sets This Indicator Apart
The Fractal Market Model analyses multi-timeframe correlations between HTF structural events and LTF price action. This creates a dynamic framework that reveals patterns observed historically in price behaviour that are believed to reflect institutional activity across multiple time dimensions.
The indicator recognizes that markets move in fractal cycles following the AMDX pattern (Accumulation, Manipulation, Distribution, Continuation/Reversal). By tracking this pattern across timeframes, it flags zones where price action dynamics characteristics have historically shown shifts. In the LTF, the indicator monitors for price closing through the open of an opposing candle near HTF swing highs or lows, marking this as a Change in State of Delivery (CISD), a threshold event where price action historically transitions direction.
Practical Value:
Multi-Timeframe Integration: Connects HTF structural events with LTF execution patterns.
Fractal Pattern Recognition: Identifies AMDX cycles across different time dimensions.
Price Behavior Analysis: Tracks CISD patterns that may reflect historical shifts in order flow commonly associated with institutional activity.
Range-Based Context: Analyses price action within established HTF liquidity zones.
1.3. How It Works
The indicator employs a systematic 5-candle HTF tracking methodology:
Candles 0-1: Accumulation phase identification.
Candle 2: Manipulation detection (raids previous highs/lows).
Candle 3: Distribution phase recognition.
Candle 4: Continuation/reversal toward opposite liquidity.
The system monitors for CISD patterns on the LTF when HTF manipulation candles close with confirmed sweeps, highlighting zones where order flow dynamics historically shifted within the established HTF range.
Snapshot details: FOREXCOM:AUDUSD , 1H Timeframe, 17 to 28 July 2025
Note: The Candle 0-5 and AMDX labels shown in the accompanying image are for demonstration purposes only and are not part of the indicator’s actual functionality.
2. Visual Elements & Components
2.1. Complete FMM Setup Overview
A fully developed Fractal Market Model setup displays multiple analytical components that work together to provide comprehensive market structure analysis. Each visual element serves a specific purpose in identifying and tracking the AMDX cycle across timeframes.
2.2. Core Visual Components
Snapshot details: FOREXCOM:EURUSD , 5 Minutes Timeframe, 27 May 2025.
Note: The numbering labels 1 to 14 shown in the accompanying image are for demonstration purposes only and are not part of the indicator’s actual functionality.
2.2.1. HTF Structure Elements
(1) HTF Candle Visualization: Displays the 5-candle sequence being tracked (configurable quantity up to 10).
(2) HTF Candle Labels (C2-C4): Numbered identification for each candle in the AMDX cycle.
(3) HTF Resolution Label: Shows the higher timeframe being analysed.
(4) Time Remaining Indicator: Countdown to HTF candle closure.
(5) Vertical Separation Lines: Clearly delineates each HTF candle period.
2.2.2. Key Price Levels
(6) Liquidity Levels: High/low levels from HTF candles 0 and 1 representing potential target zones.
(7) Sweep Detection Lines: Marks where previous HTF candle extremes have been breached on both HTF and LTF.
(8) HTF Candle Mid-Levels: 50% retracement levels of previous HTF candles displayed on current timeframe.
(9) Open Level Marker: Shows the opening price of the most recent HTF candle.
2.2.3. Institutional Analysis Tools
(10) CISD Line: Marks the Change in State of Delivery pattern identification point.
(11) Consequent Encroachment (CE): Mid-level of identified institutional order blocks.
(12) Potential Reversal Area (PRA): Zone extending from previous candle close to the mid-level.
(13) Fair Value Gap (FVG): Identifies imbalance areas requiring potential price revisits.
(14) HTF Time Labels: Individual time period labels for each HTF candle.
2.3. Interactive Features
All visual elements update dynamically as new price data confirms or invalidates the tracked patterns, providing real-time market structure analysis across the selected timeframe combination.
3. Input Parameters and Settings
3.1. Alert Configuration
Setup Notifications: Users can configure alerts to receive notifications when new FMM setups form based on their selected bias, timeframes, and filters. Enable this feature by:
Configure the bias, timeframes and filters and other settings as desired.
Toggle the "Alerts?" checkbox to ON in indicator settings.
On the chart, click the three dots menu beside the indicator's name or press Alt + A.
Select "Add Alert" and click “Create” to activate the alert.
3.2. Display Control Settings
3.2.1. Historical Setup Quantity
Setup Display Control: Customize how many historical setups appear on the chart, with support for up to 50 combined entries. The indicator displays both bullish and bearish FMM setups within the selected limit, including invalidated scenarios. For example, selecting "3 setups" will display the most recent combination of bullish and bearish patterns based on the model's detection logic.
Snapshot details: BINANCE:BTCUSD , 1H Timeframe, 27-Feb to 11-Mar 2025
Note: The labels “Setup 1, 2 & 3: Bullish or Bearish” shown in the accompanying image are for demonstration purposes only and are not part of the indicator’s actual functionality.
3.2.2. Directional Bias Filter
Bias Filter: Control which setups are displayed based on directional preference:
Bullish Only: Shows exclusively upward bias setups.
Bearish Only: Shows exclusively downward bias setups.
Balanced Mode: Displays both directional setups.
This flexibility helps align the indicator's output with broader market analysis or trading framework preferences. The chart below illustrates the same chart in 3.2.1. but when filtered to show only bullish setups.
Snapshot details: BINANCE:BTCUSD , 1H Timeframe, 27-Feb to 11-Mar 2025
Note: The labels “Setup 1, 2 & 3: Bullish” shown in the accompanying image are for demonstration purposes only and are not part of the indicator’s actual functionality.
3.2.3. Invalidated Setup Display
Invalidation Visibility: A setup becomes invalidated when price moves beyond the extreme high or low of the Manipulation candle (C2), indicating that the expected fractal pattern has been disrupted. Choose whether to display or hide setups that have been invalidated by subsequent price action. This feature helps maintain chart clarity while preserving analytical context:
Amber Labels: Setups invalidated at Candle 3 (C3).
Red Labels: Setups invalidated at Candle 4 (C4).
Count Preservation: Invalidated setups remain part of the total setup count regardless of visibility setting.
Below image illustrates balanced setups:
Left side: 1 bearish valid setup, with 2 invalidated setups visible.
Right side: 1 bearish valid setup, with 2 invalidated setups hidden for chart clarity.
Snapshot details: FOREXCOM:GBPJPY , 5M Timeframe, 30 July 2025
3.3. Timeframe Configuration
3.3.1. Multi-Timeframe Alignment
Custom Timeframe Selection: Configure preferred combinations of Higher Timeframe (HTF) and Lower Timeframe (LTF) for setup generation. While the indicator includes optimized default alignments (1Y –1Q, 1Q –1M, 1M –1W, 1M –1D, 1W–4H, 1D–1H, 4H-30m, 4H –15m, 1H –5m, 30m –3m, 15m –1m), users can define custom HTF-LTF configurations to suit their analysis preferences and market focus.
The image below illustrates two different HTF – LTF configuration, both on the 5 minutes chart:
Right side: Automatic multi-timeframe alignment, where the indicator autonomously sets the HTF pairing to 1H when the current chart timeframe is the 5 minutes.
Left side: Custom Timeframe enabled, where HTF is manually set to 4H, and LTF is manually set to 15 minutes, while being on the 5 minutes chart.
Snapshot details: FOREXCOM:GBPJPY , 5 minutes timeframe, 30 July 2025
3.3.2. Session-Based Filtering
Visibility Filters: Control when FMM setups appear using multiple filtering options:
Time-Based Controls:
Show Below: Limit setup visibility to timeframes below the selected threshold.
Use Session Filter: Enable session-based time window restrictions.
Session 1, 2, 3: Configure up to three custom time sessions with start and end times.
These filtering capabilities help concentrate analysis on specific market periods or timeframe contexts.
The image below illustrates the application of session filters:
Left side: The session filter is disabled, resulting in four setups being displayed throughout the day—two during the London session and two during the New York session.
Right side: The session filter is enabled to display setups exclusively within the New York session (8:00 AM – 12:00 PM). Setups outside this time window are hidden. Since the total number of setups is limited to four, the indicator backfills by identifying and displaying two qualifying setups from earlier price action that occurred within the specified New York session window.
Snapshot details: COMEX:GC1! , 5 minutes Timeframe, 29 July 2025
3.4. Annotation Systems
3.4.1. Higher Timeframe (HTF) Annotations
HTF Display Control: Enable HTF visualization using the "HTF candles" checkbox with quantity selector (default: 5 candles, expandable to 10). This displays all HTF elements detailed in the Visual Components section 2.2. above.
Customisation Categories:
Dimensions: Adjust candle offset, gap spacing, and width for optimal chart fit.
Colours: Customize body, border, and wick colours for bullish/bearish candle differentiation.
Style Options: Control line styles for HTF opens, sweep lines, and equilibrium levels.
Feature Toggles: Enable/disable Fair Value Gaps, countdown labels, and individual candle labelling.
All HTF annotation elements support individual styling controls to maintain visual clarity while preserving analytical depth. The image below shows two examples: the left side has customized styling applied, while the right side shows the default appearance.
Snapshot details: CME_MINI:NQ1! , 5 minutes Timeframe, 29 July 2025
3.4.2. Lower Timeframe (LTF) Annotations
LTF Display Control: Comprehensive annotation system for detailed execution analysis, displaying all LTF elements outlined in the Visual Components section 2.2. above.
Customization Categories:
Core Elements: Control HTF separation lines, sweep markers, CISD levels, and candle phase toggles (C2, C3, C4) to selectively show or hide the LTF annotations for each of these specific HTF candle phases.
Reference Levels: Adjust previous equilibrium lines, CISD consequent encroachment, and HTF liquidity levels.
Analysis Tools: Enable potential holding area (PHA) markers.
Styling Options: Individual visibility toggles, colour schemes, line styles, and thickness controls for each element.
All LTF components support full customization to maintain chart clarity while providing precise execution context. The image below shows two examples: the left side has customized styling applied, while the right side shows the default appearance.
Snapshot details: TVC:DXY , 5 minutes Timeframe, 28 July 2025
3.5. Performance Considerations
Higher setup counts and extended HTF displays may impact chart loading times. Adjust settings based on device performance and analysis requirements.
4. Closed-Source Protection Justification
4.1. Why This Indicator Requires Protected Source Code
The Fractal Market Model is the result of original research, development, and practical application of advanced price action frameworks. The indicator leverages proprietary algorithmic systems designed to interpret complex market behavior across multiple timeframes. To preserve the integrity of these innovations and prevent unauthorized replication, the source code is protected.
4.1.1. Key Proprietary Innovations
Real-Time Multi-Timeframe Correlation Engine: A dynamic logic system that synchronizes higher timeframe structural behaviour with lower timeframe execution shifts using custom correlation algorithms, adaptive thresholds, and time-sensitive conditions, supporting seamless fractal analysis across nested timeframes.
CISD Detection Framework: A dedicated mechanism for identifying Change in State of Delivery (CISD), where price closes through the open of an opposing candle at or near HTF swing highs or lows after liquidity has been swept. This is used to highlight potential zones of directional change based on historical order flow dynamics.
Fractal AMDX Cycle Recognition: An engineered structure that detects and classifies phases of Accumulation, Manipulation, Distribution, and Continuation/Reversal (AMDX) across configurable candle sequences, allowing traders to visualize market intent within a repeatable cycle model.
Dynamic Invalidation Logic: An automated monitoring system that continually evaluates the validity of active setups. Setups are invalidated in real time when price breaches the extreme of the manipulation phase (C2), ensuring analytical consistency and contextual alignment.
4.1.2. Community Value
The closed-source nature of this tool protects the author’s original intellectual property while still delivering value to the TradingView community. The indicator offers a complete, real-time visual framework, educational annotations, and intuitive controls for analysing price action structure and historically observed patterns commonly attributed to institutional behaviour across timeframes.
5. Disclaimer & Terms of Use
This indicator, titled Fractal Market Model , has been independently developed by the author based on their own study, interpretation, and practical application of the smart money concepts. The code and structure of this indicator are original and were written entirely from scratch to reflect the author's unique understanding and experience. This indicator is an invite-only script. It is closed-source to protect proprietary algorithms and research methodologies.
This tool is provided solely for educational and informational purposes. It is not intended—and must not be interpreted—as financial advice, investment guidance, or a recommendation to buy or sell any financial instrument. The indicator is designed to assist with technical analysis based on market structure theory but does not guarantee accuracy, profitability, or specific results.
Trading financial markets involves significant risk, including the possibility of loss of capital. By using this indicator, you acknowledge and accept that you are solely responsible for any decisions you make while using the tool, including all trading or investment outcomes. No part of this script or its features should be considered a signal or assurance of success in the market.
By subscribing to or using the indicator, you agree to the following:
You fully assume all responsibility and liability for the use of this product.
You release the author from any and all liability, including losses or damages arising from its use.
You acknowledge that past performance—real or hypothetical—does not guarantee future outcomes.
You understand that this indicator does not offer personalised advice, and no content associated with it constitutes a solicitation of financial action.
You agree that all purchases are final. Once access is granted, no refunds, reimbursements, or chargebacks will be issued under any circumstance.
You agree to not redistribute, resell, or reverse engineer the script or any part of its logic.
Users are expected to abide by all platform guidelines while using or interacting with this tool. For access instructions, please refer to the Author's Instructions section or access the tool through the verified vendor platform.
