True Seasonal Pattern [tradeviZion]True Seasonal Pattern: Uncover Hidden Market Cycles
Markets have rhythms and patterns that repeat with surprising regularity. The True Seasonal Pattern indicator reveals these hidden cycles across different timeframes, helping you anticipate potential market movements based on historical seasonal tendencies.
What This Indicator Does
The True Seasonal Pattern analyzes years of historical price data to identify recurring seasonal trends. It then plots these patterns on your chart, showing you both the historical pattern and future projection based on past seasonal behavior.
Automatic Timeframe Detection: Works with Monthly, Weekly, and Daily charts
Historical Pattern Analysis: Analyzes up to 100 years of data (customizable)
Future Projection: Projects the seasonal pattern ahead on your chart
Smart Smoothing: Applies appropriate smoothing based on your timeframe
How to Use This Indicator
Add the indicator to a Daily, Weekly, or Monthly chart (not designed for intraday timeframes)
The indicator automatically detects your chart's timeframe
The blue line shows the historical seasonal pattern
Watch for potential turning points in the pattern that align with other technical signals
Seasonal patterns work best as a supporting factor in your analysis, not as standalone trading signals. They are particularly effective in markets with well-established seasonal influences.
Best Applications
Futures Markets: Commodities and futures often show strong seasonal tendencies due to production cycles, weather patterns, and economic factors
Stock Indices: Many stock markets demonstrate regular seasonal patterns (like the "Sell in May" phenomenon)
Individual Stocks: Companies with seasonal business cycles often show predictable price patterns
Practical Applications
Identify potential turning points based on historical seasonal patterns
Plan entries and exits around seasonal tendencies
Add seasonal context to your existing technical analysis
Understand why certain months or periods might show consistent behavior
Pro Tip: For best results, use this tool on instruments with at least 5+ years of historical data. Longer timeframes often reveal more reliable seasonal patterns.
Important Notes
This indicator works best on Daily, Weekly, and Monthly timeframes - not intraday charts
Seasonal patterns are tendencies, not guarantees
Always combine seasonal analysis with other technical tools
Past patterns may not repeat exactly in the future
// Sample of the seasonal calculation approach
float yearHigh = array.max(currentYearHighs)
float yearLow = array.min(currentYearLows)
// Calculate seasonality for each period
for i = 0 to array.size(currentYearCloses) - 1
float periodClose = array.get(currentYearCloses, i)
if not na(periodClose) and yearHigh != yearLow
float seasonality = (periodClose - yearLow) / (yearHigh - yearLow) * 100
I developed this indicator to help traders incorporate seasonal analysis into their trading approach without the complexity of traditional seasonal tools. Whether you're analyzing agricultural commodities, energy futures, or stock indices, understanding the seasonal context can provide valuable insights for your trading decisions.
Remember: Markets don't always follow seasonal patterns, but when they do, being aware of these tendencies can give you a meaningful edge in your analysis.
Futuresmarket

Crude Oil: Backwardation Vs ContangoCrude Oil, CL
Plots Futures Curve: Futures contract prices over the next 3.5 years; to easily visualize Backwardation Vs Contango(carrying charge) markets.
Carrying charge (contract prices increasing into the future) = normal, representing the costs of carrying/storage of a commodity. When this is flipped to Backwardation(As the above; contract prices decreasing into the future): it's a bullish sign: Buyers want this commodity, and they want it NOW.
Note: indicator does not map to time axis in the same way as price; it simply plots the progression of contract months out into the future; left to right; so timeframe DOESN'T MATTER for this plot
TO UPDATE (every year or so): in REQUEST CONTRACTS section, delete old contracts (top) and add new ones (bottom). Then in PLOTTING section, Delete old contract labels (bottom); add new contract labels (top); adjust the X in 'bar_index-(X+_historical)' numbers accordingly
This is one of several similar Futures Curve indicators: Meats | Metals | Grains | VIX | Crude Oil
If you want to build from this; to work on other commodities; be aware that Tradingview limits the number of contract calls to 40 (hence the multiple indicators)
Tips:
-Right click and reset chart if you can't see the plot; or if you have trouble with the scaling.
-Right click and add to new scale if you prefer this not to overlay directly on price. Or move to new pane below.
-If this takes too long to load (due to so many security calls); comment out the more distant future half of the contracts; and their respective labels. Or comment out every other contract and every other label if you prefer.
--Added historical input: input days back in time; to see the historical shape of the Futures curve via selecting 'days back' snapshot
updated 20th June 2022
© twingall

VIX: Backwardation Vs ContangoVIX: Backwardation Vs Contango
Quickly visualize Contango vs Backwardation in the S&P 500 Volatility Index by plotting the prices of the futures contracts over the next 9 months
Note: indicator does not map to time axis in the same way as price; it simply plots the progression of contract months out into the future; left to right; so timeframe DOESN'T MATTER for this plot
TO UPDATE(every few months recommended): in REQUEST CONTRACTS section, delete old contracts (top) and add new ones (bottom). Then in PLOTTING section, Delete old contract labels (bottom); add new contract labels (top); adjust the X in 'bar_index-(X+_historical)' numbers accordingly
This is one of several similar indicators: Meats | Metals | Grains | VIX
Tips:
-Right click and reset chart if you can't see the plot; or if you have trouble with the scaling.
-Right click and pin to Scale A to plot on the same scale as price
--Added historical input: input days back in time; to see the historical shape of the Futures curve via selecting 'days back' snapshot
updated 15th June 2022
© twingall

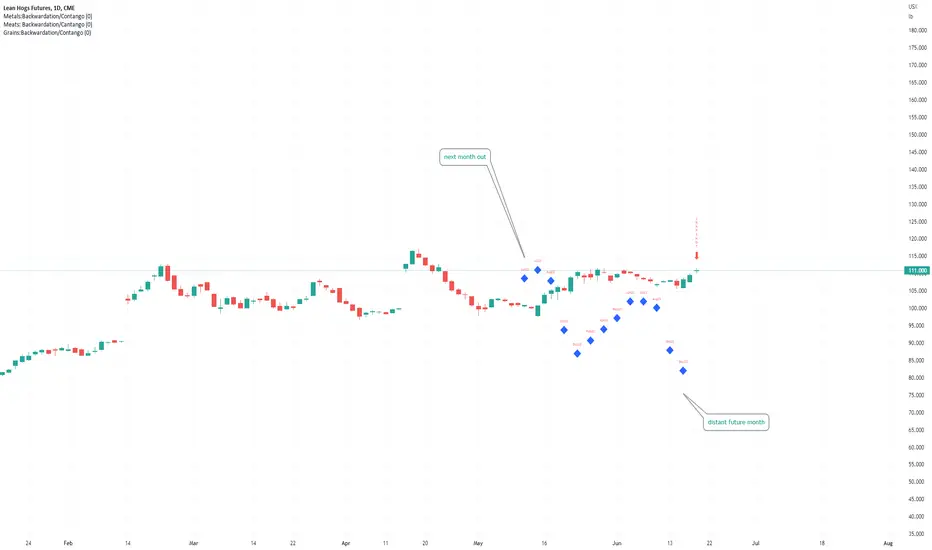
Meats: Backwardation/CantangoMEATS: Live Cattle , Feeder Cattle, Lean Hogs (LE, GF , HE)
Quickly visualize carrying charge market vs backwardized market by comparing the price of the next 2 years of futures contracts.
Carrying charge (contract prices increasing into the future) = normal, representing the costs of carrying/storage of a commodity. When this is flipped to Backwardation (contract prices decreasing into the future): its a bullish sign: Buyers want this commodity, and they want it NOW.
Note: indicator does NOT map to time axis in the same way as price; it simply plots the progression of contract months out into the future; left to right; so timeframe DOESN'T MATTER for this plot
There's likely some more efficient way to write this; e.g. when plotting for Live Cattle (LE); 8 of the security requests are redundant; but they are still made; and can make this slower to load
TO UPDATE(once a year will do): in REQUEST CONTRACTS section, delete old contracts (top) and add new ones (bottom). Then in PLOTTING section, Delete old contract labels (bottom); add new contract labels (top); adjust the X in 'bar_index-(X+_historical)' numbers accordingly
This is one of three similar indicators: Meats | Metals | Grains
-If you want to build from this; to work on other commodities ; be aware that Tradingview limits the number of contract calls to 40 (hence the 3 seperate indicators)
Tips:
-Right click and reset chart if you can't see the plot; or if you have trouble with the scaling.
-Right click and add to new scale if you prefer this not to overlay directly on price. Or move to new pane below.
--Added historical input: input days back in time; to see the historical shape of the Futures curve via selecting 'days back' snapshot
updated 15th June 2022
© twingall