Fibonacci Vision ProFibonacci Precision Signals Pro | Smart Buy & Sell Alerts
━━━━━━━━━━━━━━━━━━━━━━━━━━━━━━━━━━━━━━━━━━━━━━━━━━━━
OVERVIEW
This indicator combines Fibonacci mathematics with advanced signal filtering to deliver precise buy and sell signals. It automatically detects swing structure, calculates the key 0.618 retracement level, and generates signals only when multiple confirmation factors align.
Clean. Accurate. Professional.
━━━━━━━━━━━━━━━━━━━━━━━━━━━━━━━━━━━━━━━━━━━━━━━━━━━━
HOW IT WORKS
The script identifies swing highs and lows, then calculates Fibonacci retracement levels automatically. When price interacts with the 0.618 zone and all filters confirm, a signal appears:
▲ buy — Long entry opportunity
▼ sell — Short entry opportunity
━━━━━━━━━━━━━━━━━━━━━━━━━━━━━━━━━━━━━━━━━━━━━━━━━━━━
6-LAYER CONFIRMATION SYSTEM
Every signal must pass through:
Trend Direction Analysis
Fibonacci Level Interaction
EMA Trend Filter (50-period default)
RSI Momentum Validation (14-period default)
Volume Spike Detection
Candlestick Pattern Recognition (Pin bars, Engulfing, Momentum candles)
This multi-layer approach significantly reduces false signals.
━━━━━━━━━━━━━━━━━━━━━━━━━━━━━━━━━━━━━━━━━━━━━━━━━━━━
BUILT-IN RISK MANAGEMENT
Every trade includes automatic stop loss and take profit levels:
Stop Loss: 100 pips
Take Profit: 200 pips
Risk-Reward Ratio: 1:2
Adjust these values in settings to match your trading style.
━━━━━━━━━━━━━━━━━━━━━━━━━━━━━━━━━━━━━━━━━━━━━━━━━━━━
KEY FEATURES
✅ Automatic Fibonacci calculation — no manual drawing
✅ Multi-timeframe compatibility — M15 to Daily
✅ Universal market support — Forex, Crypto, Stocks, Indices
✅ Clean minimalist signals — white triangles with text
✅ Customizable filters — adjust sensitivity to your preference
✅ Built-in alerts — never miss a signal
✅ No repainting — signals remain fixed once confirmed
━━━━━━━━━━━━━━━━━━━━━━━━━━━━━━━━━━━━━━━━━━━━━━━━━━━━
Swing Detection:
Swing Length — Controls sensitivity to market structure (default: 10)
Confirmation Bars — Bars required to confirm signal (default: 1)
Signal Filters:
EMA Trend Filter — Toggle trend confirmation on/off
EMA Length — Adjust trend filter period (default: 50)
RSI Filter — Toggle momentum confirmation on/off
RSI Length — Adjust momentum period (default: 14)
Volume Filter — Toggle volume confirmation on/off
Volume Multiplier — Set volume threshold (default: 1.2x average)
Risk Management:
Stop Loss Pips — Set your stop loss distance (default: 100)
Take Profit Pips — Set your profit target (default: 200)
Pip Value — Adjust for your instrument (0.0001 for most Forex, 0.01 for JPY pairs)
Visuals:
Show Signals — Toggle signal visibility
Show Cloud — Toggle Fibonacci zone visibility
━━━━━━━━━━━━━━━━━━━━━━━━━━━━━━━━━━━━━━━━━━━━━━━━━━━━
BEST PRACTICES
Use on H1 or H4 timeframes for optimal results
Trade in direction of the higher timeframe trend
Avoid trading during major news events
Combine with proper position sizing
Always use the built-in stop loss
Be patient — quality signals over quantity
━━━━━━━━━━━━━━━━━━━━━━━━━━━━━━━━━━━━━━━━━━━━━━━━━━━━
MARKETS SUPPORTED
Forex — All major, minor, and exotic pairs
Crypto — BTC, ETH, and altcoins
Stocks — Any equity on TradingView
Indices — S&P500, NASDAQ, DAX, FTSE, etc.
Commodities — Gold, Silver, Oil, etc.
━━━━━━━━━━━━━━━━━━━━━━━━━━━━━━━━━━━━━━━━━━━━━━━━━━━━
WHY FIBONACCI?
The 0.618 ratio (Golden Ratio) is observed by traders worldwide. When price retraces to this level, it often:
Reverses direction
Finds support or resistance
Creates high-probability entry opportunities
This script automates the detection of these key moments.
━━━━━━━━━━━━━━━━━━━━━━━━━━━━━━━━━━━━━━━━━━━━━━━━━━━━
ALERTS INCLUDED
Set up notifications to receive signals on:
Mobile push notifications
Desktop popups
Email alerts
Webhook integrations
Never miss a trading opportunity again.
━━━━━━━━━━━━━━━━━━━━━━━━━━━━━━━━━━━━━━━━━━━━━━━━━━━━
WHAT MAKES THIS DIFFERENT
Most indicators give too many signals. This one focuses on quality.
Most indicators clutter your chart. This one keeps it clean.
Most indicators ignore risk management. This one includes it.
Most indicators work on one market. This one works on all.
━━━━━━━━━━━━━━━━━━━━━━━━━━━━━━━━━━━━━━━━━━━━━━━━━━━━
DISCLAIMER
This indicator is a trading tool, not financial advice. Trading involves substantial risk of loss. Past performance does not guarantee future results. Always use proper risk management and never trade with money you cannot afford to lose. Test on a demo account before trading live.
Golden-ratio

Bitcoin Golden Pi CyclesTops are signaled by the fast top MA crossing above the slow top MA, and bottoms are signaled by the slow bottom MA crossing above the fast bottom MA. Alerts can be set on top and bottom prints. Does not repaint.
Similar to the work of Philip Swift regarding the Bitcoin Pi Cycle Top, I’ve recently come across a similar mathematically curious ratio that corresponds to Bitcoin cycle bottoms. This ratio was extracted from skirmantas’ Bitcoin Super Cycle indicator . Cycle bottoms are signaled when the 700D SMA crosses above the 137D SMA (because this indicator is closed source, these moving averages were reverse-engineered). Such crossings have historically coincided with the January 2015 and December 2018 bottoms. Also, although yet to be confirmed as a bottom, a cross occurred June 19, 2022 (two days prior to this article)
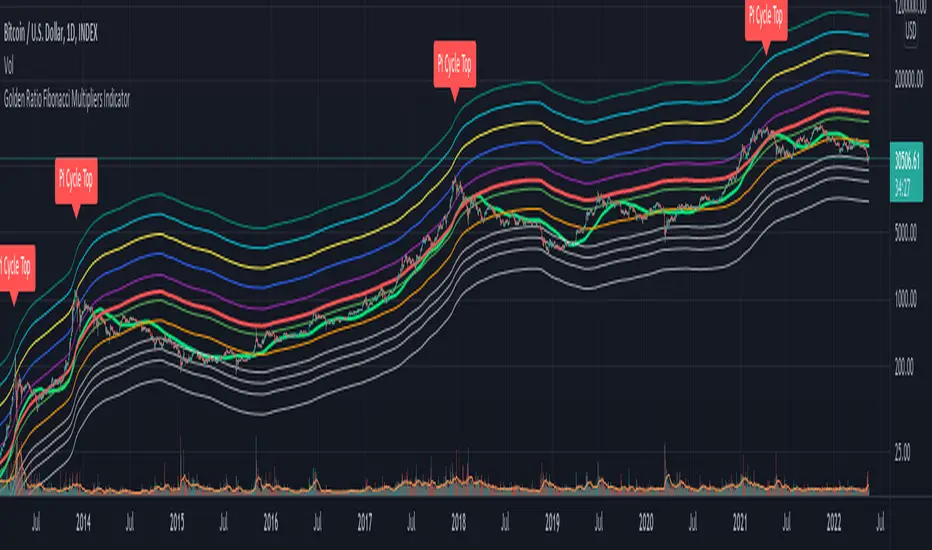
The original pi cycle uses the doubled 350D SMA and the 111D SMA . As pointed out this gives the original pi cycle top ratio:
350/111 = 3.1532 ≈ π
Also, as noted by Swift, 111 is the best integer for dividing 350 to approximate π. What is mathematically interesting about skirmanta’s ratio?
700/138 = 5.1095
After playing around with this for a while I realized that 5.11 is very close to the product of the two most numerologically significant geometrical constants, π and the golden ratio, ϕ:
πϕ = 5.0832
However, 138 turns out to be the best integer denominator to approximate πϕ:
700/138 = 5.0725 ≈ πϕ
This is what I’ve dubbed the Bitcoin Golden Pi Bottom Ratio.
In the spirit of numerology I must mention that 137 does have some things going for it: it’s a prime number and is very famously almost exactly the reciprocal of the fine structure constant (α is within 0.03% of 1/137).
Now why 350 and 700 and not say 360 and 720? After all, 360 is obviously much more numerologically significant than 350, which is proven by the fact that 360 has its own wikipedia page, and 350 does not! Using 360/115 and 720/142, which are also approximations of π and πϕ respectively, this also calls cycle tops and bottoms.
There are infinitely many such ratios that could work to approximate π and πϕ (although there are a finite number whose daily moving averages are defined). Further analysis is needed to find the range(s) of numerators (the numerator determines the denominator when maintaining the ratio) that correctly produce bottom and top signals.

Divina - Support and ResistanceGiven the positive feedback received on the first Dynamic Support/Resistance script, I've decided to rewrite it on Pine Script v5 and publish it with open source code.
The main Divina area (box) is derived from change in price and volume, while the other support and resistance levels are based on the golden ratio (Divina proportione) or Fibonacci numbers.
The box will start to paint if the previous closed bar satisfy a condition and it will be never be repainted in the future. Anyway the box and the levels will be extended until a new signal is detected.
The Divina Support and Resistance will help you to find good price zones on wich the market might take trading decision. It is not a strategy by per se, it should be used with other good trading techniques.

Alt Golden Ratio by USCG_VetPine Script math based on the medium article by Philip Swift.
Idea based from Willy Woo Charts.
Disclaimer: None of this Pine Script, Title, nor Description should be used for Financial Advice. For Education Purposes Only.
Purpose: Identify a Golden Ratio Cross of the 350 Daily MA vs the 111 Daily MA with Multiplier to theorize where local valuation tops or bottoms could be approximated. NOT FINANCIAL ADVICE!
Parameters:
DMA A: short Daily Moving Average
DMA B: long Daily Moving Average
Golden Ratio: point where short Daily Moving Average crosses value assigned in parameter.
Indicators:
S2: Cross of DMA A vs DMA B in upward direction (approximate local top)
Sn: additional approximate top indicators
Sell1: first approximate local bottom
Selln: additional approximate local bottom indicators
GR: Golden-Ratio Cross of DMA A

Bitcoin Golden RatioGives the top and bottom of the cryptocurrencies cycles.
When DMA111 crosses DMA350*2, the top is in.
Show accumulation phases and resistances with very precise accuracy.
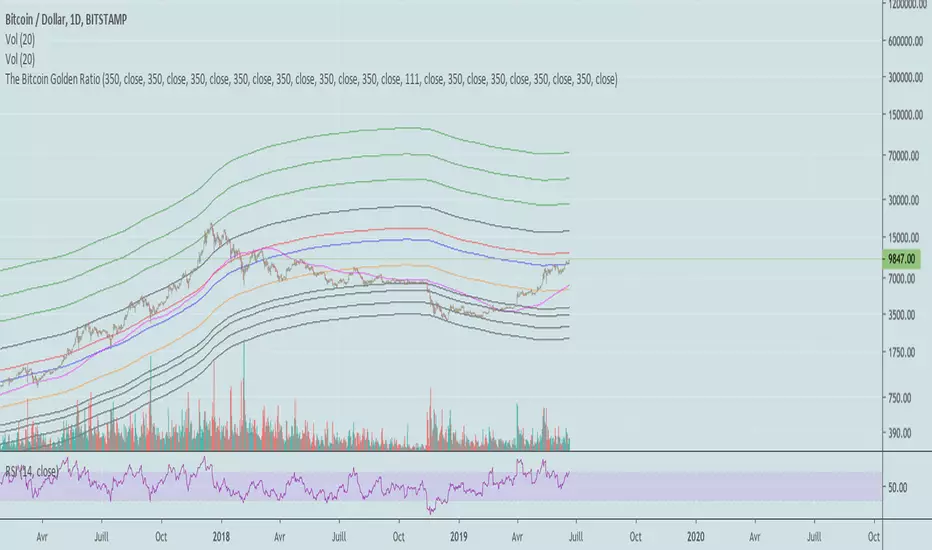
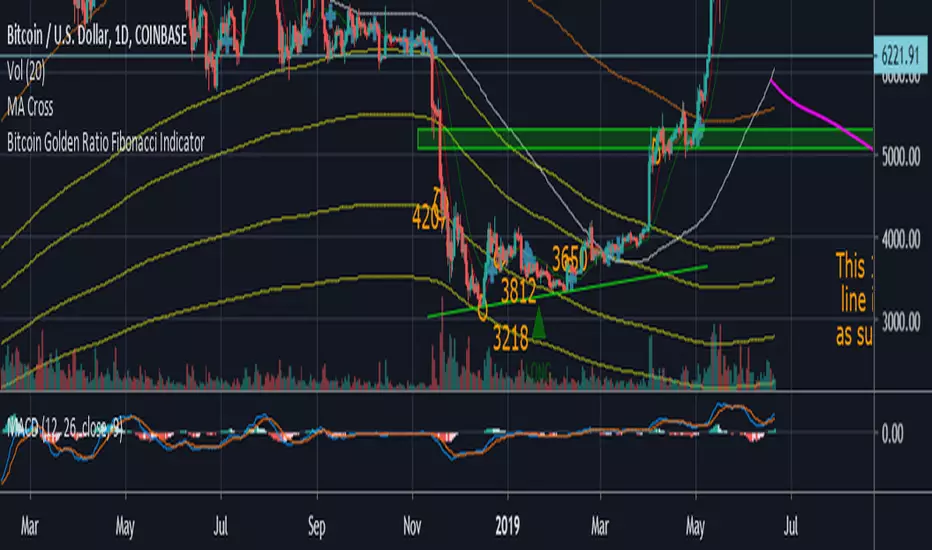
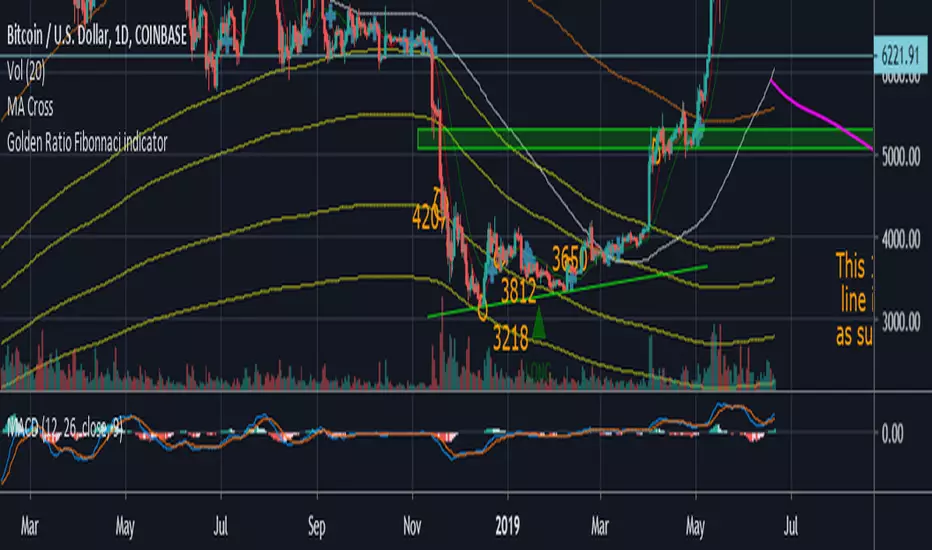
Bitcoin Golden Ratio Fibonacci IndicatorI didn't see this one already it isn't my original idea either. I pulled the formula's from an article on medium, I also added few bear market bottom fib indicators.
Credit to the article I pulled the formula from.
The Golden Ratio Multiplier
Unlocking the mathematically organic nature of Bitcoin adoption
Go to the profile of Philip Swift (@PositiveCrypto)
Philip Swift (@PositiveCrypto)
Jun 17, 2019
By Philip Swift
Release Notes: Fixed spelling error on title, added a couple long and short labels for the top and bottom indicator.
Golden Ratio Fibonacci Multipliers IndicatorBased on "The Golden Ratio Multiplier" article by Philip Swift (@PositiveCrypto) on Medium.
Golden Ratio Fibinnaci IndicatorI didn't see this one already it isn't my original idea either. I pulled the formula's from an article on medium, I also added few bear market bottom fib indicators.
Credit to the article I pulled the formula from.
The Golden Ratio Multiplier
Unlocking the mathematically organic nature of Bitcoin adoption
Go to the profile of Philip Swift (@PositiveCrypto)
Philip Swift (@PositiveCrypto)
Jun 17, 2019
By Philip Swift
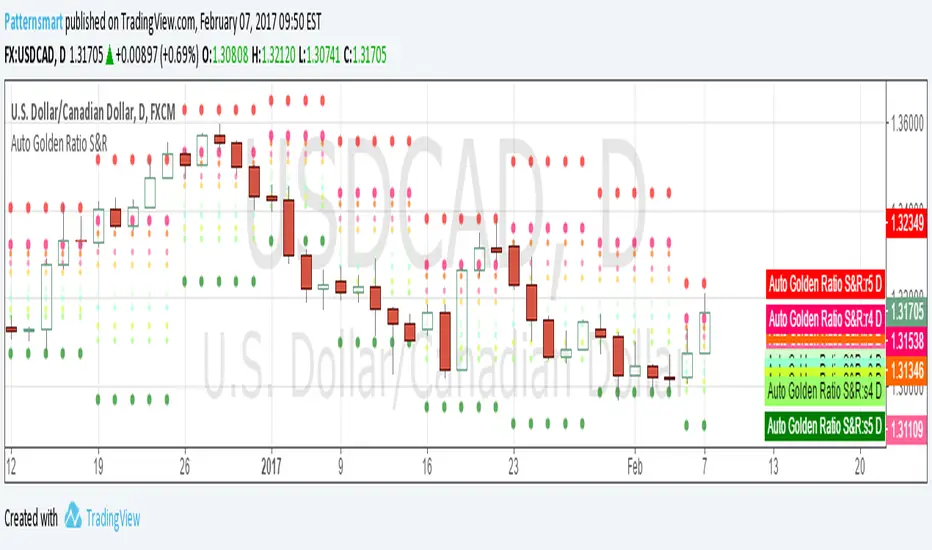
Automatic Golden Ratio Support & ResistanceThe golden ratio is also called the golden mean or golden section.
It has been used to analyze the proportions of natural objects as well as man-made systems such as financial markets.
The mathematics of the golden ratio and of the Fibonacci sequence is intimately interconnected. The Fibonacci sequence is: 1, 1, 2, 3, 5, 8, 13, 21, 34, 55, 89, 144, 233, 377, 610, 987, ....
This Golden Ratio indicator automatically plots 5 support levels and 5 resistance levels based on the golden ratio for current timeframe. It shows a possible price range for current session, you can easily identify the major and minor support/resistance levels from the chart.
The levels of support and resistance are formed at the beginning of a new session
This indicator works on all default time frames.
It will never repaint.
There is no parameter. All you need to do is to load it to your chart.
Click the image links to view it in original size.
3.bp.blogspot.com
2.bp.blogspot.com
2.bp.blogspot.com
3.bp.blogspot.com
2.bp.blogspot.com
2.bp.blogspot.com
1.bp.blogspot.com
////////////////////////////////////////////////////////////
// Technical Analysis & Research Patternsmart
//
// Custom indicators, Strategies, SCAN, Screener, Backtesting, Converting service for:
// Tradingview, NinjaTrader, Thinkorswim, MetaTrader, MetaStock, Multicharts, Prorealtime, etc.
////////////////////////////////////////////////////////////