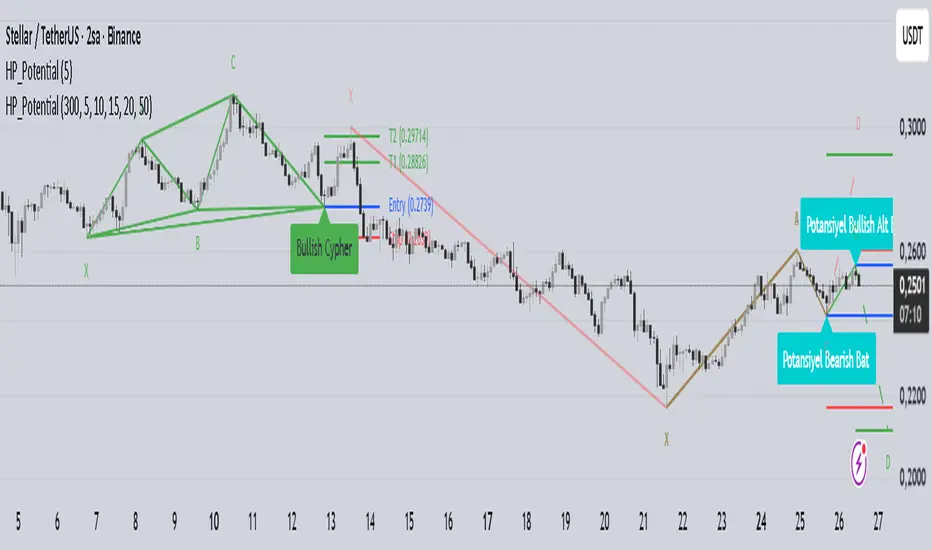
Harmonic Patterns with Potential DetectionThis indicator is designed to automatically detect commonly used Harmonic Patterns in financial markets and provide early warnings for "Potential" patterns that have not yet completed. It utilizes a Multi-ZigZag structure to analyze price movements across different timeframes simultaneously.
Key Features:
Advanced Pattern Detection:
Detects the following 8 harmonic patterns in both Bullish and Bearish directions:
Gartley
Bat
Alt Bat
Butterfly
Crab
Deep Crab
Shark
Cypher
Potential Pattern Detection (Early Warning System):
Calculates the probable D point (Entry Level) after the C point is formed, even before the pattern is fully completed, and visualizes it with dashed lines.
This feature allows traders to prepare and plan their trading strategies before the pattern completes.
Automatically plots Entry, Stop, and Target levels for potential patterns.
Multi-ZigZag Analysis:
Scans the market using 5 different ZigZag lengths (5, 10, 15, 20, 50). This allows you to see both short-term and long-term patterns on the same chart.
Each ZigZag period uses distinct color coding, making it easy to distinguish which timeframe a pattern belongs to.
User-Friendly Visuals:
Completed patterns are shown with clear lines and labels (X, A, B, C, D).
Hovering over pattern labels (Tooltip) displays detailed information including the pattern name, entry, target, and stop levels.
Only valid and active patterns are highlighted to prevent visual clutter.
Alert System:
You can set alerts for both completed patterns (when point D is formed) and potential patterns (when point C is formed).
Fully compatible with the TradingView alert system.
How to Use:
Add the indicator to your chart.
Select which patterns to scan for in the settings menu (all are selected by default).
Customize ZigZag sensitivities according to your strategy.
Dashed lines indicate "Potential" (uncompleted) opportunities, while solid lines indicate "Completed" patterns.
Disclaimer: This indicator is for educational and analytical purposes only. It does not constitute investment advice. Harmonic patterns are probability-based analysis methods and may not always yield successful results.
Harmonic Patterns
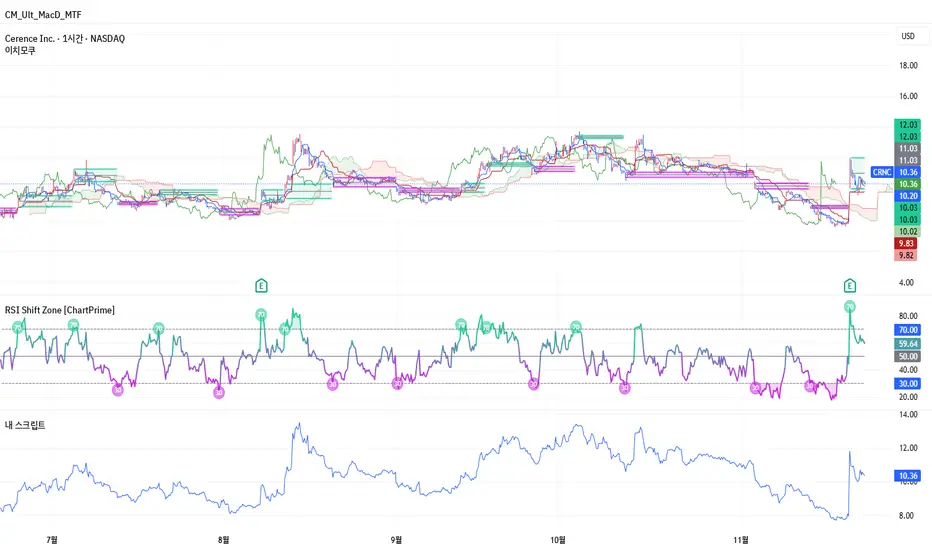
내 스크립트//@version=5
indicator("W Pattern (Double Bottom) Alert", overlay=true)
// Pivot 설정
leftBars = 3
rightBars = 3
// 피벗 로우(저점) 두 개 탐지
pLow1 = ta.pivotlow(low, leftBars, rightBars)
pLow2 = ta.pivotlow(low, leftBars, rightBars)
// 두 번째 저점이 최근 형성되었는지
secondBottom = not na(pLow2)
// W 패턴 조건
// 1) 첫 번째 저점 존재
// 2) 두 번째 저점 존재
// 3) 두 저점 사이의 고점이 존재(넥라인)
neckline = ta.highest(high, leftBars * 4)
// 두 저점 간 가격 간격 조건 (너무 벌어지면 안됨)
validSpacing = pLow2 - pLow1 < pLow1 * 0.1
// 최종 W 패턴 조건
Wpattern = secondBottom and validSpacing and close > neckline
// 차트 표시
plotshape(secondBottom, title="Second Bottom", color=color.orange, style=shape.triangleup, size=size.tiny)
plot(neckline, "Neckline", color=color.yellow)
// 알림 트리거
alertcondition(Wpattern, title="W Pattern Detected", message="W 패턴(더블 바텀) 발생!")
Smart Money Concepts [XoRonX]# Smart Money Concepts (SMC) - Advanced Trading Indicator
## 📊 Deskripsi
**Smart Money Concepts ** adalah indicator trading komprehensif yang menggabungkan konsep Smart Money Trading dengan berbagai alat teknikal analisis modern. Indicator ini dirancang untuk membantu trader mengidentifikasi pergerakan institusional (smart money), struktur pasar, zona supply/demand, dan berbagai sinyal trading penting.
Indicator ini mengintegrasikan multiple timeframe analysis, order blocks detection, fair value gaps, fibonacci retracement, volume profile, RSI multi-timeframe, dan moving averages dalam satu platform yang powerful dan mudah digunakan.
---
## 🎯 Fitur Utama
### 1. **Smart Money Structure**
- **Internal Structure** - Struktur pasar jangka pendek untuk entry presisi
- **Swing Structure** - Struktur pasar jangka panjang untuk trend analysis
- **BOS (Break of Structure)** - Konfirmasi kelanjutan trend
- **CHoCH (Change of Character)** - Deteksi potensi reversal
### 2. **Order Blocks**
- **Internal Order Blocks** - Zona demand/supply jangka pendek
- **Swing Order Blocks** - Zona demand/supply jangka panjang
- Filter otomatis berdasarkan volatilitas (ATR/Range)
- Mitigation tracking (High/Low atau Close)
- Customizable display (jumlah order blocks yang ditampilkan)
### 3. **Equal Highs & Equal Lows (EQH/EQL)**
- Deteksi otomatis equal highs/lows
- Indikasi liquidity zones
- Threshold adjustment untuk sensitivitas
- Visual lines dan labels
### 4. **Fair Value Gaps (FVG)**
- Multi-timeframe FVG detection
- Auto threshold filtering
- Bullish & Bearish FVG boxes
- Extension control
- Color customization
### 5. **Premium & Discount Zones**
- Premium Zone (75-100% dari range)
- Equilibrium Zone (47.5-52.5% dari range)
- Discount Zone (0-25% dari range)
- Auto-update berdasarkan swing high/low
### 6. **Fibonacci Retracement**
- **Equilibrium to Discount** - Fib dari EQ ke discount zone
- **Equilibrium to Premium** - Fib dari EQ ke premium zone
- **Discount to Premium** - Fib full range
- Reverse option
- Show/hide lines
- Custom colors
### 7. **Volume Profile (VRVP)**
- Visible Range Volume Profile
- Point of Control (POC)
- Value Area (70% volume)
- Auto-adjust rows
- Placement options (Left/Right)
- Width customization
### 8. **RSI Multi-Timeframe**
- Monitor 3 timeframes sekaligus
- Overbought/Oversold signals
- Visual table display
- Color-coded signals (Red OB, Green OS)
- Customizable position & size
### 9. **Moving Averages**
- 3 Moving Average lines
- Pilihan tipe: EMA, SMA, WMA
- Automatic/Manual period mode
- Individual color & width settings
- Cross alerts (MA vs MA, Price vs MA)
### 10. **Multi-Timeframe Levels**
- Support up to 5 different timeframes
- Previous high/low levels
- Custom line styles
- Color customization
### 11. **Candle Color**
- Color candles berdasarkan trend
- Bullish = Green, Bearish = Red
- Optional toggle
---
## 🛠️ Cara Penggunaan
### **A. Setup Awal**
1. **Tambahkan Indicator ke Chart**
- Buka TradingView
- Klik "Indicators" → "My Scripts" atau paste code
- Pilih "Smart Money Concepts "
2. **Pilih Mode Display**
- **Historical**: Tampilkan semua struktur (untuk backtesting)
- **Present**: Hanya tampilkan struktur terbaru (clean chart)
3. **Pilih Style**
- **Colored**: Warna berbeda untuk bullish/bearish
- **Monochrome**: Tema warna abu-abu
---
### **B. Penggunaan Fitur**
#### **1. Smart Money Structure**
**Internal Structure (Real-time):**
- ✅ Aktifkan "Show Internal Structure"
- Pilih tampilan: All, BOS only, atau CHoCH only
- Gunakan untuk entry timing presisi
- Filter confluence untuk mengurangi noise
**Swing Structure:**
- ✅ Aktifkan "Show Swing Structure"
- Pilih tampilan struktur bullish/bearish
- Adjust "Swings Length" (default: 50)
- Gunakan untuk konfirmasi trend utama
**Tips:**
- BOS = Konfirmasi trend continuation
- CHoCH = Warning untuk possible reversal
- Tunggu price retest ke order block setelah BOS
---
#### **2. Order Blocks**
**Setup:**
- ✅ Aktifkan Internal/Swing Order Blocks
- Set jumlah blocks yang ditampil (1-20)
- Pilih filter: ATR atau Cumulative Mean Range
- Pilih mitigation: Close atau High/Low
**Cara Trading:**
1. Tunggu BOS/CHoCH terbentuk
2. Identifikasi order block terdekat
3. Wait for price pullback ke order block
4. Entry saat price respek order block (rejection)
5. Stop loss di bawah/atas order block
6. Target: swing high/low berikutnya
**Color Code:**
- 🔵 Light Blue = Internal Bullish OB
- 🔴 Light Red = Internal Bearish OB
- 🔵 Dark Blue = Swing Bullish OB
- 🔴 Dark Red = Swing Bearish OB
---
#### **3. Equal Highs/Lows (EQH/EQL)**
**Setup:**
- ✅ Aktifkan "Equal High/Low"
- Set "Bars Confirmation" (default: 3)
- Adjust threshold (0-0.5, default: 0.1)
**Interpretasi:**
- EQH = Liquidity di atas, kemungkinan sweep lalu dump
- EQL = Liquidity di bawah, kemungkinan sweep lalu pump
- Biasanya smart money akan grab liquidity sebelum move besar
**Trading Strategy:**
- Wait for EQH/EQL formation
- Anticipate liquidity grab
- Entry setelah sweep dengan konfirmasi (order block, FVG, CHoCH)
---
#### **4. Fair Value Gaps (FVG)**
**Setup:**
- ✅ Aktifkan "Fair Value Gaps"
- Pilih timeframe (default: chart timeframe)
- Enable/disable auto threshold
- Set extension bars
**Cara Trading:**
1. Bullish FVG = Support zone untuk buy
2. Bearish FVG = Resistance zone untuk sell
3. Price tends to fill FVG (retest)
4. Entry saat price kembali ke FVG
5. Partial fill = valid, full fill = invalidated
**Tips:**
- FVG + Order Block = High probability setup
- Multi-timeframe FVG lebih kuat
- Unfilled FVG = strong momentum
---
#### **5. Premium & Discount Zones**
**Setup:**
- ✅ Aktifkan "Premium/Discount Zones"
- Zones akan auto-update berdasarkan swing high/low
**Interpretasi:**
- 🟢 **Discount Zone** = Area BUY (price murah)
- ⚪ **Equilibrium** = Neutral (50%)
- 🔴 **Premium Zone** = Area SELL (price mahal)
**Trading Strategy:**
- BUY dari discount zone
- SELL dari premium zone
- Avoid trading di equilibrium
- Combine dengan structure confirmation
---
#### **6. Fibonacci Retracement**
**Setup:**
- Pilih Fib yang ingin ditampilkan:
- Equilibrium to Discount
- Equilibrium to Premium
- Discount to Premium
- Toggle show lines
- Enable reverse jika perlu
- Custom colors
**Key Levels:**
- 0.236 = Shallow retracement
- 0.382 = Common retracement
- 0.5 = 50% golden level
- 0.618 = Golden ratio (penting!)
- 0.786 = Deep retracement
**Cara Pakai:**
- 0.618-0.786 = Ideal entry zone dalam trend
- Combine dengan order blocks
- Wait for confirmation candle
---
#### **7. Volume Profile (VRVP)**
**Setup:**
- ✅ Aktifkan "Show Volume Profile"
- Set jumlah rows (10-100)
- Adjust width (5-50%)
- Pilih placement (Left/Right)
- Enable POC dan Value Area
**Interpretasi:**
- **POC (Point of Control)** = Harga dengan volume tertinggi = magnet
- **Value Area** = 70% volume = fair price range
- **Low Volume Nodes** = Weak support/resistance
- **High Volume Nodes** = Strong support/resistance
**Trading:**
- POC acts as support/resistance
- Price tends to return to POC
- Breakout dari Value Area = momentum
---
#### **8. RSI Multi-Timeframe**
**Setup:**
- ✅ Aktifkan "Show RSI Table"
- Set 3 timeframes (default: chart, 5m, 15m)
- Set RSI period (default: 14)
- Set Overbought level (default: 70)
- Set Oversold level (default: 30)
- Pilih posisi & ukuran table
**Interpretasi:**
- 🟢 **OS (Oversold)** = RSI ≤ 30 = Kondisi jenuh jual
- 🔴 **OB (Overbought)** = RSI ≥ 70 = Kondisi jenuh beli
- **-** = Neutral zone
**Trading Strategy:**
1. Multi-timeframe alignment = strong signal
2. OS + Bullish structure = BUY signal
3. OB + Bearish structure = SELL signal
4. Divergence RSI vs Price = reversal warning
**Contoh:**
- TF1: OS, TF2: OS, TF3: OS + Price di discount zone = STRONG BUY
---
#### **9. Moving Averages**
**Setup:**
- Pilih MA Type: EMA, SMA, atau WMA (berlaku untuk ketiga MA)
- Pilih Period Mode: Automatic atau Manual
- Set period untuk MA 1, 2, 3 (default: 20, 50, 100)
- Custom color & width per MA
- ✅ Enable Cross Alerts
**Interpretasi:**
- **Golden Cross** = MA fast cross above MA slow = Bullish
- **Death Cross** = MA fast cross below MA slow = Bearish
- Price above all MAs = Strong uptrend
- Price below all MAs = Strong downtrend
**Trading Strategy:**
1. MA1 (20) = Short-term trend
2. MA2 (50) = Medium-term trend
3. MA3 (100) = Long-term trend
**Entry Signals:**
- Price bounce dari MA dalam trend = continuation
- MA cross dengan konfirmasi structure = entry
- Multiple MA confluence = strong support/resistance
**Alerts Available:**
- MA1 cross MA2/MA3
- MA2 cross MA3
- Price cross any MA
---
#### **10. Multi-Timeframe Levels**
**Setup:**
- Enable HTF Level 1-5
- Set timeframes (contoh: 5m, 1H, 4H, D, W)
- Pilih line style (solid/dashed/dotted)
- Custom colors
**Cara Pakai:**
- Previous high/low dari HTF = strong S/R
- Breakout HTF level = significant move
- Multiple HTF levels confluence = major zone
---
### **C. Trading Setup Combination**
#### **Setup 1: High Probability Buy (Bullish)**
1. ✅ Swing structure: Bullish BOS
2. ✅ Price di Discount Zone
3. ✅ Pullback ke Bullish Order Block
4. ✅ Bullish FVG di bawah
5. ✅ RSI Multi-TF: Oversold
6. ✅ Price bounce dari MA
7. ✅ POC/Value Area support
8. ✅ Fibonacci 0.618-0.786 retracement
**Entry:** Saat price reject dari order block dengan confirmation candle
**Stop Loss:** Below order block
**Target:** Swing high atau premium zone
---
#### **Setup 2: High Probability Sell (Bearish)**
1. ✅ Swing structure: Bearish BOS
2. ✅ Price di Premium Zone
3. ✅ Pullback ke Bearish Order Block
4. ✅ Bearish FVG di atas
5. ✅ RSI Multi-TF: Overbought
6. ✅ Price reject dari MA
7. ✅ POC/Value Area resistance
8. ✅ Fibonacci 0.618-0.786 retracement
**Entry:** Saat price reject dari order block dengan confirmation candle
**Stop Loss:** Above order block
**Target:** Swing low atau discount zone
---
#### **Setup 3: Liquidity Grab (EQH/EQL)**
1. ✅ Identifikasi EQH atau EQL
2. ✅ Wait for liquidity sweep
3. ✅ Konfirmasi dengan CHoCH
4. ✅ Order block terbentuk setelah sweep
5. ✅ Entry saat retest order block
---
### **D. Tips & Best Practices**
**Risk Management:**
- Selalu gunakan stop loss
- Risk 1-2% per trade
- Risk:Reward minimum 1:2
- Jangan over-leverage
**Confluence adalah Kunci:**
- Minimal 3-4 konfirmasi sebelum entry
- Lebih banyak konfirmasi = higher probability
- Quality over quantity
**Timeframe Analysis:**
- HTF (Higher Timeframe) = Trend direction
- LTF (Lower Timeframe) = Entry timing
- Align dengan HTF trend
**Backtesting:**
- Gunakan mode "Historical"
- Test strategy di berbagai market condition
- Record dan analyze hasil
**Market Condition:**
- Trending market = Follow BOS, use order blocks
- Ranging market = Use premium/discount zones, EQH/EQL
- High volatility = Wider stops, wait for clear structure
**Avoid:**
- Trading di equilibrium zone
- Entry tanpa konfirmasi
- Fighting the trend
- Overleveraging
- Emotional trading
---
## 📈 Recommended Settings
### **For Scalping (1m - 5m):**
- Internal Structure: ON
- Swing Structure: OFF
- Order Blocks: Internal only
- RSI Timeframes: 1m, 5m, 15m
- MA Periods: 9, 21, 50
### **For Day Trading (15m - 1H):**
- Internal Structure: ON
- Swing Structure: ON
- Order Blocks: Both
- RSI Timeframes: 15m, 1H, 4H
- MA Periods: 20, 50, 100
### **For Swing Trading (4H - D):**
- Internal Structure: OFF
- Swing Structure: ON
- Order Blocks: Swing only
- RSI Timeframes: 4H, D, W
- MA Periods: 20, 50, 200
---
## ⚠️ Disclaimer
Indicator ini adalah alat bantu analisis teknikal. Tidak ada indicator yang 100% akurat. Selalu:
- Lakukan analisa fundamental
- Gunakan proper risk management
- Praktik di demo account terlebih dahulu
- Trading memiliki resiko, trade at your own risk
---
## 📝 Version Info
**Version:** 5.0
**Platform:** TradingView Pine Script v5
**Author:** XoRonX
**Max Labels:** 500
**Max Lines:** 500
**Max Boxes:** 500
---
## 🔄 Updates & Support
Untuk update, bug reports, atau pertanyaan:
- Check documentation regularly
- Test new features in replay mode
- Backup your settings before updates
---
## 🎓 Learning Resources
**Recommended Study:**
1. Smart Money Concepts (SMC) basics
2. Order blocks theory
3. Liquidity concepts
4. ICT (Inner Circle Trader) concepts
5. Volume profile analysis
6. Multi-timeframe analysis
**Practice:**
- Start with higher timeframes
- Master one concept at a time
- Keep a trading journal
- Review your trades weekly
---
**Happy Trading! 🚀📊**
_Remember: The best indicator is your own analysis and discipline._

Auto Trend & Scalping Pro Atilla SPECIALAUTO TREND & SCALPING PRO — ATILLA SPECIAL EDITION
Auto Trend & Scalping Pro is an advanced, multi-confirmation algorithm designed for fast scalping (1m–5m) and reliable trend-following (15m–4h).
This special edition is custom-optimized for Atilla, combining EMA structure, momentum indicators, and volatility filters to generate clean, high-accuracy trading conditions.
---
🔥 Core Features
• Multi-EMA Trend Engine (13/50/200)
Analyzes the structure of the trend and generates a 0–200 Trend Power Score:
0–50 → Weak
50–100 → Medium
100–170 → Strong
170–200 → Very Strong
• 4-Indicator Confirmation Voting
The system uses:
MACD (momentum shift)
RSI (zone pressure)
STC (smooth trend phase)
ATR (volatility strength)
Each indicator votes Bull / Bear.
Total votes produce a 0–100% confirmation power.
• Sideways Market Filter
Auto-detects consolidation using:
EMA distance %
ATR volatility %
RSI 45–55 neutral zone
When sideways → All signals are blocked to avoid fake entries.
• Auto “LONG READY / SHORT READY” States
Signals activate ONLY when:
Trend is strong
Indicators confirm the direction
Market is not sideways
This eliminates noise and prevents false entries.
---
🟩 Real-Time Dashboard (Top-Right Panel)
Displays:
Market Mode (LONG READY / SHORT READY / WAIT / SIDEWAYS STOP)
EMA Power
Confirmation Strength (%)
MACD / RSI / STC / VOL status
Trend strength & filter state
All updates in real time on every candle.
---
⚡️ Scalping Optimized
Perfect for:
1 minute
3 minute
5 minute Ultra fast trend reading & correction detection.
Also stable on:
15m
30m
1H–4H (trend-following mode)
Works on all crypto pairs including BTC, ETH, BNB, SOL, AVAX, ADA, and more.
---
📌 Extra Notes
No repaint
Safe entry logic
Filters fake breakouts
Professional-grade clarity

TraderDemircan Trend Based Fibonacci + XABCD FormationDescription
TraderDemircan Trend-Based Fibonacci + XABCD Formation is an original open-source indicator that combines trend-based Fibonacci projections with an automated XABC structure detection engine.
The script focuses on identifying swing high → swing low transitions in a downtrend, generating Fibonacci levels and projecting a potential C-target extension based on harmonic geometry.
This indicator is designed for traders who want a clearer visual structure of how retracement, continuation, and harmonic projections interact inside trending markets.
🧩 What the Script Does
1. Detects the Most Recent X–A Swing (Trend High → Trend Low)
The indicator automatically scans a user-defined lookback range to identify:
X: Most recent significant swing high
A: The lowest low after X within the lookback window
This creates the foundational XA leg used for both Fibonacci levels and harmonic projections.
2. Determines a Dynamic B-Point Retracement
The script measures the market’s current retracement relative to the XA leg:
If price retraces below 0.50, B becomes the 0.50 level
If price retraces above 0.50, B becomes the 0.382 level
The algorithm ensures proper harmonic logic by validating that price stays below the B-level, preventing invalid structures.
3. Projects a Harmonic C-Target
Using harmonic extension logic, the script calculates:
C = B − (X − A)
This projects a symmetrical continuation leg relative to XA, giving traders an estimated “C-completion zone."
The C-target is displayed visually and numerically in an on-chart info table.
4. Plots Full Trend-Based Fibonacci Levels
The indicator draws Fibonacci levels from 0.0 to 2.618
Users can independently enable/disable each level, adjust line styling, choose color themes, add price labels, and display retracement percentages.
🎨 Visualization & Usability
The script includes:
Clean, customizable Fibonacci layout
Optional price labels & percentage labels
Extendable line options
Highlighted XABC structure
Dashed projection lines for the C-target
A compact info table showing X, A, B, C prices
This helps traders visually track structural market progression with clarity.
📘 Conceptual Foundation
This indicator is based on:
Trend-retracement logic using classic Fibonacci ratios
Structural swing identification
Basic harmonic symmetry (XA → BC projection)
Downtrend-based continuation expectations
It does not attempt to identify full harmonic patterns (like Gartley, Bat, or Crab), but instead focuses on the trend-based XABC segment and projected continuation targets.
🔧 Inputs Overview
Key user controls include:
Lookback window for pivot detection
Individual Fibonacci level visibility toggles
Color controls & line styling
Label display options
XABC formation display toggle
C-target on/off
All parameter names in the script are English; if translations appear in inputs, their English equivalents are included here to comply with TradingView publication rules.
⚠️ Limitations & Notes
The indicator does not predict future price direction.
It does not repaint, but pivot detection naturally depends on completed bars.
The C-projection is a geometric estimate, not a trading signal.
No forward-looking or non-causal data is used.
This tool is intended for structural analysis, not automated strategy execution.
📎 How to Use It
Add the indicator to a clean chart.
Observe the most recent X → A swing.
Watch how price interacts with 0.382 / 0.5 retracement to form the B-point.
Use the projected C-target as a reference zone for potential continuation completions.
Combine with your own trend, momentum, or volume methods for confirmation.
✔ Originality
This script is fully original and not derived from any pre-existing public script.
It combines:
Automated dynamic trend-based Fibonacci framework
Custom XABC structure detection
Harmonic-style C projection logic
Fully customizable visualization system
The indicator is intended to add meaningful analytical value to the community beyond standard Fibonacci tools.

Smart Money Flow V6 Pro📊 Smart Money Flow V6 Pro
🎯 Overview
Smart Money Flow V6 Pro is an advanced multi-timeframe indicator designed to detect institutional order flow and smart money accumulation/distribution patterns. It combines delta volume analysis, order block detection, and opening range breakout strategies to identify high-probability trading opportunities.
🔍 What Makes This Indicator Unique?
1. Proprietary Delta Flow Analysis
Unlike standard volume indicators, this script calculates:
Cumulative Delta: Tracks the net difference between buying and selling pressure over time
Delta Momentum Oscillator: Uses RSI calculation on cumulative delta to identify momentum shifts
Volume-Weighted Delta: Multiplies delta by volume-to-average-volume ratio for stronger signals
Why it matters: Standard volume indicators show only total volume. This script separates buying vs selling volume to reveal institutional footprints that retail traders miss.
2. Smart Money Divergence Detection
The indicator identifies hidden smart money activity through:
Bullish Divergence: Price makes lower lows while cumulative delta makes higher lows (institutions accumulating)
Bearish Divergence: Price makes higher highs while cumulative delta makes lower highs (institutions distributing)
Calculation Method: Compares 5-bar price movement against cumulative delta direction to spot divergences
3. Institutional Order Block Identification
Order blocks represent price levels where large institutions placed significant orders:
Bullish OB: Detected after 2+ consecutive down candles followed by a strong bullish candle (>50% of previous range)
Bearish OB: Detected after 2+ consecutive up candles followed by a strong bearish candle
Visual Display: Boxes extend right to show active zones where price may react
4. Opening Range Breakout System
Tracks the first 30 minutes (customizable) of trading:
Identifies OR High, Low, and Midpoint
Monitors breakouts/breakdowns for directional bias
Only activates after OR period completes
Usage: Helps traders align with the day's initial institutional positioning
5. Dynamic Support/Resistance
Uses pivot point detection with tolerance zones:
Stores last 5 resistance and 5 support levels
Creates zones (default 0.5% tolerance) around key levels
Updates dynamically as new pivots form
Calculation: pivothigh()/pivotlow() functions with 10-bar lookback, stored in arrays
6. Three Signal Modes for Different Trading Styles
Aggressive Mode:
Triggers: Trend alignment + positive delta momentum
Best for: Active scalpers, high-frequency trading
Signal frequency: High
Balanced Mode (Recommended):
Triggers: Trend + delta momentum threshold (>30) + confluence (divergence OR S/R OR order block)
Best for: Swing traders, position traders
Signal frequency: Medium
Conservative Mode:
Triggers: All balanced conditions + high volume + divergence confirmation
Best for: Risk-averse traders, larger positions
Signal frequency: Low but highly accurate
📈 How It Works (Technical Methodology)
Step 1: Volume Analysis
buyVolume = close > open ? volume : 0
sellVolume = close < open ? volume : 0
delta = buyVolume - sellVolume
cumDelta += delta (running total)
Step 2: Momentum Calculation
deltaMomentum = RSI(cumDelta, 14) - 50
This normalizes cumulative delta into an oscillator ranging from -50 to +50
Step 3: Trend Filter
EMA(20) determines trend direction
Signals only trigger WITH the trend (no counter-trend trades)
Step 4: Signal Generation Logic
Buy Signal (Balanced Mode):
Price > EMA(20) ✓
Delta > 0 AND cumDelta rising ✓
Volume > 1.2x average ✓
Delta Momentum > 30 ✓
At least ONE: Bullish divergence OR near support OR bullish order block ✓
Sell Signal: Opposite conditions
Step 5: Visual Confirmation
Large triangles for primary signals
Small circles for divergences
Boxes for order blocks
Lines for OR levels and S/R
🎨 Dashboard Metrics Explained
The real-time dashboard shows:
Delta: Current bar's buy/sell pressure
Cum Delta: Running total (positive = bullish bias)
Momentum: RSI-based oscillator (-50 to +50)
Trend: EMA direction
Volume: Compared to average (HIGH/NORMAL/LOW)
OR Status: Price position relative to opening range
S/R Level: Proximity to support/resistance
Order Block: Active institutional zones
Divergence: Smart money divergence status
Mode: Current signal sensitivity
Price: Current close
SIGNAL: Overall market bias (STRONG BUY/SELL/WAIT)
🔧 How to Use This Indicator
For Day Traders:
Wait for opening range to complete (default 9:15-9:45)
Use Aggressive or Balanced mode
Take signals that align with OR breakout direction
Exit at opposite order block or S/R level
For Swing Traders:
Use Conservative or Balanced mode
Enter only on divergence + signal confluence
Hold through minor pullbacks to order blocks
Trail stops below/above order blocks
For Scalpers:
Use Aggressive mode on lower timeframes (1-5 min)
Take quick profits at S/R levels
Monitor delta momentum for exhaustion
Exit if momentum crosses zero line
⚠️ Important Notes
What This Indicator Does NOT Do:
Does NOT repaint (all calculations finalize on bar close)
Does NOT use future data
Does NOT guarantee profits (no indicator does)
Originality Statement:
This indicator is NOT a simple combination of existing indicators. It features:
Custom delta calculations not available in standard volume indicators
Unique momentum oscillator using RSI on cumulative delta (not price)
Proprietary signal logic that requires multiple confluence factors
Dynamic order block detection with automatic zone management
Three-mode signal system allowing strategy customization
Why Closed Source?
The specific thresholds, weighting factors, and signal combination logic represent proprietary research. The methodology is fully disclosed above, but exact parameters are protected.
📊 Best Practices
Always use with proper risk management (2% max per trade)
Combine with price action (don't trade signals blindly)
Backtest on your specific instrument before live trading
Adjust parameters for different markets (forex, stocks, crypto)
Start with Conservative mode until familiar with signals
🔔 Alert Conditions Available
Long Signal
Short Signal
Bullish Divergence
Bearish Divergence
Bullish Order Block
Bearish Order Block
📞 Disclaimer
This indicator is for educational purposes. Past performance does not guarantee future results. Always practice proper risk management and never risk more than you can afford to lose.

ROC + dROC + d2ROC (with z-scores & percentiles)This indicator measures how price momentum is changing — not just whether it’s rising or falling, but how quickly that change itself is accelerating or slowing. It starts with the Rate of Change (ROC), which shows how much price has moved over a set period. The first derivative (ΔROC) tracks how ROC is changing from bar to bar, and the second derivative (Δ²ROC) shows whether that change is speeding up or fading — essentially the “acceleration” of momentum. Positive Δ²ROC means momentum is strengthening; negative means it’s weakening. The script also quantifies how extreme those shifts are using z-scores and percentiles, helping spot Druckenmiller-style turning points where trends often begin or end.

market geometrymarket geometry
draws po3 dealing ranges, can select po3 number and custom range multiplier
can also use volatility based dealing ranges (not tested & verified)

Pattern DetectorPattern Detector
Identifies and summarizes common chart patterns on any symbol/timeframe. Shows a compact table of the most recent confirmed patterns (up to 6), optional candle coloring that matches table row colors, and optional targets for context. Designed for analysis support only.
What it detects
Triangles and wedges, flags and pennants, head & shoulders (and inverse), rectangles, channels, broadening formations, double/triple tops & bottoms, cup & handle (and inverse), rounding tops/bottoms, diamonds, bump & run, island reversals, staircase patterns, V patterns, gaps (up/down), pipe/spike patterns, harmonic ABCD, Elliott (simplified), three drives, Quasimodo, dead cat bounce, tower top/bottom, shakeout, and Wolfe waves.
Inputs
Lookback Mode: Auto or Manual (Manual Lookback bars)
Min Confidence to Confirm: threshold for confirmation
Display: Show Pattern Table, Show Pattern Numbers, Color Pattern Candles
Style: table row colors; bullish/bearish direction colors
Notes:
Candle coloring uses the table’s row colors and requires Show Pattern Table to be enabled.
Targets are approximate and for reference only.
Alerts
Pattern Confirmed
Pattern Target Reached
Important
Educational/information tool only; not a signal generator and not financial advice.
No performance guarantees. Use with other analysis and risk management.
Calculations update in real time; confirmations happen on closed bars. Detected patterns can change intrabar; use closed‑bar alerts for greater reliability.
Results may vary by symbol, timeframe, liquidity, and volatility.

KayeDinero TrendSetter v6 - KultureMetricsScript 4 the Kulture and the Swingers
KayeDinero TrendSetter v6 – KultureMetrics is a professional-grade, multi-confirmation trading framework that combines trend, volatility, and momentum analysis into a unified signal system.
It’s optimized for equities, indices, and crypto on intraday to swing-term timeframes.
⚙️ Core Logic
The indicator merges three high-probability systems:
Simple Moving Average (SMA): defines directional bias and major trend breakouts.
Keltner Channels (KC): captures overbought/oversold volatility extremes and mean-reversion zones.
Stochastic Oscillator (STOCH): refines timing by identifying short-term momentum shifts within broader trends.
These signals are filtered by a higher-timeframe trend alignment filter (HTF), ensuring that long trades align with higher-level bullish momentum and short trades align with bearish structure.
💡 Risk & Money Management
Automatically calculates ATR-based stop loss and reward-to-risk (R:R) targets.
Dynamically computes position size based on your chosen risk % per trade.
Optional visualizations for stop and target levels (color-coded line breaks).

Harmonic Patterns Pro - Exact Ratios [abusuhil]═══════════════════════════════════════════════════════════════════
Harmonic Patterns Pro - Exact Ratios
═══════════════════════════════════════════════════════════════════
ENGLISH DESCRIPTION:
A professional harmonic pattern detector using precise Fibonacci ratios based on standard harmonic analysis reference tables.
KEY FEATURES:
• Exact Ratio System: Uses precise ratios from harmonic pattern reference tables
• Advanced Tolerance Control: Choose between 4 detection modes (All Exact, Exact+1, Exact+2, Exact+3 Flexible)
• Customizable Tolerance: Adjust exact (±3% default) and flexible (±8% default) tolerance levels
• 9 Harmonic Patterns: Gartley, Bat, Alternate Bat, Butterfly, Crab, Deep Crab, Shark, Cypher, AB=CD
• Smart ZigZag: Automatic pivot point detection
• PRZ Zones: Visual potential reversal zones
• Multiple Targets: TP1 (38.2%), TP2 (61.8%), TP3 (Point C)
• Auto Stop Loss: Calculated based on pattern structure
• Simplified Mode: Clean view with only essential signals
• Full Customization: Colors, opacity, sizes, styles
• Built-in Alerts: Notifications for pattern completion
WHAT MAKES IT DIFFERENT:
Unlike traditional harmonic indicators using approximate ratios, this indicator:
- Uses exact ratios from harmonic pattern reference tables
- Provides intelligent ratio tolerance control
- Allows mixing exact and flexible ratios
- Reduces false signals through advanced pattern matching
- Supports both conservative and aggressive trading approaches
HOW TO USE:
1. Select your preferred tolerance mode (Exact + 2 Flexible recommended for balanced detection)
2. Adjust tolerance percentages if needed
3. Enable/disable specific patterns based on your strategy
4. Customize visual settings
5. Set up alerts for automatic notifications
6. Use TP1, TP2, TP3 for profit-taking strategy
7. Place stop loss according to the SL indicator line
DISCLAIMER:
This indicator is provided for educational and informational purposes only. It should not be considered as financial advice or a recommendation to buy or sell any financial instrument. Trading involves substantial risk of loss. Always perform your own analysis, use proper risk management, and consult with a qualified financial advisor before making trading decisions. Past performance is not indicative of future results.
═══════════════════════════════════════════════════════════════════
الوصف بالعربية:
كاشف احترافي للأنماط التوافقية يستخدم نسب فيبوناتشي الدقيقة المبنية على جداول التحليل التوافقي المرجعية القياسية.
المميزات الرئيسية:
• نظام النسب الدقيقة: يستخدم نسباً دقيقة من جداول الأنماط التوافقية المرجعية
• التحكم المتقدم بالتسامح: اختر بين 4 أوضاع كشف (كل النسب دقيقة، دقيق+1، دقيق+2، دقيق+3 مرن)
• تسامح قابل للتخصيص: اضبط مستويات التسامح الدقيق (±3% افتراضي) والمرن (±8% افتراضي)
• 9 أنماط توافقية: جارتلي، خفاش، خفاش بديل، فراشة، سلطعون، سلطعون عميق، قرش، سايفر، AB=CD
• زجزاج ذكي: كشف تلقائي لنقاط الارتكاز
• مناطق PRZ: مناطق مرئية للانعكاسات المحتملة
• أهداف متعددة: TP1 (38.2%)، TP2 (61.8%)، TP3 (النقطة C)
• وقف خسارة تلقائي: يُحسب بناءً على هيكل النمط
• وضع مبسط: عرض نظيف بالإشارات الأساسية فقط
• تخصيص كامل: الألوان، الشفافية، الأحجام، الأنماط
• تنبيهات مدمجة: إشعارات لاكتمال الأنماط
ما الذي يميزه:
على عكس مؤشرات الأنماط التوافقية التقليدية التي تستخدم نسباً تقريبية، هذا المؤشر:
- يستخدم نسباً دقيقة من جداول الأنماط التوافقية المرجعية
- يوفر تحكماً ذكياً بتسامح النسب
- يسمح بمزج النسب الدقيقة والمرنة
- يقلل الإشارات الخاطئة من خلال المطابقة المتقدمة للأنماط
- يدعم أساليب التداول المحافظة والعدوانية
كيفية الاستخدام:
1. اختر وضع التسامح المفضل (دقيق + 2 مرن موصى به للكشف المتوازن)
2. اضبط نسب التسامح إذا لزم الأمر
3. فعّل/عطّل أنماط معينة بناءً على استراتيجيتك
4. خصص إعدادات العرض
5. اضبط التنبيهات للإشعارات التلقائية
6. استخدم TP1 وTP2 وTP3 لاستراتيجية جني الأرباح
7. ضع وقف الخسارة وفقاً لخط مؤشر SL
إخلاء المسؤولية:
يُقدم هذا المؤشر لأغراض تعليمية وإعلامية فقط. لا ينبغي اعتباره نصيحة مالية أو توصية لشراء أو بيع أي أداة مالية. ينطوي التداول على مخاطر كبيرة للخسارة. قم دائماً بإجراء التحليل الخاص بك، واستخدم إدارة مخاطر مناسبة، واستشر مستشاراً مالياً مؤهلاً قبل اتخاذ قرارات التداول. الأداء السابق ليس مؤشراً على النتائج المستقبلية.
═══════════════════════════════════════════════════════════════════

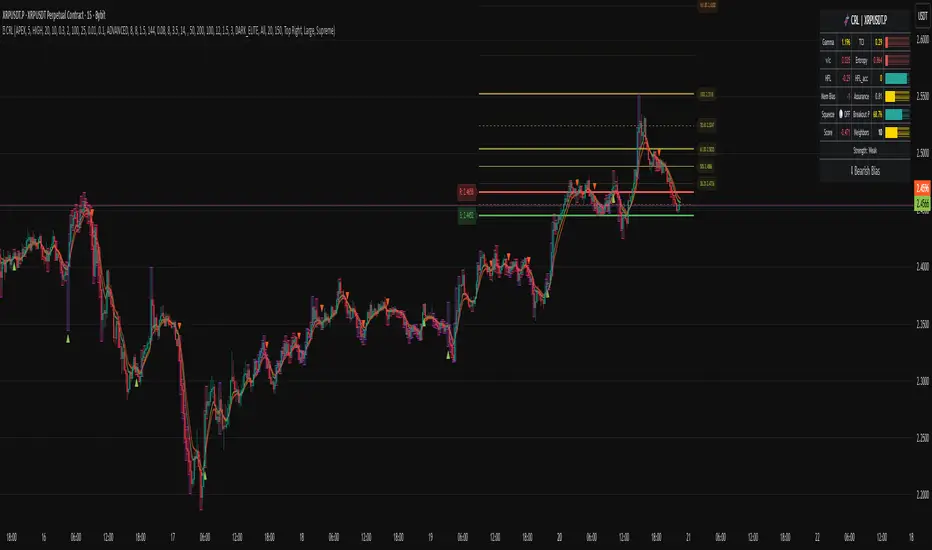
Chronos Reversal Labs🧬 Chronos Reversal Lab - Machine Learning Market Structure Analysis
OVERVIEW
Chronos Reversal Lab (CRL) is an advanced market structure analyzer that combines computational intelligence kernels with classical technical analysis to identify high-probability reversal opportunities. The system integrates Shannon Entropy analysis, Detrended Fluctuation Analysis (DFA), Kalman adaptive filtering, and harmonic pattern recognition into a unified confluence-based signal engine.
WHAT MAKES IT ORIGINAL
Unlike traditional reversal indicators that rely solely on oscillators or pattern recognition, CRL employs a multi-kernel machine learning approach that analyzes market behavior through information theory, statistical physics, and adaptive state-space estimation. The system combines these computational methods with geometric pattern analysis and market microstructure to create a comprehensive reversal detection framework.
HOW IT WORKS (Technical Methodology)
1. COMPUTATIONAL KERNELS
Shannon Entropy Analysis
Measures market uncertainty using information theory:
• Discretizes price returns into bins (user-configurable 5-20 bins)
• Calculates probability distribution entropy over lookback window
• Normalizes entropy to 0-1 scale (0 = perfectly predictable, 1 = random)
• Low entropy states (< 0.3 default) indicate algorithmic clarity phases
• When entropy drops, directional moves become statistically more probable
Detrended Fluctuation Analysis (DFA)
Statistical technique measuring long-range correlations:
• Analyzes price series across multiple box sizes (4 to user-set maximum)
• Calculates fluctuation scaling exponent (Alpha)
• Alpha > 0.5: Trend persistence (momentum regime)
• Alpha < 0.5: Mean reversion tendency (reversal regime)
• Alpha range 0.3-1.5 mapped to trading strategies
Kalman Adaptive Filter
State-space estimation for lag-free trend tracking:
• Maintains separate fast and slow Kalman filters
• Process noise and measurement noise are user-configurable
• Tracks price state with adaptive gain adjustments
• Calculates acceleration (second derivative) for momentum detection
• Provides cleaner trend signals than traditional moving averages
2. HARMONIC PATTERN DETECTION
Identifies geometric reversal patterns:
• Gartley: 0.618 AB/XA, 0.786 AD/XA retracement
• Bat: 0.382-0.5 AB/XA, 0.886 AD/XA retracement
• Butterfly: 0.786 AB/XA, 1.272-1.618 AD/XA extension
• Cypher: 0.382-0.618 AB/XA, 0.786 AD/XA retracement
Pattern Validation Process:
• Requires alternating swing structure (XABCD points)
• Fibonacci ratio tolerance: 0.02-0.20 (user-adjustable precision)
• Minimum 50% ratio accuracy score required
• PRZ (Potential Reversal Zone) calculated around D point
• Zone size: ATR-based with pattern-specific multipliers
• Active pattern tracking with 100-bar invalidation window
3. MARKET STRUCTURE ANALYSIS
Swing Point Detection:
• Pivot-based swing identification (3-21 bars configurable)
• Minimum swing size: ATR multiples (0.5-5.0x)
• Adaptive filtering: volatility regime adjustment (0.7-1.3x)
• Swing confirmation tracking with RSI and volume context
• Maintains structural history (up to 500 swings)
Break of Structure (BOS):
• Detects price crossing previous swing highs/lows
• Used for trend continuation vs reversal classification
• Optional requirement for signal validation
Support/Resistance Detection:
• Identifies horizontal levels from swing clusters
• Touch counting algorithm (price within ATR×0.3 tolerance)
• Weighted by recency and number of tests
• Dynamic updating as structure evolves
4. CONFLUENCE SCORING SYSTEM
Multi-factor analysis with regime-aware weighting:
Hierarchical Kernel Logic:
• Entropy gates advanced kernel activation
• Only when entropy < threshold do DFA and Kalman accelerate scoring
• Prevents false signals during chaotic (high entropy) conditions
Scoring Components:
ML Kernels (when entropy low):
• Low entropy + trend alignment: +3.0 points × trend weight
• DFA super-trend (α>1.5): +4.0 points × trend weight
• DFA persistence (α>0.65): +2.5 points × trend weight
• DFA mean-reversion (α<0.35): +2.0 points × mean-reversion weight
• Kalman acceleration: up to +3.0 points (scaled by magnitude)
Classical Technical Analysis:
• RSI oversold (<30) / overbought (>70): +1.5 points
• RSI divergence (bullish/bearish): +2.5 points
• High relative volume (>1.5x): +0-2.0 points (scaled)
• Volume impulse (>2.0x): +1.5 points
• VWAP extremes: +1.0 point
• Trend alignment (Kalman fast vs slow): +1.5 points
• MACD crossover/momentum: +1.0 point
Structural Factors:
• Near support (within 0.5 ATR): +0-2.0 points (inverse distance)
• Near resistance (within 0.5 ATR): +0-2.0 points (inverse distance)
• Harmonic PRZ zone: +3.0 to +6.0 points (pattern score dependent)
• Break of structure: +1.5 points
Regime Adjustments:
• Trend weight: 1.5× in trend regime, 0.5× in mean-reversion
• Mean-reversion weight: 1.5× in MR regime, 0.5× in trend
• Volatility multiplier: 0.7-1.3× based on ATR regime
• Theory mode multiplier: 0.8× (Conservative) to 1.2× (APEX)
Final Threshold:
Base threshold (default 3.5) adjusted by:
• Theory mode: -0.3 (APEX) to +0.8 (Conservative)
• Regime: +0.5 (high vol) to -0.3 (low vol or strong trend)
• Filter: +0.2 if regime filter enabled
5. SIGNAL GENERATION ARCHITECTURE
Five-stage validation process:
Stage 1 - ML Kernel Analysis:
• Entropy threshold check
• DFA regime classification
• Kalman acceleration confirmation
Stage 2 - Structural Confirmation:
• Market structure supports directional bias
• BOS alignment (if required)
• Swing point validation
Stage 3 - Trigger Validation:
• Engulfing candle (if required)
• HTF bias confirmation (if strict HTF enabled)
• Harmonic PRZ alignment (if confirmation enabled)
Stage 4 - Consistency Check:
• Anticipation depth: checks N bars back (1-13 configurable)
• Ensures Kalman acceleration direction persists
• Filters whipsaw conditions
Stage 5 - Structural Soundness (Critical Filter):
• Verifies adequate room before next major swing level
• Long signals: must have >0.25 ATR clearance to last swing high
• Short signals: must have >0.25 ATR clearance to last swing low
• Prevents trades directly into obvious structural barriers
Dynamic Risk Management:
• Stop-loss: Placed beyond last structural swing ± 2 ticks
• Take-profit 1: Risk × configurable R1 multiplier (default 1.5R)
• Take-profit 2: Risk × configurable R2 multiplier (default 3.0R)
• Confidence score: Calibrated 0-99% based on confluence + kernel boost
6. ADAPTIVE REGIME SYSTEM
Continuous market state monitoring:
Trend Regime:
• Kalman fast vs slow positioning
• Multi-timeframe alignment (optional HTF)
• Strength: ATR-normalized fast/slow spread
Volatility Regime:
• Current ATR vs 100-bar average
• Regime ratio: 0.7-1.3 typical range
• Affects swing size filtering and cooldown periods
Signal Cooldown:
• Base: User-set bars (1-300)
• High volatility (>1.5): cooldown × 1.5
• Low volatility (<0.5): cooldown × 0.7
• Post-BOS: minimum 20-bar cooldown enforced
FOUR OPERATIONAL MODES
CONSERVATIVE MODE:
• Threshold adjustment: +0.8
• Mode multiplier: 0.8×
• Strictest filtering for highest quality
• Recommended for: Beginners, large accounts, swing trading
• Expected signals: 3-5 per week (typical volatile instrument)
BALANCED MODE:
• Threshold adjustment: +0.3
• Mode multiplier: 1.0×
• Standard operational parameters
• Recommended for: General trading, learning phase
• Expected signals: 5-10 per week
APEX MODE:
• Threshold adjustment: -0.3
• Mode multiplier: 1.2×
• Maximum sensitivity, reduced cooldowns
• Recommended for: Scalping, high volatility, experienced traders
• Expected signals: 10-20 per week
INSTITUTIONAL MODE:
• Threshold adjustment: +0.5
• Mode multiplier: 1.1×
• Enhanced structural weighting, HTF emphasis
• Recommended for: Professional traders, swing positions
• Expected signals: 4-8 per week
VISUAL COMPONENTS
1. Fibonacci Retracement Levels
• Auto-calculated from most recent swing structure
• Standard levels: 0%, 23.6%, 38.2%, 50%, 61.8%, 78.6%, 100%, 127.2%, 161.8%, 200%, 261.8%
• Key levels emphasized (50%, 61.8%, 100%, 161.8%)
• Color gradient from bullish to bearish based on level
• Automatic cleanup when levels are crossed
• Label intensity control (None/Fib only/All)
2. Support and Resistance Lines
• Dynamic horizontal levels from swing clusters
• Width: 2px solid lines
• Colors: Green (support), Red (resistance)
• Labels show price and level type
• Touch-based validation (minimum 2 touches)
• Real-time updates and invalidation
3. Harmonic PRZ Boxes
• Displayed around pattern completion (D point)
• Pattern-specific colors (Gartley: purple, Bat: orange, etc.)
• Box height: ATR-based zone sizing
• Score-dependent transparency
• 100-bar active window before removal
4. Confluence Boxes
• Appear when confluence ≥ threshold
• Yellow/orange gradient based on score strength
• Height: High to low of bar
• Width: 1 bar on each side
• Real-time score-based transparency
5. Kalman Filter Lines
• Fast filter: Bullish color (green default)
• Slow filter: Bearish color (red default)
• Width: 2px
• Transparency adjustable (0-90%)
• Optional display toggle
6. Signal Markers
• Long: Green triangle below bar (tiny size)
• Short: Red triangle above bar (tiny size)
• Appear only on confirmed signals
• Includes alert generation
7. Premium Dashboard
Features real-time metrics with visual gauges:
Layout Options:
• Position: 4 corners selectable
• Size: Small (9 rows) / Normal (12 rows) / Large (14 rows)
• Themes: Supreme, Cosmic, Vortex, Heritage
Metrics Displayed:
• Gamma (DFA - 0.5): Shows trend persistence vs mean-reversion
• TCI (Trend Strength): ATR-normalized Kalman spread with gauge
• v/c (Relative Volume): Current vs average with color coding
• Entropy: Market predictability state with gauge
• HFL (High-Frequency Line): Kalman fast/slow difference / ATR
• HFL_acc (Acceleration): Second derivative momentum
• Mem Bias: Net bullish-bearish confluence (-1 to +1)
• Assurance: Confidence × (1-entropy) metric
• Squeeze: Bollinger Band / Keltner Channel squeeze detection
• Breakout P: Probability estimate from DFA + trend + acceleration
• Score: Final confluence vs threshold (normalized)
• Neighbors: Active harmonic patterns count
• Signal Strength: Strong/Moderate/Weak classification
• Signal Banner: Current directional bias with emoji indicators
Gauge Visualization:
• 10-bar horizontal gauges (█ filled, ░ empty)
• Color-coded: Green (strong) / Gold (moderate) / Red (weak)
• Real-time updates every bar
HOW TO USE
Step 1: Configure Mode and Resolution
• Select Theory Mode based on trading style (Conservative/Balanced/APEX/Institutional)
• Set Structural Resolution (Standard for fast markets, High for balanced, Ultra/Institutional for swing)
• Enable Adaptive Filtering (recommended for all volatile assets)
Step 2: Enable Desired Kernels
• Shannon Entropy: Essential for predictability detection (recommended ON)
• DFA Analysis: Critical for regime classification (recommended ON)
• Kalman Filter: Provides lag-free trend tracking (recommended ON)
• All three work synergistically; disabling reduces effectiveness
Step 3: Configure Confluence Factors
• Enable desired technical factors (RSI, MACD, Volume, Divergence)
• Enable Liquidity Mapping for support/resistance proximity scoring
• Enable Harmonic Detection if trading pattern-based setups
• Adjust base confluence threshold (3.5 default; higher = fewer, cleaner signals)
Step 4: Set Trigger Requirements
• Require Engulfing: Adds precision, reduces frequency (recommended for Conservative)
• Require BOS: Ensures structural alignment (recommended for trend-following)
• Require Structural Soundness: Critical filter preventing traps (highly recommended)
• Strict HTF Bias: For multi-timeframe traders only
Step 5: Adjust Visual Preferences
• Enable/disable Fibonacci levels, S/R lines, PRZ boxes, confluence boxes
• Set label intensity (None/Fib/All)
• Adjust transparency (0-90%) for overlay clarity
• Configure dashboard position, size, and theme
Step 6: Configure Alerts
• Enable master alerts toggle
• Select alert types: Anticipation, Confirmation, High Confluence, Low Entropy
• Enable JSON details for automated trading integration
Step 7: Interpret Signals
• Wait for triangle markers (green up = long, red down = short)
• Check dashboard for confluence score, entropy, DFA regime
• Verify signal aligns with higher timeframe bias (if using HTF setting)
• Confirm adequate space to take-profit levels (no nearby structural barriers)
Step 8: Execute and Manage
• Enter at close of signal candle (or next bar open)
• Set stop-loss at calculated level (visible in alert if JSON enabled)
• Scale out at TP1 (1.5R default), trail remaining to TP2 (3.0R default)
• Exit early if entropy spikes >0.7 or DFA regime flips against position
CUSTOMIZATION GUIDE
Timeframe Optimization:
Scalping (1-5 minutes):
• Theory Mode: APEX
• Anticipation Depth: 3-5
• Structural Resolution: STANDARD
• Signal Cooldown: 8-12 bars
• Enable fast kernels, disable HTF bias
Day Trading (15m-1H):
• Theory Mode: BALANCED
• Anticipation Depth: 5-8
• Structural Resolution: HIGH
• Signal Cooldown: 12-20 bars
• Standard configuration
Swing Trading (4H-Daily):
• Theory Mode: INSTITUTIONAL
• Anticipation Depth: 8-13
• Structural Resolution: ULTRA or INSTITUTIONAL
• Signal Cooldown: 20-50 bars
• Enable HTF bias, strict confirmations
Market Type Optimization:
Forex Majors:
• All kernels enabled
• Harmonic patterns effective
• Balanced or Institutional mode
• Standard settings work well
Stock Indices:
• Emphasis on volume analysis
• DFA critical for regime detection
• Conservative or Balanced mode
• Enable liquidity mapping
Cryptocurrencies:
• Adaptive filtering essential
• Higher volatility regime expected
• APEX mode for active trading
• Wider ATR multiples for swing sizing
IMPORTANT DISCLAIMERS
• This indicator does not predict future price movements
• Computational kernels calculate probabilities, not certainties
• Past confluence scores do not guarantee future signal performance
• Always backtest on YOUR specific instruments and timeframes before live trading
• Machine learning kernels require calibration period (minimum 100 bars of data)
• Performance varies significantly across market conditions and regimes
• Signals are suggestions for analysis, not automated trading instructions
• Proper risk management (stops, position sizing) is mandatory
• Complex calculations may impact performance on lower-end devices
• Designed for liquid markets; avoid illiquid or gap-prone instruments
PERFORMANCE CONSIDERATIONS
Computational Intensity:
• DFA analysis: Moderate (scales with length and box size parameters)
• Entropy calculation: Moderate (scales with lookback and bins)
• Kalman filtering: Low (efficient state-space updates)
• Harmonic detection: Moderate to High (pattern matching across swing history)
• Overall: Medium computational load
Optimization Tips:
• Reduce Structural Analysis Depth (144 default → 50-100 for faster performance)
• Increase Calc Step (2 default → 3-4 for lighter load)
• Reduce Pattern Analysis Depth (8 default → 3-5 if harmonics not primary focus)
• Limit Draw Window (150 bars default prevents visual clutter on long charts)
• Disable unused confluence factors to reduce calculations
Best Suited For:
• Liquid instruments: Major forex, stock indices, large-cap crypto
• Active timeframes: 5-minute through daily (avoid tick/second charts)
• Trending or ranging markets: Adapts to both via regime detection
• Pattern traders: Harmonic integration adds geometric confluence
• Multi-timeframe analysts: HTF bias and regime detection support this approach
Not Recommended For:
• Illiquid penny stocks or micro-cap altcoins
• Markets with frequent gaps (stocks outside regular hours without gap adjustment)
• Extremely fast timeframes (tick, second charts) due to calculation overhead
• Pure mean-reversion systems (unless using CONSERVATIVE mode with DFA filters)
METHODOLOGY NOTE
The computational kernels (Shannon Entropy, DFA, Kalman Filter) are established statistical and signal processing techniques adapted for financial time series analysis. These are deterministic mathematical algorithms, not predictive AI models. The term "machine learning" refers to the adaptive, data-driven nature of the calculations, not neural networks or training processes.
Confluence scoring is rule-based with regime-dependent weighting. The system does not "learn" from historical trades but adapts its sensitivity to current volatility and trend conditions through mathematical regime classification.
SUPPORT & UPDATES
• Questions about configuration or usage? Send me a message on TradingView
• Feature requests are welcome for consideration in future updates
• Bug reports appreciated and addressed promptly
• I respond to messages within 24 hours
• Regular updates included (improvements, optimizations, new features)
FINAL REMINDERS
• This is an analytical tool for confluence analysis, not a standalone trading system
• Combine with your existing strategy, risk management, and market analysis
• Start with paper trading to learn the system's behavior on your markets
• Allow 50-100 signals minimum for performance evaluation
• Adjust parameters based on YOUR timeframe, instrument, and trading style
• No indicator guarantees profitable trades - proper risk management is essential
— Dskyz, Trade with insight. Trade with anticipation.
KAB 1.2 Beta🚀 KAB 1.2 Indicator by Lastkingkoby 📈
Unlock the power of smart trading with KAB 1 – your ultimate all-in-one tool for spotting 🔑 support/resistance levels and generating 💰 gold-standard buy/sell signals! Crafted by Koby A. Brown (@Lastkingkoby), this Pine Script v5 indicator overlays directly on your charts for seamless analysis. Perfect for traders hunting for high-probability setups in volatile markets! 🌟
🔰 Key Features:
Dynamic Support & Resistance Lines 🛡️⚔️:
Automatically draws robust S/R lines using a blend of RSI, CMO (based on HMA), and pivot calculations. Watch lines evolve in real-time – they break on breaches 🚧, count bounces 🔄, and even flip roles (e.g., support turns resistance) when conditions change! Customizable timeframe for multi-TF precision. Labels show "Support Line" or "Flipped Res" with color-coded vibes (green for support 💚, orange for resistance 🟠).
Gold Prediction & Signals 🔮💹:
Powered by a sophisticated range filter with smoothed averages and multipliers, it detects trends with upward/downward counters. Get clear bar colors: lime for strong buys 🟢, red for sells 🔴, and more! Signals include:
Buy/Long 💸: Bullish conditions with SL suggestions based on lower bands.
Sell/Short 🐻: Bearish triggers with SL from upper bands.
Warning Alerts ⚠️: Spots potential failed bounces (e.g., "Short Warn" or "Long Warn") to avoid traps – ideal for risk management!
Visuals & Alerts 📊🚨:
Enjoy colorful plots: filter line in green/red/orange 🎨, high/low bands in aqua/fuchsia with translucent fills 🌈. Bar colors highlight momentum shifts. Set up alerts for new S/R lines, buys, sells, and warnings – never miss a move!
📝 How to Use:
Add to your chart and tweak inputs like S/R Timeframe, Gold Period (default 100), or Range Coeff (default 5.0) for your style.
Look for confluences: Buy near flipped support 💪, sell at resistance breakdowns 📉.
Combine with your strategy for crypto, forex, or stocks – it's overlay-friendly!
Pro Tip: Use on higher timeframes for major levels, lower for intraday scalps. Trade smart, stay profitable! 🤑📉
© Koby "Lastkingkoby" Brown – Elevate your game today! 🚀

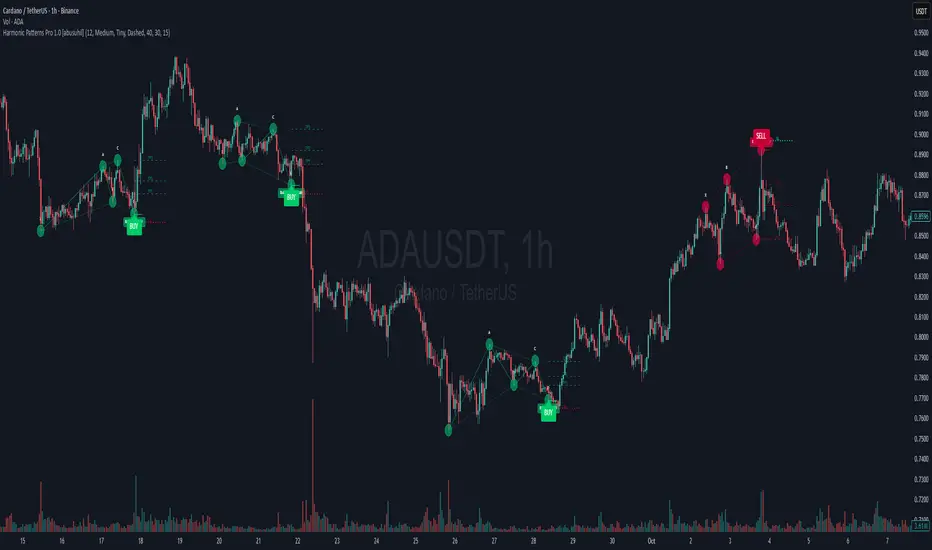
Harmonic Patterns Pro 1.0 [abusuhil]# Harmonic Patterns Pro 1.0
## 📊 Professional Harmonic Pattern Detector - All 10 Classical Models
**Harmonic Patterns Pro** is a comprehensive, non-repainting indicator that automatically detects and displays all 10 classical harmonic patterns in real-time. Built with precision and professional traders in mind, this indicator helps you identify high-probability reversal zones based on Fibonacci ratios.
---
## ✨ Key Features
### 🎯 10 Harmonic Patterns Supported
- **Gartley** - The most common harmonic pattern
- **Bat** - High accuracy with tight stop loss
- **Butterfly** - Extended pattern with strong reversal potential
- **Crab** - Extreme extension pattern (1.618 XA)
- **Deep Crab** - Deeper B retracement variant
- **Shark** - Unique C point extension pattern
- **Cypher** - C extends beyond A, tight stop loss
- **AB=CD** - Simple equal-leg pattern
- **Alternate Bat** - Bat variation with D beyond X
- **Three Drives** - Three equal impulse moves
### 🔒 100% Non-Repainting
- Patterns are drawn **only after completion** (candle close)
- Once drawn, patterns **stay permanently** on the chart
- No future data used - completely reliable for live trading
- What you see in history is what you get in real-time
### 🎚️ 5 Sensitivity Levels
Choose the detection accuracy that fits your trading style:
- **Strict (±2%)** - Highest accuracy, fewer signals
- **Medium-Strict (±5%)** - Good balance
- **Medium (±8%)** - Recommended for most traders
- **Medium-Loose (±12%)** - More patterns detected
- **Loose (±18%)** - Maximum pattern detection
### 🎨 Advanced Visual Design
- **PRZ Zone**: Automatic Potential Reversal Zone highlighting
- **Pattern Fill**: Shaded area between pattern lines for clarity
- **XABCD Points**: Clear labeling of all pivot points
- **Color Coded**: Green for bullish, red for bearish patterns
- **Customizable**: Adjust colors, opacity, line styles, label sizes
### 📈 Complete Trading System
- **Entry Signals**: Clear BUY/SELL labels at point D
- **3 Profit Targets**: TP1 (38.2%), TP2 (61.8%), TP3 (100% CD)
- **Stop Loss**: Automatically calculated and displayed
- **Entry Timing**: Option to enter at D or next candle
- **Pattern Names**: Each pattern labeled (e.g., "Bullish Bat")
### 🧹 Simplified Mode
- Toggle to hide all decorations
- Shows only: BUY/SELL signals, targets, and stop loss
- Perfect for experienced traders who want a clean chart
### 🚫 Anti-Overlap System
- **Minimum Bars Between Patterns** setting
- Prevents cluttered charts with overlapping patterns
- Ensures only the most recent, valid patterns are displayed
- Adjustable from 5 to 50 bars
### 🔔 Smart Alert System
- **3 Alert Types**: Buy Signal, Sell Signal, Any Signal
- **Signal Tester Compatible**: Works with backtesting tools
- **alertcondition()** method for TradingView alerts
- Get notified immediately when patterns complete
---
## 🚀 Quick Start Guide
### Recommended Settings (Beginners)
```
ZigZag Length: 12
Sensitivity: Medium
PRZ Opacity: 40
Fill Opacity: 30
Entry on Next Candle: false
Simplified Mode: false
Min Bars Between Patterns: 15
```
### For Live Trading
```
Entry on Next Candle: true ← Important!
```
### For Clean Charts
```
Simplified Mode: true
```
---
## 📊 Best Practices
### Timeframes
- **Best**: 4H, Daily, Weekly
- **Good**: 1H, 2H
- **Acceptable**: 15m, 30m
### Markets
Works on **all markets**: Forex, Stocks, Crypto, Commodities, Indices
### Risk Management
- Risk per trade: 1-2% of account
- Stop Loss: Use indicator's calculated SL
- Profit Targets: Scale out at TP1, TP2, TP3
- Minimum R:R: 1:2
---
## 🎓 Trading Strategies
### Strategy 1: Conservative
- Sensitivity: Strict
- Entry on Next Candle: true
- Confirm with RSI/MACD
### Strategy 2: Aggressive
- Sensitivity: Medium-Loose
- Quick entry and exit
- Scale out at TP1, TP2
### Strategy 3: Swing Trading
- Sensitivity: Strict
- Timeframe: 4H, Daily
- Hold to TP3
### Strategy 4: Multi-Timeframe
- Identify pattern on higher timeframe
- Enter on lower timeframe pattern
---
## 🔔 Setting Up Alerts
1. Right-click on chart → **"Add Alert"**
2. Condition → **"Harmonic Patterns Pro 1.0 "**
3. Choose: Buy Signal / Sell Signal / Any Signal
4. Click **"Create"**
---
## ❓ FAQ
**Q: Does this indicator repaint?**
A: No. 100% non-repainting.
**Q: What's the best sensitivity setting?**
A: Start with "Medium".
**Q: How many patterns should I expect?**
A: Daily: 1-3/month. 1H: 5-10/week.
**Q: Can I use this for backtesting?**
A: Yes! Compatible with Signal Tester.
**Q: Should I trade every pattern?**
A: No. Focus on quality setups.
**Q: What's the typical win rate?**
A: Beginners: 40-50%, Advanced: 65-75%.
---
## 🎯 Why Choose This Indicator?
✅ **Comprehensive** - All 10 patterns in one
✅ **Reliable** - 100% non-repainting
✅ **Professional** - Clean, customizable design
✅ **Complete** - Entry, targets, stop loss included
✅ **User-Friendly** - Easy to use
✅ **Flexible** - Works on all markets and timeframes
---
## ⚠️ Disclaimer
This indicator is a tool for technical analysis and should not be considered financial advice. Trading involves substantial risk of loss. Always use proper risk management and never risk more than you can afford to lose.
---
## 🏆 Final Words
**Harmonic Patterns Pro 1.0** combines classical harmonic pattern theory with modern automation. Start identifying high-probability reversal zones today!
**Version**: 1.0 | **Author**: | **Last Updated**: October 2025
**Happy Trading! 📊✨**
---
---
---
# ═══════════════════════════════════════════════════════════
# 🌟 النسخة العربية | ARABIC VERSION 🌟
# ═══════════════════════════════════════════════════════════
---
---
---
# مؤشر نماذج الهارمونيك الاحترافي 1.0
## 📊 كاشف احترافي لنماذج الهارمونيك - جميع النماذج العشرة الكلاسيكية
**مؤشر نماذج الهارمونيك الاحترافي** هو مؤشر شامل وغير معاد الرسم يكتشف ويعرض تلقائياً جميع نماذج الهارمونيك الكلاسيكية العشرة في الوقت الفعلي. تم بناؤه بدقة ومع وضع المتداولين المحترفين في الاعتبار، يساعدك هذا المؤشر على تحديد مناطق الانعكاس عالية الاحتمالية بناءً على نسب فيبوناتشي.
---
## ✨ الميزات الرئيسية
### 🎯 دعم 10 نماذج هارمونيك
- **Gartley (جارتلي)** - النموذج الأكثر شيوعاً
- **Bat (الخفاش)** - دقة عالية مع وقف خسارة ضيق
- **Butterfly (الفراشة)** - نموذج ممتد مع إمكانية انعكاس قوية
- **Crab (السلطعون)** - نموذج امتداد متطرف (1.618 XA)
- **Deep Crab (السلطعون العميق)** - نسخة أعمق من السلطعون
- **Shark (القرش)** - نموذج فريد بامتداد النقطة C
- **Cypher (السايفر)** - C تمتد بعد A، وقف خسارة ضيق
- **AB=CD** - نموذج بسيط بأرجل متساوية
- **Alternate Bat (الخفاش البديل)** - نسخة من الخفاش مع D بعد X
- **Three Drives (الدفعات الثلاث)** - ثلاث حركات دفع متساوية
### 🔒 عدم إعادة الرسم 100%
- يتم رسم النماذج **فقط بعد الاكتمال** (إغلاق الشمعة)
- بمجرد الرسم، تبقى النماذج **بشكل دائم** على الشارت
- لا يتم استخدام بيانات مستقبلية - موثوق تماماً للتداول المباشر
- ما تراه في التاريخ هو ما تحصل عليه في الوقت الفعلي
### 🎚️ 5 مستويات حساسية
اختر دقة الكشف التي تناسب أسلوب التداول الخاص بك:
- **Strict (صارم ±2%)** - أعلى دقة، إشارات أقل
- **Medium-Strict (متوسط-صارم ±5%)** - توازن جيد
- **Medium (متوسط ±8%)** - موصى به لمعظم المتداولين
- **Medium-Loose (متوسط-مرن ±12%)** - اكتشاف المزيد من النماذج
- **Loose (مرن ±18%)** - أقصى اكتشاف للنماذج
### 🎨 تصميم مرئي متقدم
- **منطقة PRZ**: تمييز تلقائي لمنطقة الانعكاس المحتملة
- **تظليل النموذج**: منطقة مظللة بين خطوط النموذج للوضوح
- **نقاط XABCD**: تسمية واضحة لجميع نقاط المحور
- **ترميز لوني**: أخضر للنماذج الصاعدة، أحمر للنماذج الهابطة
- **قابل للتخصيص**: ضبط الألوان، الشفافية، أنماط الخطوط، أحجام الملصقات
### 📈 نظام تداول كامل
- **إشارات الدخول**: ملصقات BUY/SELL واضحة عند النقطة D
- **3 أهداف ربح**: TP1 (38.2%)، TP2 (61.8%)، TP3 (100% CD)
- **وقف الخسارة**: يتم حسابه وعرضه تلقائياً
- **توقيت الدخول**: خيار للدخول عند D أو الشمعة التالية
- **أسماء النماذج**: كل نموذج مُسمى (مثل "Bullish Bat")
### 🧹 الوضع المبسط
- تبديل لإخفاء جميع الزخارف
- يعرض فقط: إشارات BUY/SELL، الأهداف، ووقف الخسارة
- مثالي للمتداولين ذوي الخبرة الذين يريدون شارت نظيف
### 🚫 نظام منع التداخل
- إعداد **الحد الأدنى من الشموع بين النماذج**
- يمنع الشارت المزدحم بالنماذج المتداخلة
- يضمن عرض النماذج الأحدث والصالحة فقط
- قابل للتعديل من 5 إلى 50 شمعة
### 🔔 نظام تنبيهات ذكي
- **3 أنواع تنبيهات**: إشارة شراء، إشارة بيع، أي إشارة
- **متوافق مع Signal Tester**: يعمل مع أدوات الاختبار الخلفي
- طريقة **alertcondition()** لتنبيهات TradingView
- احصل على إشعار فوري عند اكتمال النماذج
---
## 🚀 دليل البدء السريع
### الإعدادات الموصى بها (للمبتدئين)
```
ZigZag Length: 12
Sensitivity: Medium
PRZ Opacity: 40
Fill Opacity: 30
Entry on Next Candle: false
Simplified Mode: false
Min Bars Between Patterns: 15
```
### للتداول المباشر
```
Entry on Next Candle: true ← مهم!
```
### للشارت النظيف
```
Simplified Mode: true
```
---
## 📊 أفضل الممارسات
### الأطر الزمنية
- **الأفضل**: 4 ساعات، يومي، أسبوعي
- **جيد**: ساعة، ساعتين
- **مقبول**: 15 دقيقة، 30 دقيقة
### الأسواق
يعمل على **جميع الأسواق**: الفوركس، الأسهم، العملات الرقمية، السلع، المؤشرات
### إدارة المخاطر
- المخاطرة لكل صفقة: 1-2% من الحساب
- وقف الخسارة: استخدم SL المحسوب من المؤشر
- أهداف الربح: خذ أرباح تدريجية عند TP1، TP2، TP3
- الحد الأدنى للمخاطرة/العائد: 1:2
---
## 🎓 استراتيجيات التداول
### الاستراتيجية 1: المحافظة
- الحساسية: Strict (صارم)
- الدخول من الشمعة التالية: true
- التأكيد مع RSI/MACD
### الاستراتيجية 2: العدوانية
- الحساسية: Medium-Loose (متوسط-مرن)
- دخول وخروج سريع
- أخذ أرباح تدريجية عند TP1، TP2
### الاستراتيجية 3: السوينج
- الحساسية: Strict (صارم)
- الإطار الزمني: 4 ساعات، يومي
- الاحتفاظ حتى TP3
### الاستراتيجية 4: متعدد الأطر الزمنية
- تحديد النموذج على إطار زمني أعلى
- الدخول على نموذج إطار زمني أقل
---
## 🔔 إعداد التنبيهات
1. انقر بزر الماوس الأيمن على الشارت → **"Add Alert"**
2. الشرط → **"Harmonic Patterns Pro 1.0 "**
3. اختر: Buy Signal / Sell Signal / Any Signal
4. اضغط **"Create"**
---
## ❓ الأسئلة الشائعة
**س: هل يعيد المؤشر الرسم؟**
ج: لا. عدم إعادة الرسم 100%.
**س: ما هو أفضل إعداد للحساسية؟**
ج: ابدأ بـ "Medium" (متوسط).
**س: كم عدد النماذج المتوقعة؟**
ج: يومي: 1-3 شهرياً. ساعة: 5-10 أسبوعياً.
**س: هل يمكنني استخدامه للاختبار الخلفي؟**
ج: نعم! متوافق مع Signal Tester.
**س: هل يجب أن أتداول كل نموذج؟**
ج: لا. ركز على الإعدادات عالية الجودة.
**س: ما هو معدل الربح النموذجي؟**
ج: المبتدئون: 40-50%، المتقدمون: 65-75%.
---
## 🎯 لماذا تختار هذا المؤشر؟
✅ **شامل** - جميع النماذج العشرة في مؤشر واحد
✅ **موثوق** - عدم إعادة الرسم 100%
✅ **احترافي** - تصميم نظيف وقابل للتخصيص
✅ **كامل** - الدخول، الأهداف، ووقف الخسارة مشمولة
✅ **سهل الاستخدام** - سهل الاستخدام
✅ **مرن** - يعمل على جميع الأسواق والأطر الزمنية
---
## ⚠️ إخلاء المسؤولية
هذا المؤشر هو أداة للتحليل الفني ولا ينبغي اعتباره نصيحة مالية. التداول ينطوي على مخاطر كبيرة للخسارة. استخدم دائماً إدارة المخاطر المناسبة ولا تخاطر أبداً بأكثر مما يمكنك تحمل خسارته.
---
## 🏆 الكلمة الأخيرة
**مؤشر نماذج الهارمونيك الاحترافي 1.0** يجمع بين نظرية نماذج الهارمونيك الكلاسيكية والأتمتة الحديثة. ابدأ في تحديد مناطق الانعكاس عالية الاحتمالية اليوم!
**الإصدار**: 1.0 | **المطور**: | **آخر تحديث**: أكتوبر 2025
**تداول موفق! 📊✨**
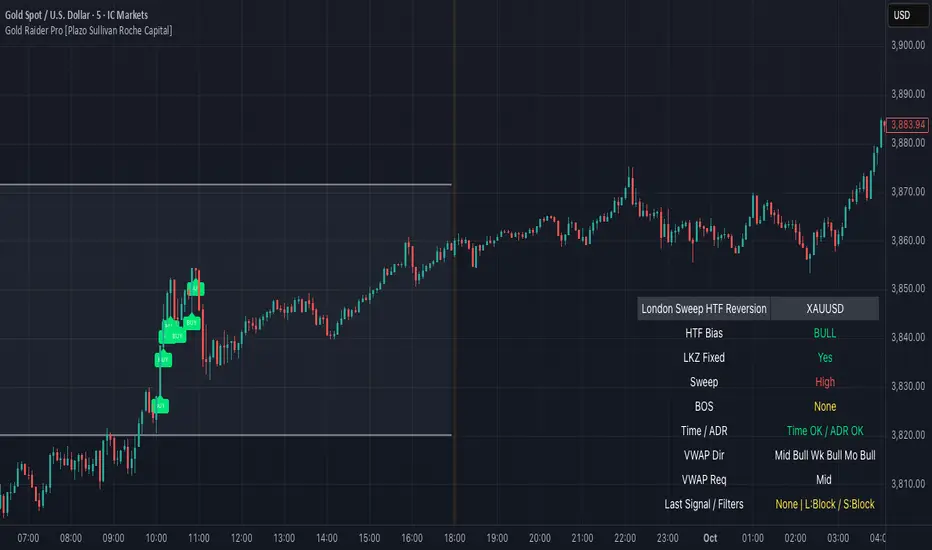
Gold Raider Pro [Plazo Sullivan Roche Capital]Core logic
During the London kill-zone, the script locks in the session high/low (LKZ).
After London ends, it looks for a liquidity sweep (price pokes beyond LKZ high/low) then a BOS (break of the first opposing swing) to confirm reversal.
Trades are only valid with higher-timeframe bias (D1 & H4 above/below EMA-50 in agreement).
Optional filters block weak signals: time gate (NY cutoff), ADR (skip if the day’s move is already stretched), and VWAP alignment (Midnight/Weekly/Monthly).
Output is a unified signal: BUY after low sweep + BOS in bull HTF, SELL after high sweep + BOS in bear HTF; labels + dashboard summarize state and reasons.
Best setup & usage
Chart & broker: XAUUSD on a high-liquidity feed (ICMarkets/FXPro/OANDA). Use 2m–5m for executions; confirm with 15m market structure.
Session: Set timezone to America/New_York. Default London kill-zone 02:30–04:30 NY; stop taking new signals after 11:00 NY (toggle in inputs).
HTF bias: Keep EMA length = 50 on D & H4 (default). Only toggle off bias if you’re deliberately testing counter-trend sweeps (not recommended live).
Structure/BOS: Use Swing Length = 3. Leave “Require BOS after the sweep” = ON for the cleanest signals; turn “Require close back inside LKZ” ON only if you want ultra-conservative entries.
VWAP filters: Keep Midnight VWAP = ON; add Weekly/Monthly only on trend days to avoid over-filtering range sessions.
ADR guardrail: Enable ADR filter once you go live; start with ADR Threshold = 0.9 and Lookback 14. This blocks chasing extended moves.
Execution playbook:
BUY: Wait for low sweep of LKZ → BOS up → dashboard shows BULL bias, Time/ADR OK, VWAP pass. Enter on the next pullback or at close; SL below BOS invalidation (or fixed 0.5–0.8× ADR14 of XAU).
SELL: Mirror logic after a high sweep in BEAR bias; SL above BOS invalidation.
TP: Scale at 1R, leave runner to 2–3R or to Midnight/Weekly VWAP touch; hard exit by NY lunchtime or on bias flip.
Risk: 0.25–0.5% per trade (XAU is spiky). One trade per direction per session; if ADR block triggers post-entry, manage to BE or flatten if structure weakens.
Alerts & dashboard: Turn on runtime alerts once parameters are set. Read the Last Signal / Filters row; only act when it shows your direction and “L:OK / S:OK” for your side.
Validation & tuning: Forward-test 3–4 weeks. If over-filtered, relax VWAP Weekly/Monthly first; if too chatty, enforce close-back-inside and keep NY cutoff tight.
Don’ts: Don’t trade during major news spikes, don’t counter the D1/H4 agreement, and don’t enter before BOS—sweeps without structure confirmation are bait.
NSF/NBF Boxes📘 NSF / NBF Extended Boxes (Wyckoff–VSA Smart Zones)
This indicator automatically detects No Supply (NSF) and No Buying / No Demand (NBF) bars using Wyckoff–VSA principles and marks them with extended boxes and a dashed 50% midline.
🟢 NSF (No Supply) — Bullish accumulation signal
🔴 NBF (No Demand) — Bearish distribution signal
Each box extends forward in time to highlight key supply/demand zones, while the dashed midline represents the equilibrium level within that bar.
When price later retests this 50% level, the script triggers a visual marker and an alert condition, helping you spot potential reversals or continuation confirmations.
🧠 Core Features
Automatic detection of No Supply / No Demand bars
Extended boxes with adjustable length and auto-extension
Midline (50%) retest alerts for precise trade timing
Optional EMA trend filter, volume check, and close bias
Works even on symbols without volume data (crypto, indices, FX)
“Test Mode” included for easy visualization and debugging
⚙️ Usage Tips
Use on 5m–4h charts for crypto or stocks to spot professional activity.
Combine with Wyckoff, VSA, or Smart Money Concepts to confirm accumulation/distribution phases.
Look for NSF retests near support in a downtrend → possible long entry.
Look for NBF retests near resistance in an uptrend → possible short entry.
🧩 Parameters
Ignore Volume: disables volume filters for markets with missing data
Use EMA Trend Filter: only confirm signals in direction of trend
Auto-extend Boxes: keeps zones projecting into future bars
Retest Alerts: triggers when price touches midline after formation
💡 Author’s Note
This tool visualizes the often-hidden behavior of smart money absorption and weak demand exhaustion.
Use it as part of a complete trading plan — not as a standalone buy/sell signal

Adaptive Square Levels (Prev + Curr Month, Configurable)
The Adaptive Square Levels (Configurable Edition) indicator dynamically plots price levels based on perfect squares — a concept derived from harmonic market behavior and geometric scaling.
Each month, the script automatically detects the new monthly open and generates square levels both above and below the opening price.
This version introduces full configurability, allowing traders to adjust how many square levels they want to visualize on either side of the base level. The indicator also visually separates previous and current month levels for easy reference.
⚙️ Features
🔢 User-Configurable Range: Choose how many levels to plot above and below the base level.
🧮 Mathematically Derived Levels: Based on perfect squares up to a user-defined max price.
📅 Monthly Auto-Reset: Automatically refreshes at the start of each new month.
🎨 Color-Coded Levels:
Orange → Major levels (square roots divisible by 3)
Yellow → Regular levels
Star (★) → Base level (nearest to monthly open)
🕰️ Dual Month Display: Shows both current and previous month levels for trend comparison.
💡 How to Use
Add the indicator to any symbol and timeframe (preferably daily or higher).
Adjust:
Max Price Level → The upper bound of your price universe.
Number of Levels Each Side → Controls the density of levels.
Observe how price reacts around these mathematically significant zones.
Use in confluence with your own price action, volume, or support/resistance analysis.
📊 Ideal For
Swing traders analyzing monthly trend reversals
Price structure and geometry enthusiasts
Traders exploring market harmonics or square-of-nine–based frameworks
🧠 Note
The script doesn’t provide buy/sell signals — it offers a structural map of key levels derived from square relationships.
Use it as a visual guide to align entries and exits with natural market geometry.

Fib Retrace + Extensions (v6– safe version) v 1🌀 Fib Extension Plus Retracement Strategy: Complete Overview
📊 Purpose and Core Idea
The Fib Extension Plus Retracement Strategy is a hybrid price-action methodology that blends Fibonacci Retracement and Fibonacci Extension tools to map high-probability entry, exit, and target zones within trending markets.
It is designed for precision timing, measured risk exposure, and trend-continuation trading.
By uniting both retracement and extension logic, traders can capture the entire lifecycle of a move — from the pullback phase to the breakout and projected expansion wave.

Harmonic Pattern Sniper PRO- Crypto Lidya🎯 Harmonic Pattern Sniper PRO (HPS PRO) — Crypto Lidya Edition
Professional Harmonic Pattern Detector, Alert & Backtest Engine
🔍 Overview
HPS PRO is a fully automated Harmonic Pattern Detection and Backtest System built for TradingView.
It detects 11 harmonic formations within seconds, draws PRZ (Potential Reversal Zone) boxes, calculates TP/SL levels, and displays performance statistics for each pattern.
📈 “HPS PRO doesn’t just detect patterns — it analyzes them statistically.”
🧩 Supported Patterns
1. Bat
2. Gartley
3. Cypher
4. Crab
5. Deep Crab
6. Butterfly
7. Shark
8. Anti-Shark
9. 5-0 Pattern
10. Nen Star
11. Navarro 200
Each pattern is detected for both bullish and bearish directions with user-defined deviation tolerances.
⚙️ Real-Time & Non-Redrawing
- Detects patterns before candle close (instant detection)
- Intrabar Hard-Lock prevents multiple detections on the same bar
- Snapshot Engine freezes entry levels — patterns never repaint in history
Real-time pattern detection before bar close with “lock” symbol
📸 Instant Detection Proof — Before & After Comparison
To demonstrate the real-time, non-repainting nature of HPS PRO, the following two screenshots show the pattern formation before and immediately after the D-bar closes.
The pattern appears live (before candle close), and the same formation remains visible after the bar closes — confirming zero repainting.
Before Candle Close (Instant Detection Preview):
After Candle Close (Confirmed Pattern, Same Structure):
💡 This comparison clearly proves that HPS PRO draws harmonic structures instantly at the D-bar without any delay or redraw.
🎯 Automated TP / SL Projection
Five Take Profit (TP1–TP5) levels and one Stop-Loss (SL) level are auto-calculated.
Two calculation engines available:
- Fibonacci Classic
- Fibonacci Custom (Crypto Lidya)
Each level has its own label, price display, and color transparency.
PRZ box and ENTRY label visually mark the potential reversal zone.
📊 Backtest Performance Panel
A fully integrated table summarizing each pattern’s success:
- Total formations detected
- SL count
- TP1–TP5 success rates
- Automatic Grand Total row
“Analyze each pattern’s win rate directly from your chart.”
🔔 Smart Alert System
- Edge-based trigger (alerts only once at the first detection)
- 3 alert categories:
1.) All Patterns (Any)
2.) Direction-Based (Bullish / Bearish)
3.) Per-Pattern alerts (e.g., Bullish Deep Crab)
Alert messages are bilingual by default:
EN: Bullish Bat detected.
TR: Boğa Bat formasyonu oluştu.
🧠 Intelligent Architecture
- Hash Pool: guarantees pattern uniqueness (no redraws)
- Snapshot Engine: locks ENTRY/BASE prices at first detection
- Garbage Collector: automatically manages drawing limits
- “Show Last Pattern” mode: displays only the latest formation
💡 Volume Intelligence
- Highlights bars with volume ≥ 2×, 3×, or 4× above average
- Paints candles by volume multiples
“Whale Alert” mode plots colored triangles for ultra-high volume bars
💼 Ideal For
✅ Technical analysts
✅ Harmonic pattern traders
✅ Algorithmic strategy developers
✅ Traders who value statistical validation
“HPS PRO ends the manual search era — every pattern, instantly and accurately.”
🔗 Developed by Crypto Lidya
🧠 “Don’t hunt patterns — let HPS PRO find them.”
📊 “Your backtest table reveals your strategy’s structure.”
🚀 “HPS PRO — The next evolution of harmonic trading.”
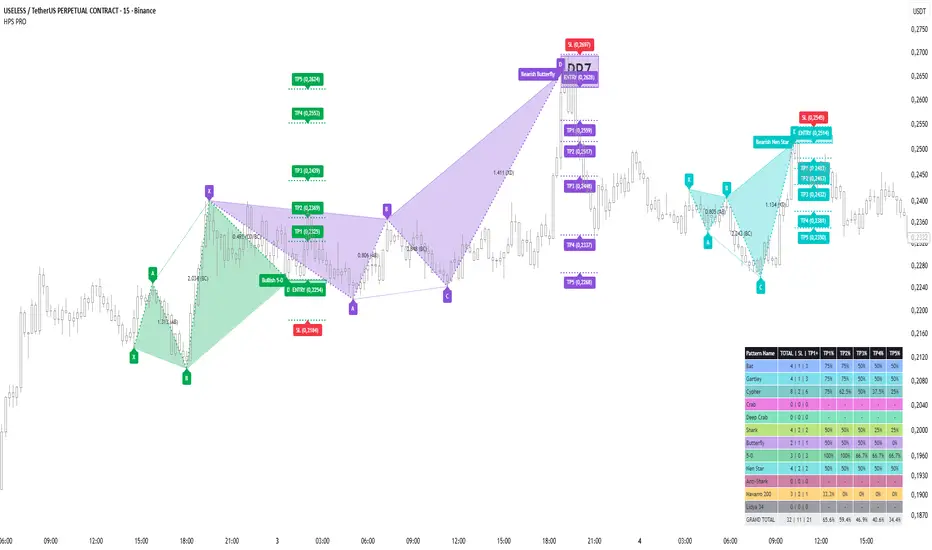
Quarterly Theory [@kaleboraciy]🧠 Daye Quarterly Theory is based on the idea that markets often move in repeating cycles. Each part of the cycle reflects a stage of the market
Consolidation
Manipulation
Distribution
Reversal/Continuation
This is a classic AMD-X pattern, which is widely used in SMC & ICT concepts. By spotting these phases, traders can better understand where the market might be heading next.
⭐ An important feature of this indicator is the Fibonacci levels, which are calculated in a clever way on the Q1 part of each cycle. You can use this levels for precise entries on manipulation in Q2
📖 Now I want to give brief description of each cycle:
Daily Cycle - the day can be broken down into 6 hour quarters
Q1 - 18:00 - 00:00 Asia.
Q2 - 00:00 - 06:00 London (True Open).
Q3 - 06:00 - 12:00 NY AM.
Q4 - 12:00 - 18:00 NY PM.
Pro tips:
Q2 often lines up with the session’s True Open - a key reference for directional bias.
Q3 tends to show the most directional momentum during the trading day.
Q4 is a critical zone for judging whether the day will extend the move or retrace.
Weekly Cycle - Daye determined that although the trading week is composed of 5 trading days, we should ignore Friday, and the small portion of Sunday’s price action:
Q1 - Monday
Q2 - Tuesday (True Open, Daily Candle Open Price).
Q3 - Wednesday.
Q4 - Thursday.
Pro tips:
Wednesday (Q3) often provides the week’s strongest directional movement - many trades target this zone.
Tuesday’s manipulation (Q2) may shake out weak positions or set up the directional swing - be careful
Thursday (Q4) helps confirm whether the weekly trend continues or reverses.
Monthly Cycle - considering that we have four weeks in a month, we start the cycle on the first Monday of the month (regardless of the calendar Day):
Q1 - Week 1: first Monday of the month.
Q2 - Week 2: second Monday of the month (True Open, Daily Candle Open Price).
Q3 - Week 3: third Monday of the month.
Q4 - Week 4: fourth Monday of the month.
I hope, that this awesome tool will boost your trading 💰

88-Key Piano Range - Musical Price Levels88-Key Piano Range - Musical Price Levels
Description:
Explore price analysis through musical harmony! This educational indicator maps price movements to the standard 88-key piano keyboard (A0 to C8), offering a creative way to visualize market ranges and explore harmonic price relationships with authentic keyboard-style background fills.
🎹 KEY FEATURES:
• Complete 88-Key Mapping - Full piano range from A0 to C8 mapped to your price range
• Piano-Style Visual Design - Clean background fills distinguishing white keys, black keys, and octaves
• Dual Anchor System - Set two time/price points to define your analytical range
• Flexible Display Options - Show all 88 keys, octaves only (C notes), or custom selections
• Harmonic Exploration - Explore consonant/dissonant key relationships based on music theory
• Real-time Price Note - See what musical note your current price represents
• Customizable Interface - Adjust colors, line widths, fills, and visual elements
🎵 EDUCATIONAL CONCEPTS:
• Octave Levels - C notes as harmonic reference points (similar to round numbers)
• Key Classifications - Natural notes (white keys) vs chromatic notes (black keys)
• Harmonic Intervals - Musical relationships applied to price analysis
• Creative Visualization - Alternative way to view price ranges and movements
⚙️ HOW TO USE:
1. Select Your Price Leg - Choose an upleg, downleg, or significant price movement to explore
2. Set Anchor A - Place at the start of your selected leg (swing low for upleg, swing high for downleg)
3. Set Anchor B - Place at the end of your selected leg (swing high for upleg, swing low for downleg)
4. Configure Display - Select all keys, octaves only, or enable background fills
5. Explore Harmonics - Enable harmony coloring to see musical relationships
6. Study Patterns - Observe how price movements align with musical intervals
🎼 CREATIVE APPLICATIONS:
• Experimental Analysis - Try a musical approach to leg analysis
• Educational Tool - Learn about mathematical relationships in both music and markets
• Alternative Perspective - View support/resistance through a musical lens
• Pattern Recognition - Explore if harmonic levels show interesting price behavior
• Fun Learning - Combine musical knowledge with trading concepts
📊 EXPERIMENTAL USE:
• Creative alternative to traditional Fibonacci levels
• Educational exploration of mathematical harmony in markets
• Interesting way to visualize price ranges and retracements
• Novel approach for musicians interested in trading concepts
Important Note: This is an educational and experimental tool that applies musical theory concepts to price analysis. It should be used for learning and exploration purposes alongside proven technical analysis methods. The musical relationships are mathematically based but not validated as reliable trading signals.
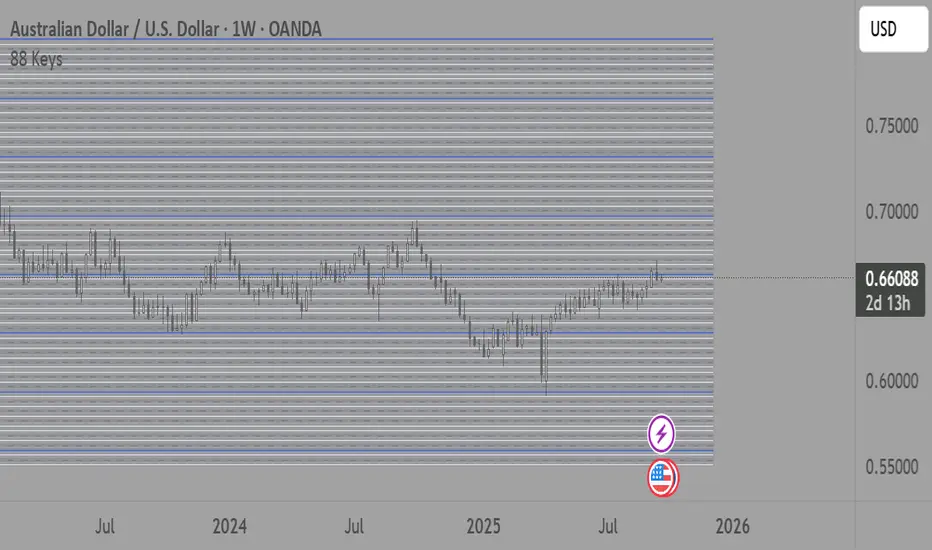
Piano Frequency LevelsPiano Frequency Levels
This indicator applies the mathematical principles of musical harmony to market analysis, creating support and resistance levels based on authentic piano frequency ratios. Drawing from centuries-old musical theory, it maps the precise mathematical relationships between piano keys to price levels.
How It Works: The indicator uses the exact frequency ratios from equal temperament tuning - the same mathematical system that makes pianos sound harmonious. Each level represents an actual piano key frequency, scaled proportionally to your chosen anchor price.
Key Features:
• Piano-Based Ratios: Uses authentic 12-tone equal temperament frequency relationships (1.05946 ratio between semitones)
• Directional Intelligence: Automatically creates ascending levels from lows (resistance) or descending levels from highs (support)
• Musical Note Labels: Optional display of actual piano key names (C4, D#5, F6, etc.) alongside price levels
• Black Key Subdivisions: Toggle authentic sharp/flat keys between natural notes for additional precision
• Octave Color Coding: Each musical octave displays in a different color for easy visual identification
• Anchor Reference: Bright green line clearly marks your C-note reference point
Musical Foundation: Every level corresponds to an actual piano key. The anchor point represents "C" (the musical root), with levels progressing through the natural musical sequence: C, D, E, F, G, A, B, then repeating in higher octaves. This creates proportional spacing that mirrors the harmonic relationships musicians have used for centuries.
Usage:
1. Set your anchor to a significant market high or low
2. Choose your desired number of levels (typically 12-24 for 1-2 octaves)
3. Enable "Add Black Keys" for additional intermediate levels
4. Enable "Show Note Names" to see which piano key each level represents
The Theory: Musical harmony is based on precise mathematical ratios that create pleasing relationships between frequencies. These same mathematical principles may manifest in market movements, as price action often exhibits proportional relationships similar to musical intervals.
Unique Advantages:
• Based on established mathematical principles rather than arbitrary ratios
• Provides both major levels (white keys) and intermediate levels (black keys)
• Automatically adapts direction based on anchor type (high vs low)
• Maintains authentic musical relationships across all timeframes and price ranges
Important Note: This indicator presents a theoretical framework for market analysis. Like all technical analysis tools, it should be used in conjunction with other forms of analysis and proper risk management. The musical ratios provide a unique perspective on potential support and resistance levels, but past performance does not guarantee future results.
Transform your charts into a musical instrument and discover the hidden harmonies in market movements.

Swings as Music - Full octaveEvery level corresponds as every note. plot it from high to low and your chart will show you the levels related to the notes vibrations.
