Supply Demand-EMA-Bollinger-Price Forecast-Zigzag [ERJUANS-TURK]1 - SUPPLY DEMAND SUPPORT RESISTANCE : Resistance and support points are automatically formed according to volume formations. Lines become thick or thin according to the volume size (rise or fall). There is a price tag on all boxes. When the price comes over the Support or Resistance breakout box, the current box turns gray (in other words, it says it is about to break).
2 - EMA : 7 EMAs have been added. (20-50-100-150-200-300-400)
3 - BOLLINGER BANDS
4- ZIGZAG & SWING HIGH LOW
5 - PRICE ACTION FORECAST : It indicates future predictions by taking past data as an example. The white candle represents the rise, the blue candle represents the fall.
In order to benefit from this indicator correctly, you need to look at the previous and next time frames, regardless of the time frame you will trade in.
Example: If there is a decrease in the 5-minute time frame, if there is an increase in the 10-15 minute time frame. What should we do then?
In the 5-minute time frame, a purchase transaction is made from the bottom of the lowest blue candle. In the 15-minute time frame, a sale transaction is made from the top of the highest white candle.
We can multiply these examples. In short, each time frame is looked at individually and the decrease or increase is seen and the transaction is made accordingly.
-----------------------------------------------------
-----------------------------------------------------
All codes have their own drawings, colors, backgrounds, etc. meticulously made. All features are in the menu without the need for a style section. An on/off checkbox has been added to all codes. You can open or close the ones you want. (Note: This indicator does not provide any guarantee information. It is only a recommendation for you.)
Highlowtrading
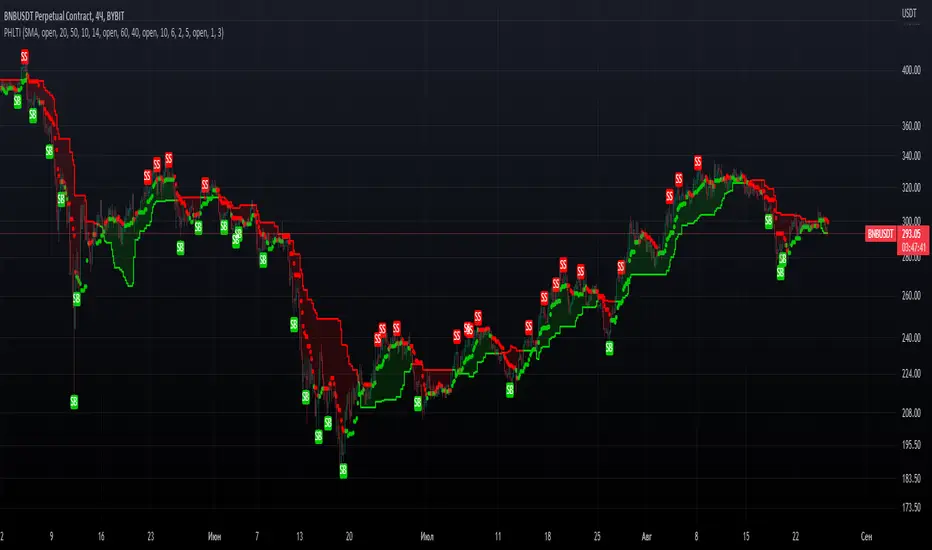
PrevHighLow Trend IndicatorPrevHighLow Trend Indicator which is calculated by using prev lowest and highest of p1 -period and p2 -period for two MAs.
First MA is made of prev highest of p1-period / prev lowest of p1-period.
Second MA is faster, made up of p2(<p1)- period(same formula).
Can be used in the next way: slower MA(straight line) shows main trend, faster shows temporary trend.
BUY, when first MA and second MA are green; Exit: second MA changes from green to red.
SELL, when first MA and second MA are red; Exit: second MA changes from red to green.
RSI Assistant basically filtres signals in the way, when signals from RSI and Faster MA are similar? it signals about it with labels: BUY for long, SELL for short. You can either enable or disable it. Also customizable so you can find your setup. RSI Assistant, depending on you customize it, can help you either follow trend or show reversals. Just find your own setup and watch things happen!
Feel free to leave valuable feedback and your setups which you consider to be good.
Hope you PHLTI usefull. Good luck!