Hull Suite by MRS**Hull Suite by MRS Strategy Indicator**
The Hull Suite by MRS Strategy is a technical analysis tool designed to provide insights into market trends using variations of the Hull Moving Average (HMA). This strategy aims to help traders identify optimal entry points for both long and short positions by utilizing multiple types of Hull-based indicators.
### Key Features:
1. **Hull Moving Average Variations**: The indicator offers three different Hull Moving Average variants:
- **HMA (Hull Moving Average)**: A fast-moving average that minimizes lag and reacts quickly to price changes.
- **EHMA (Enhanced Hull Moving Average)**: A smoother version of HMA with reduced noise, offering a clearer view of market trends.
- **THMA (Triple Hull Moving Average)**: A more complex Hull average that aims to provide a stronger confirmation of trend direction.
2. **Customizable Parameters**:
- **Source Selection**: Allows traders to choose the source for calculation (e.g., closing prices).
- **Length**: A configurable parameter to adjust the period over which the moving average is calculated (e.g., 55-period for swing entries).
- **Trend Coloring**: Users can enable automatic color-coding of the Hull moving average to reflect whether the market is in an uptrend (green) or downtrend (red).
- **Candle Color**: Option to color candles based on Hull's trend, further improving the visual clarity of trend direction.
3. **Entry and Exit Signals**:
- **Buy Signal**: Generated when the Hull moving average crosses above its historical value, indicating a potential upward price movement.
- **Sell Signal**: Triggered when the Hull moving average crosses below its historical value, signaling a potential downward price movement.
- The strategy can be customized to work with long, short, or both directions, making it adaptable for various market conditions.
4. **Visual Representation**:
- **Hull Bands**: The indicator can plot the Hull moving average as bands, with customizable transparency to suit individual preferences.
- **Band Filler**: The area between the two Hull moving averages is filled, making it easier to identify trends at a glance.
5. **Backtesting and Strategy Execution**: This strategy can be tested on historical data with adjustable backtest start and stop dates, providing traders with a better understanding of its performance before live trading.
### Purpose:
The Hull Suite by MRS Strategy is designed to assist traders in determining the optimal time to enter and exit the market based on robust Hull moving averages. With its flexibility, it can be used for trend-following, swing trading, or other strategic applications.
Hullsuite

FluxFilter Trend Strategy [BITsPIP]Hello fellow traders, I'm excited to share with you the FluxFilter Trend Strategy, a trading approach I've developed for those interested in exploring trend-following strategies. My goal was to create something straightforward and accessible, so traders looking to refine their portfolios can easily integrate its features. By the end of this guide, I hope you'll have a solid grasp of how the FluxFilter Trend Strategy functions, appreciate its benefits, understand its potential drawbacks, and see how it might fit into various trading contexts.
I) Overview
The FluxFilter Trend Strategy is tailored to align with the market's long-term trend. It examines the price data from the previous year to gauge the market's overall trajectory by employing moving averages. Subsequently, within shorter timeframes, the strategy utilizes a combination of modified Supertrend, Hull Suite, and various trend-following and filtering techniques to generate buy or sell signals. Although its advanced take profit and stop loss mechanisms might initially present a learning curve, they are integral to the strategy's effectiveness. They are designed to secure gains by capturing prevailing trends and mitigating the impact of false reversal signals.
II) Deep Backtesting
Deep backtesting stands as a cornerstone in the development of trading strategies, offering a robust method for traders to assess the performance of their strategy against historical data. This process yields a retrospective view, illustrating how the strategy might have navigated through past market fluctuations, thereby shedding light on its potential robustness and areas for refinement. However, it's crucial to acknowledge that a strategy's performance can be influenced by a myriad of factors including market dynamics, the chosen timeframe, and the inherent attributes of the traded asset. Consequently, it's advisable to conduct thorough backtesting under various conditions to ascertain the strategy's reliability before applying it to actual trading scenarios.
III) Benefits
A primary advantage of the FluxFilter Trend Strategy is its proficiency in discerning genuine market trends from mere price fluctuations, thereby avoiding premature or uncertain trades. Unlike approaches that take high risks on speculative trades, this strategy prioritizes a high degree of confidence in the direction of the trade. It meticulously waits for a clear confirmation of the market trend. Once this certainty is established, the strategy promptly generates trade signals, ensuring that traders are positioned to capitalize on optimal market entry points without delay. This approach not only enhances the potential for profit but also aligns with a disciplined and methodical trading ethos.
IV) Applications
FluxFilter Trend Strategy can be applied across various timeframes, with a particular efficacy in those under 15 minutes. Its adaptable framework means it can be customized to cater to a variety of asset classes, encompassing stocks, commodities, forex, and cryptocurrencies. Initially, the strategy was specifically calibrated for low-volatile cryptocurrencies, as reflected in the default settings for stop loss and take profit values. It's important to recognize that the unique volatility and trend patterns of your selected market necessitate careful adjustments to these parameters. This fine-tuning of profit targets and stop loss thresholds is crucial for aligning the strategy with the specific dynamics of your chosen market, which I will discuss shortly.
V) Strategy's Logic
1. Trend Identification: My conviction lies in the power of trend trading to yield long-term gains. Central to the FluxFilter Trend Strategy is the Hull Suite indicator, a tool developed by InSilico, serving as one of the confirmation indicators. This indicator acts as a compass for trend direction; a price residing above the Hull Suite line signals an uptrend, potentially marking an entry point for a buy position or confirming it. In contrast, a price positioned below this line suggests a downtrend, potentially indicating a strategic moment to sell or confirming the sell.
2. Noise Reduction: The financial markets are known for their 'noise'—short-lived price movements that can obscure the true market direction. The FluxFilter Trend Strategy is designed to sift through this noise, thereby facilitating more lucid and informed trading decisions. It employs a set of straightforward yet innovative techniques to single out significant misleading fluctuations. This is achieved by analyzing recent bars to spot bars with unusually large bodies, which often represent misleading market noise.
3. Risk Management: A key facet of the strategy is its emphasis on pragmatic risk management. Traders are empowered to establish practical stop-loss and take-profit levels, tailoring these crucial parameters to the specific market they are engaging in. This customization is instrumental in optimizing long-term profitability, ensuring that the strategy adapts fluidly to the unique characteristics and volatility patterns of different trading environments.
VI) Strategy's Input Settings and Default Values
1. Modified Supertrend
i. Factor: Serving as a multiplier in the Average True Range (ATR) calculation, this parameter adjusts the distance of the Supertrend line relative to the price chart. Elevating the factor value widens the gap between the Supertrend line and price, offering a more conservative stance. On the flip side, diminishing the factor value pulls the Supertrend line closer to the price action, heightening its sensitivity. While the preset value is 1, you have the flexibility to modify this to suit your trading approach.
ii. ATR Length: This defines the count of bars that are incorporated into the ATR computation, directly influencing the Supertrend's adaptability to market changes. With a default setting of 30 bars, it strikes a balance, smoothing over short-term fluctuations while maintaining a meaningful sensitivity to market trends. Adjusting this parameter allows you to tailor the indicator's responsiveness to suit your trading strategy, considering the volatility and behavioral patterns of the asset you are trading.
2. Hull Suite
i. Hull Suite Length: Designed for capturing long-term trends, the Hull Suite Length is configured at 1000. Functioning comparably to moving averages, the Hull Suite features upper and lower bands, though these are not employed in our current strategy.
ii. Length Multiplier: It's advisable to maintain a minimal value for the Length Multiplier, prioritizing the optimization of the Hull Suite Length. Presently, it is set to 1.
3. Filtering Indicators
i. Fluctuation Filtering Percentage: It's advisable to set this parameter to ten times the size of the average bar in your specific market, as this helps effectively mitigate the impact of market fluctuations. While the initial default is 0.4(%), based on the BTCUSDT market, it's crucial to adjust this figure to align with the characteristics of different assets or markets you're trading in.
ii. Fluctuation Filtering Bars: This parameter designates the count of preceding bars to consider when assessing market fluctuations. It's fully customizable, allowing you to tailor it based on your market insights. The preset default is 3, a balance chosen to minimize susceptibility to potentially misleading signals.
iii. Trend Confirmation Percentage: This metric is pivotal for verifying the viability of a trend post-entry. If the trade doesn't achieve this percentage in profit, it indicates a deviation from the expected trend. Under such circumstances, it may be prudent to exit the trade prematurely rather than awaiting the stop-loss trigger. It's recommended to set this parameter at half the size of the average candle body for the market you're analyzing. The initial default is set at 0.2(%).
4. StopLoss and TakeProfit
i. StopLoss and TakeProfit Settings: Two distinct approaches are available. Semi-Automatic StopLoss/TakeProfit Setting and Manual StopLoss/TakeProfit Setting. The Semi-Automatic mode streamlines the process by allowing you to input values for a 5-minute timeframe, subsequently auto-adjusting these values across various timeframes, both lower and higher. Conversely, the Manual mode offers full control, enabling you to meticulously define TakeProfit values for each individual timeframe.
ii. TakeProfit Threshold # and TakeProfit Value #: Imagine this mechanism as an ascending staircase. Each step represents a range, with the lower boundary (TakeProfit Value) designed to close the trade upon being reached, and the upper boundary (TakeProfit Threshold) upon being hit, propelling the trade to the next level, and forming a new range. This stair-stepping approach enhances risk management and has the potential to increase profitability. The pre-set configurations are tailored for volatile markets, such as BTCUSDT. It's advisable to devote time to tailoring these settings to your specific market, aiming to achieve optimal results based on backtesting.
iii. StopLoss Value: In line with its name, this value marks the limit of loss you're prepared to accept should the market trend go against your expectations. It's crucial to note that once your asset reaches the first TakeProfit range, the initial StopLoss value becomes obsolete, supplanted by the first TakeProfit Value. The default StopLoss value is pegged at 1.8(%), a figure worth considering in your trading strategy.
VII) Entry Conditions
The principal element that triggers the signal is the Modified Supertrend. Additional indicators serve as confirmatory tools. Nonetheless, to refine your strategy effectively, it's crucial to fine-tune the parameters. This involves adjusting input variables such as take profit levels, threshold parameters, and the filtering values discussed previously.
VIII) Exit Conditions
The strategy stipulates exit conditions primarily governed by stop loss and take profit parameters. On infrequent occasions, if the trend lacks confirmation post-entry, the strategy mandates an exit upon the issuance of a reverse signal (whether confirmed or unconfirmed) by the strategy itself.
Good Luck!!

[blackcat] L4 Adaptive Hull Suite 4HLevel: L4
Function Description:
The L4 Adaptive Hull Suite 4H aims to help traders identify trend reversals and trade signals using various moving averages and indicators. The script is designed to be adaptable and customizable, allowing traders to tweak the settings to suit their individual preferences and trading styles.
At its core, the script uses the hybrid Hull Moving Average (HHMA), a popular technical indicator that aims to reduce lag and noise while improving the accuracy of moving average signals. The HHMA is combined with a reverse chop indicator, which helps identify trend reversals by measuring the volatility of the market and comparing it to a set threshold.
In addition to the HHMA and reverse chop indicators, the script also includes customized open-close cross (OCC) conditions and a hybrid Hull Moving Average (Hybrid Hull MA). The OCC conditions allow traders to generate buy and sell signals based on the cross of the open and close prices, while the hybrid Hull MA combines the HHull MA with other moving averages to provide a more accurate and reliable trend-following signal.
Traders can adjust the settings of the script to suit their trading style and risk appetite. For instance, the chop length, ATR length, and reverse chop threshold can be customized to identify trend reversals more accurately, while the Hull MA length can be adjusted to provide a faster or slower response to price changes.
Overall, the L4 Adaptive Hull Suite 4H is a powerful and flexible Pine script that can help traders identify trend reversals and generate accurate buy and sell signals. With its customizable settings and reliable indicators, the script can be a valuable addition to any trader's toolkit.
About Time Frame:
The L4 Adaptive Hull Suite 4H is specifically designed for use on the 4-hour time frame and is particularly well-suited for trading the BTCUSDT.P trading pair. The script combines various technical indicators, including the Adaptive Hull Moving Average (AHMA) and the reverse chop indicator, to help identify trend reversals and generate accurate buy and sell signals.
Traders who are interested in using the L4 Adaptive Hull Suite 4H should be aware that it is optimized for use on the 4-hour time frame. While it may work on other time frames, the signals generated may not be as reliable as those generated on the 4-hour chart. Additionally, the script is specifically designed for use on the BTCUSDT.P trading pair, and may not be as effective on other trading pairs.
Overall, the L4 Adaptive Hull Suite 4H is a powerful and adaptable Pine script that can help traders identify trend reversals and generate accurate buy and sell signals. With its focus on the 4-hour time frame and the BTCUSDT.P trading pair, the script can be a valuable tool for traders who are looking to improve their trading results on this particular asset.
Choppiness Sensitive
The L4 Adaptive Hull Suite 4H includes a choppiness detection feature that helps traders identify whether the market is trending strongly or moving sideways. When the market is trending strongly, the background color of the chart will turn blue, indicating an active buy or sell signal. Conversely, when the market is moving sideways, the script will ignore any buy or sell signals generated by the OCC or Hull MA conditions.
The choppiness detection feature is based on the reverse chop indicator, which measures the volatility of the market and compares it to a set threshold. When the chop value is above the threshold, the market is considered to be in a sideways or choppy phase, and the script will not generate any buy or sell signals. However, when the chop value is below the threshold, the market is considered to be trending strongly, and the script will generate active buy or sell signals based on the OCC or Hull MA conditions.
Overall, the choppiness detection feature is a valuable addition to the L4 Adaptive Hull Suite 4H, as it helps traders identify the optimal times to enter and exit the market. By focusing on strong trends and ignoring sideways movement, traders can improve their trading results and minimize their risk of losses.
Divergence Detection and Alerts
The L4 Adaptive Hull Suite 4H is a powerful Pine script that can produce divergence labels and TradingView alerts using the built-in alert() function. This allows traders to receive real-time notifications when the script generates a buy or sell signal, making it easier to stay on top of market movements and take advantage of profitable trading opportunities.
To set up alerts, traders can simply add the alert() function to the script and specify the conditions that should trigger the alert. For instance, traders may want to receive an alert when the script generates a buy signal based on the OCC conditions, or when the Hull MA crosses above or below a certain level.
In addition to alerts, the script can also produce divergence labels, which can help traders identify potential trend reversals and generate more accurate buy and sell signals. Divergence labels are based on the difference between the script's indicators and the price action of the asset being traded, and can provide valuable insights into the underlying market dynamics.
Overall, the L4 Adaptive Hull Suite 4H is a versatile and customizable script that can help traders identify trend reversals and generate accurate buy and sell signals. With its ability to produce alerts and divergence labels, the script can be a valuable tool for traders who are looking to stay on top of market movements and take advantage of profitable trading opportunities.

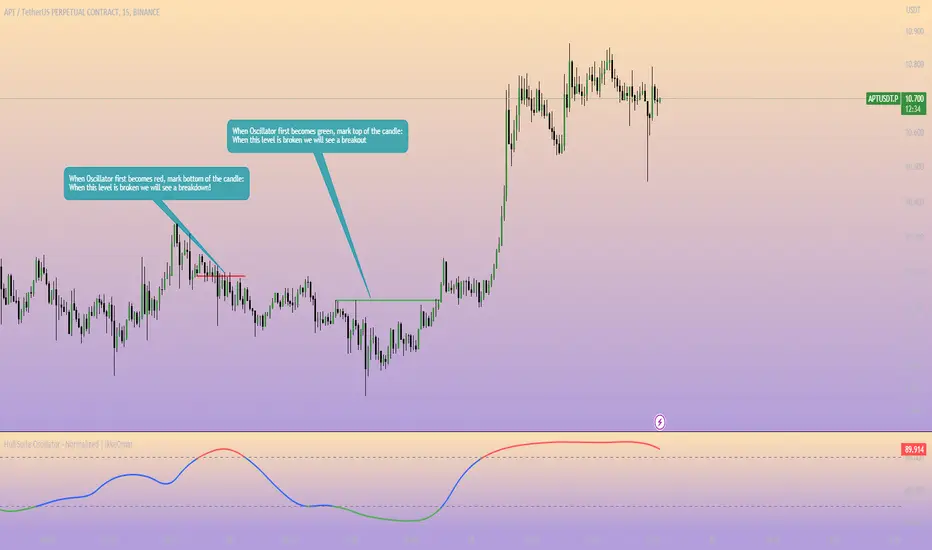
Hull Suite Oscillator - Normalized | IkkeOmarThis script is based off the Hull Suite by @InSilico.
I made this script to provide and calculate the Hull Moving Average (HMA) based on the chosen variation (HMA, TMA, or EMA) and length to then normalize the HMA values to a range of 0 to 100. The normalized values are further smoothed using an exponential moving average (EMA).
The smoothed oscillator is plotted as a line, where values above 80 are colored red, values below 20 are colored green, and values between 20 and 80 are colored blue. Additionally, there are horizontal dashed lines at the levels of 20 and 80 to serve as reference points.
Explanation for the code:
The script uses the close price of the asset as the source for calculations. The modeSwitch parameter allows selecting the type of Hull variation: Hma, Thma, or Ehma. The length parameter determines the calculation period for the Hull moving averages. The lengthMult parameter is used to adjust the length for higher timeframes. The oscSmooth parameter determines the lookback period for smoothing the oscillator.
There are three functions defined for calculating different types of Hull moving averages: HMA, EHMA, and THMA. These functions take the source and length as inputs and return the corresponding Hull moving average.
The Mode function acts as a switch and selects the appropriate Hull variation based on the modeSwitch parameter. It returns the chosen Hull moving average.
The script calculates the Hull moving averages using the selected mode, source, and length. The main Hull moving average is stored in the _hull variable, and aliases are created for the main Hull moving average (HULL), the main Hull value (MHULL), and the secondary Hull value (SHULL).
To create the normalized oscillator values, the script finds the highest and lowest values of the Hull moving average within the specified length. It then normalizes the Hull values to a range of 0 to 100 using a formula. This normalized oscillator represents the strength of the trend.
To smooth out the oscillator values, an exponential moving average is applied using the oscSmooth parameter.
The smoothed oscillator is plotted as a line chart. The line color is determined based on the oscillator value using conditional statements. If the oscillator value is above or equal to 80, the line color is set to red. If it is below or equal to 20, the color is green. Otherwise, it is blue. The linewidth is set to 2.
Additionally, two horizontal reference lines are plotted at levels 20 and 80 for visual reference. They are displayed in gray and dashed style.
Hull Butterfly Oscillator [LuxAlgo]The Hull Butterfly Oscillator (HBO) is an oscillator constructed from the difference between a regular Hull Moving Average (HMA) and another with coefficients flipped horizontally.
Levels are obtained from cumulative means of the absolute value of the oscillator. These are used to return dots indicating potential reversal points.
Settings
Length: Number of past price inputs processed by the oscillator.
Levels Multiplier: Determine how far the levels are from 0.
Src: Input source of the indicator.
Usage
The oscillator can be used like most available oscillators. The sign of the HBO allows determining the current trend direction, while divergences with price might indicate potential reversals.
The displayed levels can additionally indicate whether the market is overbought or oversold. When the direction of the oscillator changes while being above the upper or lower level a red dot (if above upper level) or green dot (if under lower level) will be displayed, indicating a potential reversal.
Details
The name of the indicator is directly derived behind the coefficients used for its calculation. Displaying regular Hull coefficients alongside those flipped horizontally slightly resemble a butterfly, the difference between these sets of coefficients allows obtaining the HBO.
This operation allows to obtain a more structured impulse response, potentially giving less undesired performances on the frequency domain compared to simpler operation involving subtracting the HMA to a SMA, EMA or WMA.

Fancy Bars v.02.07Hello Lads,
this is the mandatory description to not get this indicator banned by tradingview. :-)
So what you can basically see are different types of colored candles and some weird signs below and above the candles.
In this picture you can see all features that the indicator is providing at the moment of the relase. More to come soon anon.
As first we got different color settings for different candles.
There are two different types of color candles.
Casual Extensions of the source you have chosen in the settings are either green or red by default.
If the market extends a little more, the bars are being colored either blue or purple.
These candles work well to identifiy local exhaustion points after a rallye to the up or the down side. But you can also take them as an entry.
For Example:
A green or blue extension appears after a significant drop in price. Candles like these are usually a first sign of a local bottom to form or a bounce to appear.
In order to view green and blue bars at the opposite, you can take them as an exit for your long after a rally, because the market tends to be exhausted afterwards.
It works the same way for the red and purple bars as you can see here. I hope the screenshot can make that clear aswell. :-)
So on the screenshots you can see aswell many different signs below and above the candles.
Candles with an "F" below or above the candle are showing you that the Fisher Transform indicator has made a turnover.
So this basically means that if there is a green "F" below a bar the value of the Fischer Oscillator is smaller then - 3 and the fast line is crossing the slow line, which is bullish.
If you see a "F" above a candle, this means that the slow line is crossing the fast line and the value of the fisher transform is greater then 3.
If you see an "H" above or below the candle this means that the Indicator "Hull Suite by InSilico" is turning over.
If the "H" is red and above the candle it´s a bearish sign, if it´s green and below the candle, it is a bullish sign.
Well as next we have these white colored "X" appearing form time to time.
Well X stands basically for EXIT.
We have calculated the difference from the current price to a selectable EMA / MA and if the percentage difference in market is bigger then the selected value in the menu, the market will simply print an "X" where you can exit your long or short position.
We recommand to use this function, espacially as all other functions aswell, only for scalping purposes, to catch a possible reversion of the price.
Here you can see the menu at it´s full beauty. You can select every mode and adjust your settings for your personal preferences.
gyazo.com
gyazo.com
You can even chose different modes for the extension bars, which are currently being tested. If you got some feedback, please let us know!
The "Vanilla" mode of the extension bars takes the volume from the current chart that you are looking at. So this mode basically works for all in TradingView existing markets where chart provides you volume.
The second mode aggregates Spot and Perpetual Volume from the biggest exchanges. We recommand to use this and the other modes (except vanilla ofc) only for BTC and ETH.
Furthermore we took the provided Open Interest from Binance to calculate the bars. It is as all the other things aswell highly experimental and hasn´t been tested a lot yet.
Last but not least, we calculated from the given Open Interest by Binance a CVD for BTC and ETH, which expansions are also being plotted as the previous explained candles.
gyazo.com
You can also change the length and the type of the AVG that is being calculated for the bar coloring. As well as for the Exit Bars and the Hull Suite.
gyazo.com
gyazo.com
gyazo.com
For this Project we have used Public Source Code by @InSilico for the HullSuite and ressources by Tradingview for the Fisher Turnover feature.

Boom Hunter + Hull Suite + Volatility Oscillator StrategyTRADE CONDITIONS
Long entry:
Boom Hunter (leading indicator): Trigger line crosses over Quotient 2 line (white cross over red)
Hull Suite (trend confirmation): Price closed above hull suite line and hull suite is green (represented by horizontal line at -10 in strategy pane)
Volatility Oscillator (volatility confirmation): Volatility spike trigger line is above upper band (represented by horizontal line at -30 in strategy pane)
Short entry:
Boom Hunter (leading indicator): Trigger line crosses under Quotient 2 line (white cross under red)
Hull Suite (trend confirmation): Price closed below hull suite line and hull suite is red (represented by horizontal line at -10 in strategy pane)
Volatility Oscillator (volatility confirmation): Volatility spike trigger line is below lower band (represented by horizontal line at -30 in strategy pane)
Risk management:
Each trade risks 3% of account (configurable in settings)
SL size determined by swing low/high of previous X candles (configurable in settings) or 1 ATR if swing is less than 1 ATR
TP is calculated by Risk:Reward ratio (configurable in settings)
TIPS
Timeframe: I have found good results running on BTC/USDT 5M chart
Note: To help visual identification of trade entries and exits you may wish to add the Hull Suite and Volatility Oscillator to the chart separately. It was not possible to display them in a clear way within a single panel for the strategy. Make sure you set the settings of the auxiliary indicators to match what is in the settings of this indicator if you do decide to add them.
CREDITS
Boom Hunter Pro by veryfid
Hull Suite by InSilico
Volatility Oscillator by veryfid

Hull Suite + Stoch RSI Strategy v1.1 This strategy uses Hull Suite with Stoch RSI
Uses Hull Suite as trend and only trades with the direction of the trend.
Entry conditions:
Hull Suite as a trend
Stoch RSI overbought for short entries & oversold for long entries
Current parameters works best on BINANCE:BNBBUSDPERP pair.
