Enhanced Ichimoku Cloud Strategy V1 [Quant Trading]Overview
This strategy combines the powerful Ichimoku Kinko Hyo system with a 171-period Exponential Moving Average (EMA) filter to create a robust trend-following approach. The strategy is designed for traders seeking to capitalize on strong momentum moves while using the Ichimoku cloud structure to identify optimal entry and exit points.
This is a patient, low-frequency trading system that prioritizes quality over quantity. In backtesting on Solana, the strategy achieved impressive results with approximately 3600% profit over just 29 trades, demonstrating its effectiveness at capturing major trend movements rather than attempting to profit from every market fluctuation. The extended parameters and strict entry criteria are specifically optimized for Solana's price action characteristics, making it well-suited for traders who prefer fewer, higher-conviction positions over high-frequency trading approaches.
What Makes This Strategy Original
This implementation enhances the traditional Ichimoku system by:
Custom Ichimoku Parameters: Uses non-standard periods (Conversion: 7, Base: 211, Lagging Span 2: 120, Displacement: 41) optimized for different market conditions
EMA Confirmation Filter: Incorporates a 171-period EMA as an additional trend confirmation layer
State Memory System: Implements a sophisticated memory system to track buy/sell states and prevent false signals
Dual Trade Modes: Offers both traditional Ichimoku signals ("Ichi") and cloud-based signals ("Cloud")
Breakout Confirmation: Requires price to break above the 25-period high for long entries
How It Works
Core Components
Ichimoku Elements:
-Conversion Line (Tenkan-sen): 7-period Donchian midpoint
-Base Line (Kijun-sen): 211-period Donchian midpoint
-Span A (Senkou Span A): Average of Conversion and Base lines, plotted 41 periods ahead
-Span B (Senkou Span B): 120-period Donchian midpoint, plotted 41 periods ahead
-Lagging Span (Chikou Span): Current close plotted 41 periods back
EMA Filter: 171-period EMA acts as a long-term trend filter
Entry Logic (Ichi Mode - Default)
A long position is triggered when ALL conditions are met:
Cloud Bullish: Span A > Span B (41 periods ago)
Breakout Confirmation: Current close > 25-period high
Ichimoku Bullish: Conversion Line > Base Line
Trend Alignment: Current close > 171-period EMA
State Memory: No previous buy signal is still active
Exit Logic
Positions are closed when:
Ichimoku Bearish: Conversion Line < Base Line
Alternative Cloud Mode
When "Cloud" mode is selected, the strategy uses:
Entry: Span A crosses above Span B with additional cloud and EMA confirmations
Exit: Span A crosses below Span B with cloud and EMA confirmations
Default Settings Explained
Strategy Properties
Initial Capital: $1,000 (realistic for average traders)
Position Size: 100% of equity (appropriate for backtesting single-asset strategies)
Commission: 0.1% (realistic for most brokers)
Slippage: 3 ticks (accounts for realistic execution costs)
Date Range: January 1, 2018 to December 31, 2069
Key Parameters
Conversion Periods: 7 (faster than traditional 9, more responsive to price changes)
Base Periods: 211 (much longer than traditional 26, provides stronger trend confirmation)
Lagging Span 2 Periods: 120 (custom period for stronger support/resistance levels)
Displacement: 41 (projects cloud further into future than standard 26)
EMA Period: 171 (long-term trend filter, approximately 8.5 months of daily data)
How to Use This Strategy
Best Market Conditions
Trending Markets: Works best in clearly trending markets where the cloud provides strong directional bias
Medium to Long-term Timeframes: Optimized for daily charts and higher timeframes
Volatile Assets: The breakout confirmation helps filter out weak signals in choppy markets
Risk Management
The strategy uses 100% equity allocation, suitable for backtesting single strategies
Consider reducing position size when implementing with real capital
Monitor the 25-period high breakout requirement as it may delay entries in fast-moving markets
Visual Elements
Green/Red Cloud: Shows bullish/bearish cloud conditions
Yellow Line: Conversion Line (Tenkan-sen)
Blue Line: Base Line (Kijun-sen)
Orange Line: 171-period EMA trend filter
Gray Line: Lagging Span (Chikou Span)
Important Considerations
Limitations
Lagging Nature: Like all Ichimoku strategies, signals may lag significant price moves
Whipsaw Risk: Extended periods of consolidation may generate false signals
Parameter Sensitivity: Custom parameters may not work equally well across all market conditions
Backtesting Notes
Results are based on historical data and past performance does not guarantee future results
The strategy includes realistic slippage and commission costs
Default settings are optimized for backtesting and may need adjustment for live trading
Risk Disclaimer
This strategy is for educational purposes only and should not be considered financial advice. Always conduct your own analysis and risk management before implementing any trading strategy. The unique parameter combinations used may not be suitable for all market conditions or trading styles.
Customization Options
Trade Mode: Switch between "Ichi" and "Cloud" signal generation
Short Trading: Option to enable short positions (disabled by default)
Date Range: Customize backtesting period
All Ichimoku Parameters: Fully customizable for different market conditions
This enhanced Ichimoku implementation provides a structured approach to trend following while maintaining the flexibility to adapt to different trading styles and market conditions.
Ichimmoku

3 indicators in another time frame "3 indicators in another time frame"
1- In the indicator settings section, you can save and change another time period
2-For time frame changes, it should be calculated in minutes
3-Includes three performance indicators ( ichimoku , bollinger bans, pivot ) that are set to a 15-minute timeframe by default.

Double Ichimoku Cloud with drop-down selectable lookback periodsThis script will display two Kumo Clouds. The overlap between the clouds can be areas of high support or resistance. I've included a drop-down selector for a variety of common lookback periods. Experiments show that the 10-30-60-30 settings can be more applicable to the FOREX and Crypto markets.
Volume Adaptive Chikou Scalping StudyIDEA PLACEMENT
This indicator uses “Chikou” cross concept of Ichimoku cloud indicator and enhances usage of High/Low data with Volume Breakout and Volatility based dynamic adaption.
I’ve been working on making Moving Averages more adaptive based on Volume Breakout and Volatility but as we know Mas work better on close values. I wanted to create a study that may have maximum data available and that’s how I came up with the concept of making adaptive Ichimoku Cloud. Except, I used different concept than Ichimoku. As we know that Tenkan-sen and Kijun-sen from Ichimoku Cloud average out highest and lowest values within 26 and 9 period respectively but I tried making it Volume Breakout and Volatility based Adaptive but couldn’t get better results.
Along the way I came up with an idea of instead of averaging out just keeping the High/Low values data separate and intact and to do so I took Linear regression of High values of Volume Breakout and Volatility based Adaptive dynamic period and similarly with Low values.
Then the strategy was to use Chikou for crossover and crossunder indication and for this purpose I used Chikou with same dynamic length as used before in High/Low linear regression.
The idea becomes simple as when Adaptive Dynamic Chikou crosses Adaptive Dynamic Linear Regression of High/Low values then Lowest / Highest value within current Adaptive Dynamic Length becomes the next Support / Resistance.
SIGNALS
Not every Chikou cross would give signal instead signal should be supported by either Volume Breakout or Volatility whatever you have selected from.
FIBONACCI EVELOPE BANDS
I’ve included ATR based Fibonacci multiple bands which would act as good support/resistance zones.
DEFAULT SETTINGS
I’ve set default Minimum length to 20 and Maximum length to 50 which I’ve found works best for almost all timeframes but you can change this delta to adpat your timeframe accordingly with more precision.
Dynamic length adoption is enabled based on both Volume and Volatility but only one or none of them can also be selected.
Trend signals verification is enabled based on Volume but Volatility can also be enabled for more precise confirmations.
In “RVSI” settings TFS Volume Oscillator is set to default but others work good too especially Volume Zone Oscillator. For more details about Volume Breakout you can check “MZ RVSI Indicator”
ATR breakout is set to be true if period 14 exceeds period 46 but can be changed if more adaption with volatility is required.
FURTHER ENHANCEMENTS
I’ve used Linear Regression of High/Low values because I found better results with it but SMA and HMA can also be used. I’m planning to perpetually use this study for Dynamically length adaption and trades confirmations in other strategies.

[Zekis]Squeeze Momentum + IchimokuHi,
This is a strategy developed by @zsone, a strategy suitable mostly for altcoins (but not necessary).
The strategy is using the following indicators: Squeeze Momentum (LazyBear), two Ichimoku Clouds (one is MTF), daily EMA21 and EMA golden cross (optionally).
Setting should be used as default.
Rules for entries (scalping):
Go Long (green line on the histogram):
- use low time frames (3m, 5m, 15m)
- candle closes above the ichimoku cloud
- squeeze momentum, first grey cross on green histogram (2 ways):
1. histogram is green and have a black cross and later it turns to grey cross
2. the histogram is red with grey cross and it goes to green with grey cross without having a black cross, just directly goes green histogram with grey cross
- price is above the daily EMA21
- price is above or inside de ichimoku cloud MTF (1h TF)
- optionally! EMA golden/death cross
Go Short (red line on the histogram):
- vice versa
Rules for exits:
- DI+ crosses down on DI- on longs
- DI- crosses up on DI+ on shorts
- or any fixed, dynamic, trailing... TP/SL (according to the market conditions)
This strategy can be used also for high time frames (12h, 1D) with a golden/death cross confirmation.
Soon I will publish a screener that scan multiple altcoins at once to find setups easier.
P.S.1 The strategy should be used with it's default settings/values (you can change them if you want), but there are 2 versions of Squeeze Momentum from Lazy Bear that you can choose from.
P.S.2 This is not a magic strategy, please do your research before using real money!
P.S.3 The strategy is free to use, just add it to the favorites and then to the chart.
Enjoy!

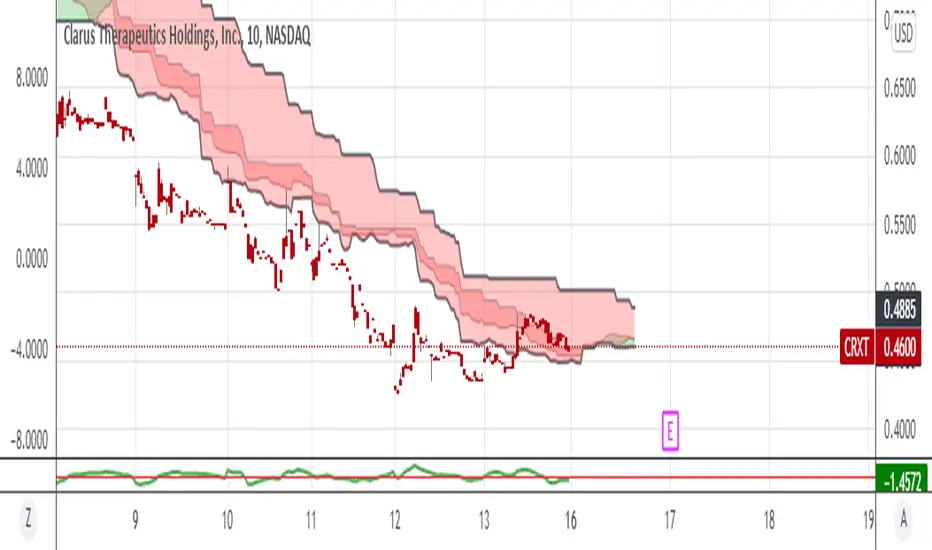
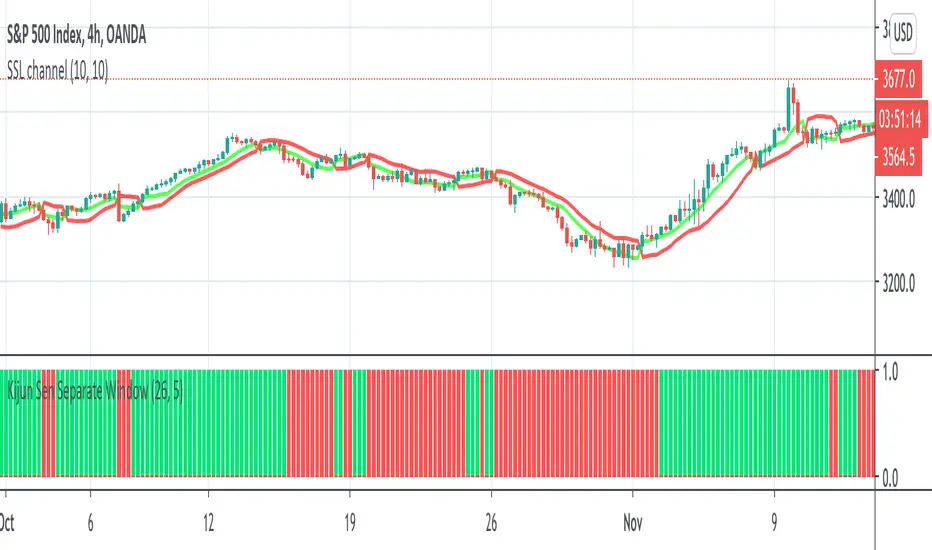
Kijun Sen Separate WindowThis indicator works the same as a regular Kijun Sen but it is on a separate window to allow for other on chart indicators.
I tend to use this as a filter for when to go long/short.
When it is green, I only take longs. When it is red, I only take shorts. Combine with other indicators of your choice.
Ichimoku Clouds Strong Bullish/Bearish signals and alertsIchimoku Clouds Strong Bullish/Bearish signals with allerts
The Ichimoku cloud was developed by Goichi Hosoda, a Japanese journalist, and published in the late 1960s. It provides more data points than the standard candlestick chart. While it seems complicated at first glance, those familiar with how to read the charts often find it easy to understand with well-defined trading signals.
We provide you easy-to-use script which helps to decrypt meaning of lines in the indicator. The script takes Ichimoku clouds indicator formulas to calculate Tenkan, Kijun, SenkouA, SenkouB values and examines them in order to produce buy ( Bullish ) and sell ( Bearish ) signals which are displayed at the chart
The most appropriate time frame is 30m
Custom alerts are added to send you a notice with a webhook when bullish or bearish signal arrives.
You can easily add weak and neutral signals alerts by removing "//" in a specified place
Feel free to copy and use this script for your ideas and trading. You can modify the script by adding Parabolic SAR in order to increase accuracy of positions closure

[SignalFI] IchiEMA PrimeIchiEMA Prime is a brand new type of moving average that combines several attributes from several successful trading systems.
At it's core, its provides a highly reactive Ichimoku Baseline as the centerline which is then wrapped in price bands based on ATR, standard deviations, and the golden ratio (1.618) and golden pocket (.618/6.5) ratios.
The script has been tuned for all timeframes, and creates more signals on lower timeframes, and the signals get more powerful as they are applied to higher timeframes.
This script is meant to be used within a system and in combination with the PRIME series of indicators.
SignalFI was created to help traders and investors to effectively analyze the market based on the Golden Mean Ratio (Fibonacci numbers), plan a trade and ultimately execute it. To help inform and educate market decisions we developed a set of Trading Indicators which are available on TradingView.
SignalFI indicators are just that, indicators. Our indicators are generally configured to use completely historical data (negating repaint), and we advise all alerts created with SignalFI indicators to be fired upon "close" of the current candle. Our indicators can provide valuable context and visualization support when performing market analysis and executing buy and sell decisions. However. we are not financial experts, and all information presented on this site or our other media outlets are for educational purposes only.
For subscription information, visit www.signalfi.net and follow us on twitter: @signalfi_

OBV-Ichimoku [by: Bijan Ajdary]This indicator adds Tenkansen and 3 types of Kijunsen and ChikouSpan and Kumo to the OBV chart.
Just like the Ichimoku indicator, only with the difference that, OBV was used instead of the price,
And making it highly efficient for professional traders and Analyzers.
Email: bj.ajdary@gmail.com
Telegram Id: @The_Last_Savior

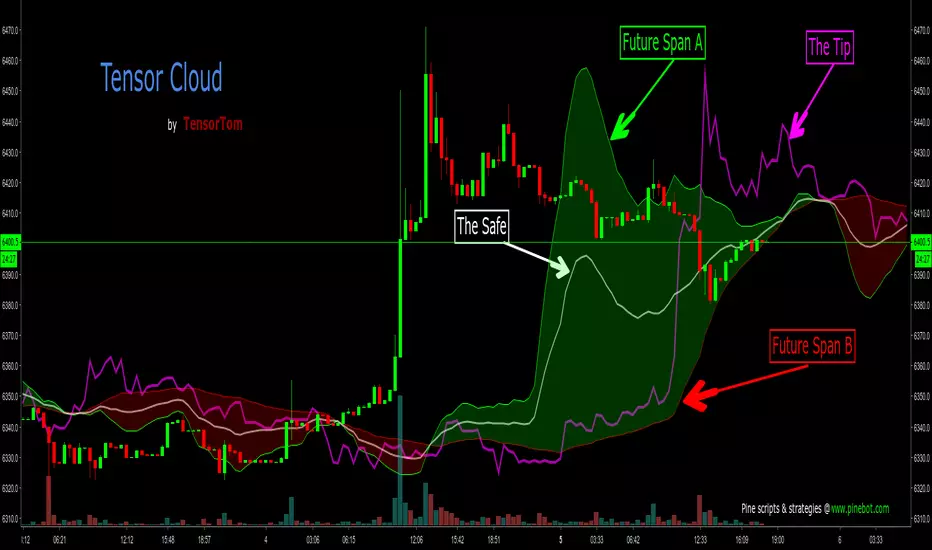
Tensor CloudIntroducing the Tensor Cloud. This is probably the best indicator I've come up with so far. I'm really proud of it. Ichimoku is a brilliant system. It's been around for over half a century and I praise Goichi Hosoda for his brilliant work. However, it's time for something new. I love math and this indicator really showcases that. The Tensor Cloud is an indicator of its own. It is not related to Ichimoku at all. The only thing they have in common is that they both form clouds. The maths in Tensor Cloud are 100% apart.
The Tensor Cloud is mostly comprised of some special forms of linear regression. Let's do a rundown.
Future Span A (Green)
This is one predictor using a linear regression technique. Future Span A is one of the two lines that makes up a Tensor Cloud. From here on out it will traditionally be colored green. It can be used as both a predictor on its own and comprising the Tensor Cloud. This can also be viewed as sort of a long signal when crossing up Future Span B. This line can also be used to help identify levels of support and resistance.
Future Span B (Red)
This is another form of linear regression meant specifically to work alongside Future Span A. This is the second line that comprises a Tensor Cloud. From here on out it will traditionally be colored red. It can be used both as a predictor on its own and comprising the Tensor Cloud. This can also be viewed as sort of a short signal when crossing down through Future Span A. This line can also be used to help identify levels of support and resistance.
Safe (White)
The Safe is a moving average taken of Future Span A and Future Span B. It is highly predictive. From here on out it will traditionally be colored white.
Tip (Fuchsia)
This is yet another form of regression and is highly predictive. The Tip can also be used to help judge trend strength and probability of reversal. More study is of course needed. More on that later in this description. From here on out it will traditionally be colored fuchsia. This line can also be used to help identify levels of support and resistance.
The Tensor Cloud
The space between Future Span A and Future Span B is shaded in green or red, depending on which Future Span is on top. If Future Span A is on top, the Tensor Cloud will be green. This is considered a long signal. If Future Span B is on top, the Tensor Cloud will be colored red. This is a short signal. Attention should also be given to other factors such as:
The position of price in relation to the Tensor Cloud (Under, inside or above).
The position of Tip in relation to the Tensor Cloud.
Crosses of Future Span A and Future Span B.
Tensor Twist
Whenever Future Span A and Future Span B cross (In either direction), this is called a Tensor Twist. If Future Span A is crossing up, this is a long Tensor Twist. If Future Span B is crossing up, this is a short Tensor Twist.
Closing Summary
Much study needs to be done. This is a brand new technique. It's up to all of you to help figure out the best ways to use it. I may still add other components to this indicator but it's pretty solid as is. You will notice that the two integer inputs are set to 27. Twenty-seven is a very important number in mathematics. The details of that are beyond the scope of this description but from here on out, the traditional setting for those will be 27. You will notice that I am not yet releasing the source code to this indicator. For now, it will remain protected. Once I have enough feedback and we're all happy with the final result, I will release the code for the world to have. I have no wish of keeping this closed-source (As profitable as that might be). I just want it to help as many people as possible.
Please share this on social media so we can attract as many testers to give feedback as possible. For publishing this for free, that's all I ask in return. That way it will be as solid as possible when I release the source code.
Enjoy!
OBV-Ts-Ks [by: Bijan Ajdary]This indicator adds Tenkansen and 3 types of Kijunsen to the OBV chart And making it highly efficient for professional traders.
Written based on the teachings of dear Chris

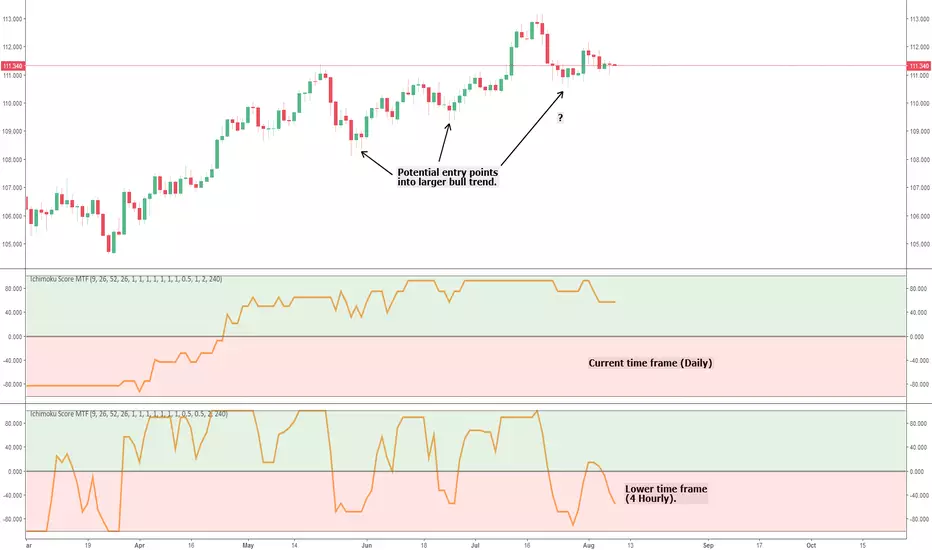
Ichimoku Cloud Score MTFThis is a simple multi time frame (MTF) conversion of the Ichimoku Cloud Score indicator.
All credit goes to the following users for the initial implementations:
- User @dashed :
- User @sjb933 :
This script calculates the Cloud Score based on the sjb933 version; all I've done is convert the script to Pinescript version 3 (to ensure the security function works as intended) and add MTF capability.
I'm a big fan of MTF analysis when using indicators (particularly oscillators). Using a higher time frame runs into the issue of the indicator repainting until the relevant higher time frame candle closes (this is inevitable and logical - so don't comment saying it repaints!). However, for lagging indicators such as this one, adding a lower time frame provides potential entry and exit signals into the larger trend, and also provides early warning of large trend shifts before the current time frame will. This can give you more control over your trades, and in my experience helps lagging indicators such as Ichimoku stay relevant in high volatility markets that are vastly different from when the indicators were conceived.
Any queries please let me know.
Cheers,
RJR
Consensio Trading SystemConsensio Trading System involves using 3 different moving average comprised of 2, 7 and 30-week simple moving average. The trading methodology is simple when all moving average are above one another and is converging up ..You're in a bull market and vise versa for a bear market when all the moving average below one another and is converging down. There are said to be more than 1000 (1k) combination for this system to begin trade with and all pattern require at least 3 moving average. This system is mainly used with the weekly chart for longterm perspective although it can be used up to 30 min for short-term trade setups. The main component of this system is longer-term moving average i.e.30 period if that is down and other MA are consolidating within a range aka death cross back and forth ... the overall market should be considered bear market regardless of other two moving average crossovers.
Hyperwave Channel by Lucid Investment Strategies
Co-hosted by D. Tyler Jenks and Leah Wald
D. Tyler Jenks, the President, and CIO of Lucid Investment Strategies LLC developed the proprietary technical system of Hyperwave. After 40 years as an investment manager, he discovered over 300 examples of Hyperwaves within various asset classes; stocks, bonds, commodities , indexes, and cryptocurrencies

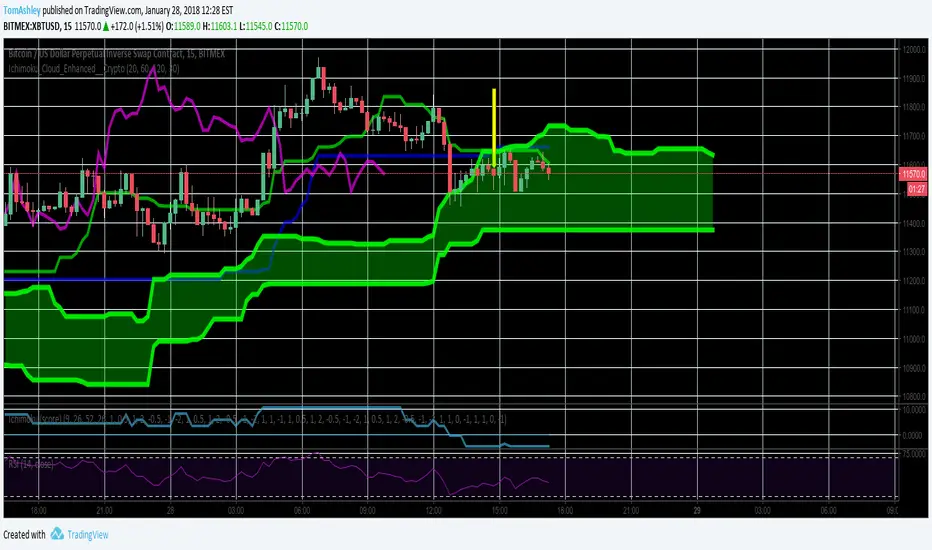
Ichimoku Cloud Enhanced For CryptoIntervals have been changed to account for a 24/7 cryptocurrency trading period. Values were then doubled so that the trader can avoid fakeout breakouts/traps. This leads to a bit less signals but rather, more sure signals instead. Very useful and more safe, even in smaller timeframes. Colors were set to the standard and breakout arrows are now enabled by default.
Bryan - Multi IndicatorCustom Indicator - Developed for a Backtest-Rookies customer and published for testing and acceptance.
Ichimoku + ADX combined indicator with custom entry criteria and plotting for buy signals.

Ichimoku Volume Filtered SignalsFor use whenever you would use an Ichimoku Indicator.
This indicator will print buy and sell signals when the following conditions are met - note all parameters for ichimoku, volume sma, etc are configurable
Buy
Price is above cloud
Tenkan-sen is above Kijun-sen
Volume is double or more than 20 sma volume
Volume is less then four times 20 sma volume
Candle is positive
Sell
Price is below cloud
Kijun-sen is above Tenkan-sen
Volume is double or more than 20 sma volume
Volume is less than four times 20 sma volume
Candle is negative
If you find this useful, consider sending some bitcoin my way 😀
1LbFxAYJSVPxirT8eW31QHaGbySHyPYgMq
Good luck and have fun!
