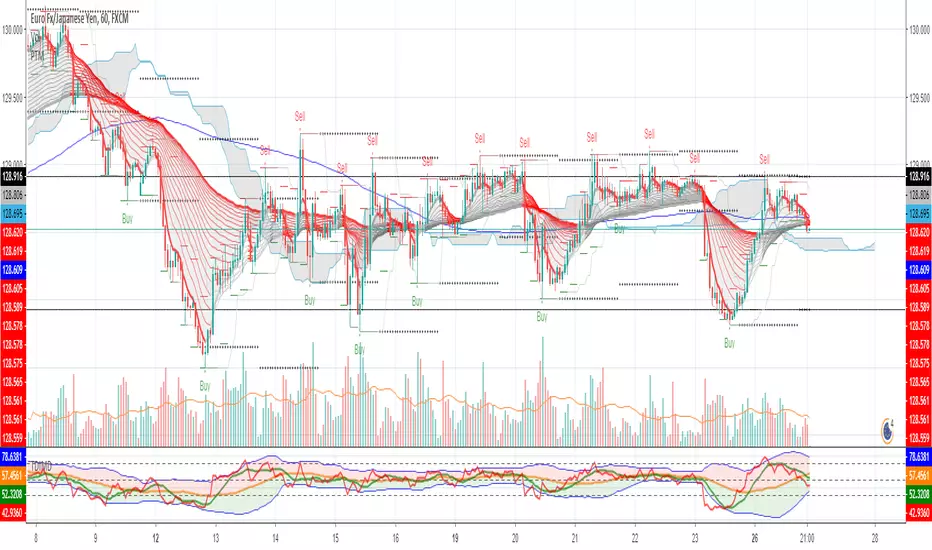
Ichimoku 2 sets of settings, markers and alertsThis is my take on the masterful, beautiful and powerful Ichimoku.
It comes with:
- 2 sets of settings you can flip between,
- 5 types of markers:
--- Tenkan/Kijun crosses,
--- Price (close)/Tenkan crosses, with the option of only showing those occurring with the trend, so on pullbacks,
--- Price (close) exits out of the Kumo,
--- Chikou exits out of the Kumo,
--- Overbought/Oversold conditions (shown on the chart).
- Choice of showing only long or short markers,
- Coloring of bars using OB/OS conditions,
- Alerts on all markers and on combinations.
The markers are intended as indications—not bulletproof buy/sell signals.
The overbought/oversold conditions are detected when the high/low is a multiple of ATR away from Kijun. The ATR length and multiple used are configurable.
I normally use the Josh Olszewicz (CarpeNoctom) big settings, so those are the default.
I prefer subtle coloring on charts and my choice of colors reflects that.
You will see references to KumoA and KumoB in the names of inputs and style elements. For me, KumoA is the top of the Kumo when it is bullish, so the bottom when bearish.
As usual when creating alerts, be sure you already have defined proper inputs and that you are on the intended interval, as they will be used when triggering alerts.
Ichimoku Cloud

Ichimoku A/D Breakoutthis is basically a clone of the super a/d indicator but we're using a standard ichimoku as the source for the trend instead of the supertrend indicator


Triple Timeframe IchimokuVi presento il Triple Timeframe Ichimoku.
Questo indicatore applica tre Ichimoku completi al vostro grafico usando fino a ben 3 timeframe diversi:
Timeframe Attuale (quello impostato sul grafico che state visualizzando)
Timeframe B (personalizzabile tra i seguenti TF : 1m, 5m, 15m, H1, H2, H4, D, W, M)
Timeframe C (personalizzabile tra i seguenti TF : 1m, 5m, 15m, H1, H2, H4, D, W, M)
Il risultato è quello di avere immediatamente sott'occhio l'andamento dei prezzi senza dover fare zapping tra i vari timeframe: tutto chiaro subito!
L'indicatore è completamente personalizzabile, potete infatti:
Decidere quanti (da 1 a 3) e quali Ichimoku visualizzare
Scegliere per ogni Ichimoku se visualizzare o meno le linee dell'indicatore (Tenkan, Kijun e Laggin)
Scegliere per ogni Ichimoku se visualizzare o meno le nuvole dell'indicatore (SSA, SSB e Kumo)
Personalizzare i colori di ogni singola linea di ogni singolo Ichimoku
L'indicatore è estremamente utile per strategie basare sull'indicatore Ichimoku che richiedono il controllo su diversi Timeframe.
Buon trading a tutti!

Wobbly (Swing) This Script contain ichimoku's Cloud, Kijunsan, Takensan in multi different Time_Frames ( 30', 60', 240', 1D ) as Resistance and Support
It is useful for Swing in time_frames less than 1H
You can easily understand which line related to which time_frame by Width of lines ( Thicker lines shows Higher Time_Frame )
U can also disable the one might not useful for u on Settings
HoPe U aLl EnJoY NeW_YeAr & This ScRiPt

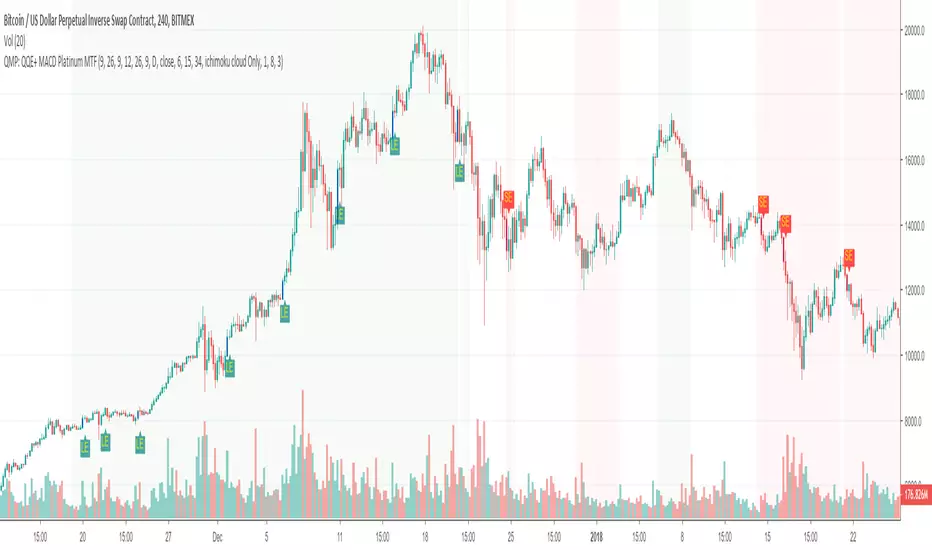
Trend following and reversal strategy for cryptoThe idea of this indicator comes from Jim Brown's book.
using the "MACD Platinum" and "QQE advanced" and multi-timeframe.
The difference to the original idea is that I use Ichimoku cloud for trend detection.


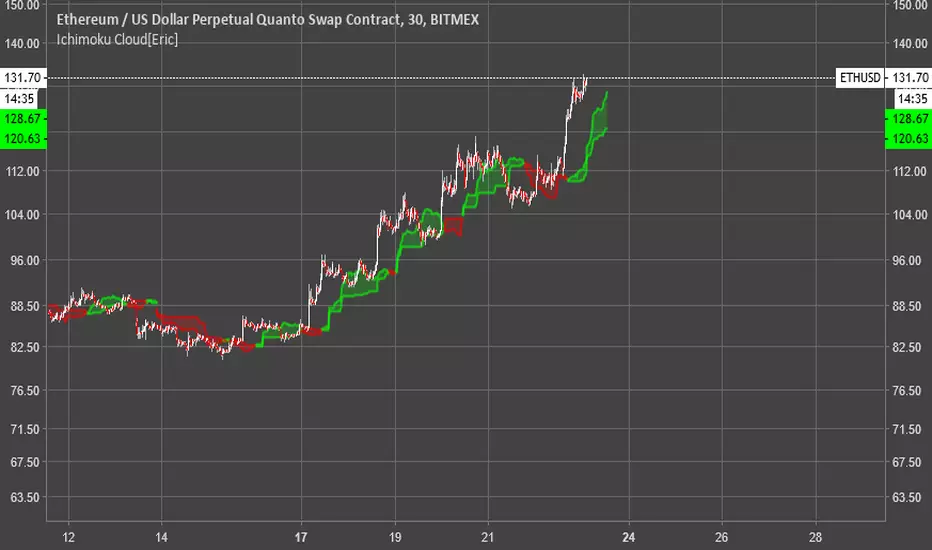
Ichimoku Cloud [Eric]Phase 1: Ichimoku Cloud
Phase 2: Dynamic Ichimoku Cloud
Phase 3: Artificial Intelligence Ichimoku Cloud
Combination Ichimoku CloudThis indicator allows you to display two Ichimoku Cloud settings simultaneously. Each variable can be set independently, including its visibility.
Basically a way to combine two "Ichimoku Cloud" indicators into one slot.

Quad Moving Avarage-Ichimoku Cloud-ALMA-Bollinger BandsAll-in-One
Ingradients:
* Ichimoku Cloud,
* 2 Simple Moving Avarage (SMA),
* 2 Exponential Moving Avarage (EMA),
* 2 Arnoud Legoux Moving Avarage (ALMA),
* Bollinger Bands and
* Volume Based Colored Bars (developed by KIVANÇ fr3762).
Compiled for limitations. Thank you.

Trend Master CryptoFeatures:
Show price trend very clearly.
Mark entry signals on candles.
Getting Started:
Green candle is time to buy or long.
Red candle is time to sell or short.
Set your stoploss around cloud upper or lower ranges.
Contributing:
You can report bugs or issues under this page.
Any advice would be helpful for improving this indicator's accuracy.
Application:
This is an invite only indicator.

[astropark] Power Tools Overlay//******************************************************************************
// Power Tools Overlay
// Inner Version 1.2 20/12/2018
// Developer: iDelphi
// Developer: astropark (Ichimoku Cloud), SMA EMA & Cross tools
//------------------------------------------------------------------------------
// 21/11/2018 Added EMA SMA WMA
// 21/11/2018 Added SMA-EMA EMA-WMA WMA-SMA (Thanks to mariobros1 for the idea of the Simultaneous MA)
// 21/11/2018 Added Bollinger Bands
// 21/11/2018 Added Ichimoku Cloud (Thanks to astropark for all the code of the Ichimoku Cloud)
// 23/11/2018 Show all the indicator as default
// 23/11/2018 Added a cross when single Moving Averages crossing (Thanks to astropark for the idea)
// 24/11/2018 Descriptions Fix
// 24/11/2018 Added Option to enable/disable all Moving Averages
// 10/12/2018 Added EMAs and Crosses
//******************************************************************************

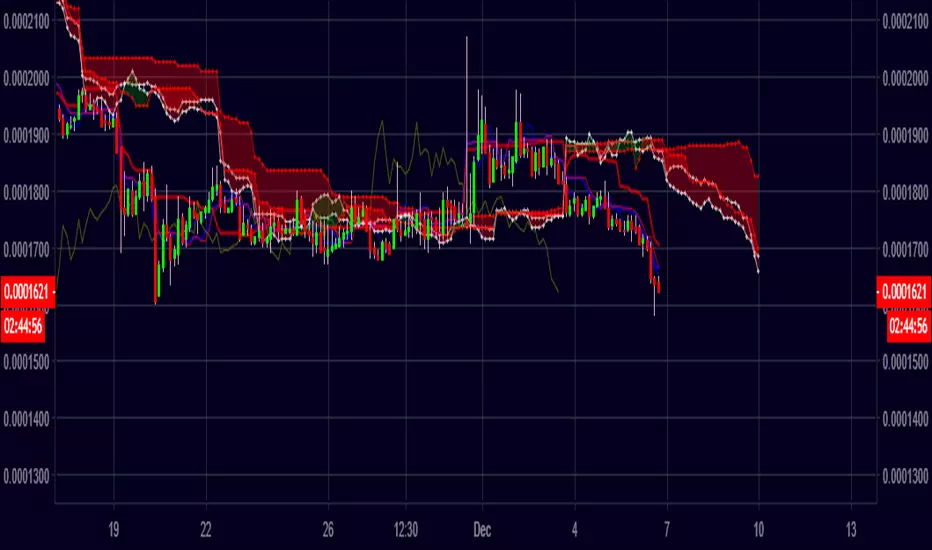
CryptocloudHere's a cloud witn both, original & crypto settings.
I had to make some little tweaks in order to get the cloud accurate.
Works well & has more fun in low timeframes. 3D effect :)


two Ichimoku ITNG
with this indicator you can have 2 ichimoku clouds on chart
first one with chart timeframe
and second one with your choosen timeframe
Enjoy

two Ichimoku ITNG
with this indicator you can have 2 ichimoku clouds on chart
first one with chart timeframe
and second one with your choosen timeframe
Enjoy
CryptologicxThis script includes the following indicators:
Bollinger Bands
SMA 5 10 20 50 100 200
EMA 14 50 55 100 200
HMA 20 / 50
Ichimoku Cloud
The MA have fixed inputs, if you wish to see different you can contact me.

Ichimoku Cloud + 3MASimple combination of Ichimoku and 3 moving averages. You can show/hide the MA's change their types and sources

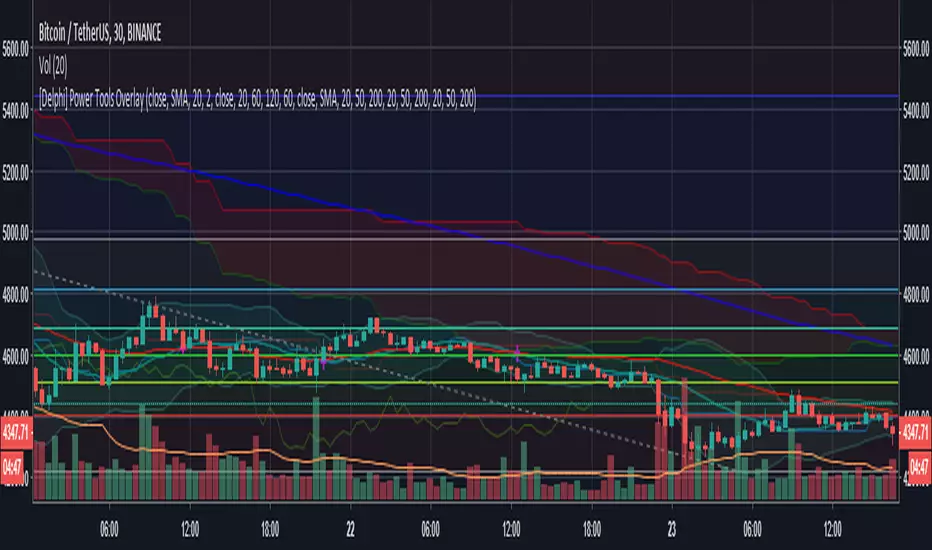
[Delphi] Power Tools OverlayFEATURE
3EMA 3MA 3WMA 3MA-3EMA 3EMA-3WMA 3WMA-3MA
Bollinger Bands
Ichimoku Cloud
//******************************************************************************
// Power Tools Overlay
// Inner Version 1.0 21/11/2018
// Developer: iDelphi
// Developer: astropark (Ichimoku Cloud)
//------------------------------------------------------------------------------
// 21/11/2018 Added EMA MA WMA
// 21/11/2018 Added MA-EMA EMA-WMA WMA-MA (Thanks to mariobros1 for the idea of the Simultaneous MA)
// 21/11/2018 Added Bollinger Bands
// 21/11/2018 Added Ichimoku Cloud (Thanks to astropark for all the code of the Ichimoku Cloud)
//******************************************************************************
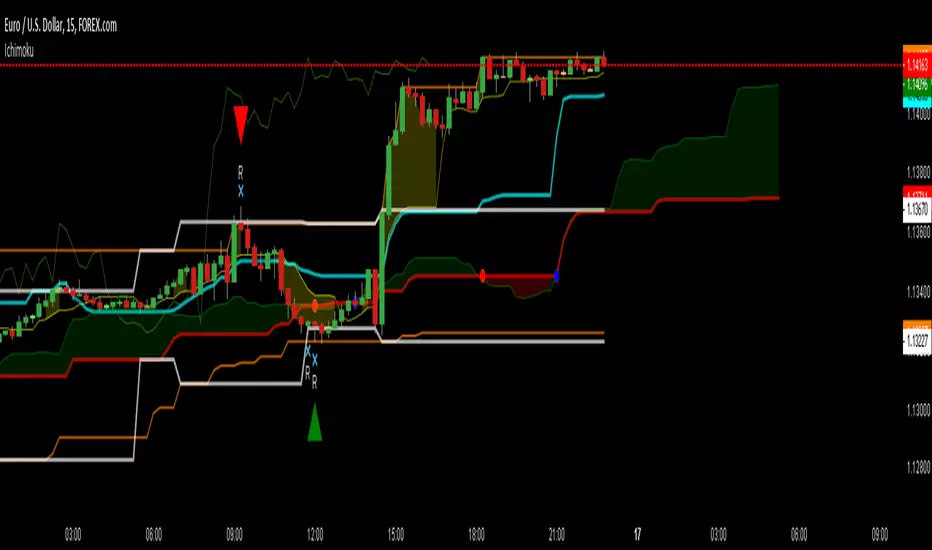
JPCOQ Ichimoku V2INDICATORS:
Show Yellow zone between price and tenkan when oversold/overbought
Show splits : white when to come, yellow when occurs, red when occurs with a flat Senkou Span B, blue when occurs with a flat Senkou Span B and kijun
Show probable range in white lines
Show last higher highs & lower lows in orange lines
SIGNALS (when ichimoku meet candle patterns)
L/H = rebound signals on higher highs / Lower Lows, target can be lower kj flat
C = potential rebound on overbought oversold zone, target can be lower kj flat
R = rebound signal on range edges, target can be last split
B = pullback/throwback rebound after break out of probable range, target can be last higher high (lower low)
K = rebound on Kj in a trend (out of range), target can be last higher high (lower low)
OTHER PARAMETERS
checkHaram = take Harami pattern into account
CheckallCandle = include all candle patterns
checkVol = show "V" when volume is higher than last 9 periods average
showFuture = next kijun/ssa/ssb values in thin lines
closeToChikou = the greater the value close to ichimoku lines is the test
showChikou = red cross on price when close to chikou in TF or upper one
Flatlen = bars of same value to validate an ichimoku flat
CheckSignal1 = check and show upper TF signals => manual check because not perfect, to unset when study error message !!
ShowEntry = green buy signal (red sell) when buy signal and chikou free and ratio >=2