ICHIMOKU MTFMultiple Time Frame Version of Ichimoku Kinko Hyo Indicator.
Created in 1940's by Goichi Hosoda withe the help of University students in Japan.
Ichimoku is one of the best trend following indicators that works nearly perfect in all markets and time frames.
Ichimoku is originally an built in indicator in Tradingview but there are some problems like:
the indicator hast 5 lines but you can change only 4 parameters in the settings menu of Tradingview Charts which you could only control 3 of the lines effectively. A second problem is that Tradingview preferred to use English titles for the ICHIMOKU lines instead of giving them the most common original Japanese ones. (So I rewrite the indicator)
Kijun Sen (blue line): Also called standard line or base line, this is calculated by averaging the highest high and the lowest low for the past 26 periods.
Tenkan Sen (red line): This is also known as the turning line and is derived by averaging the highest high and the lowest low for the past nine periods.
Chikou Span (Plum line): This is called the lagging line. It is today’s closing price plotted 26 periods behind.
Senkou SpanA (green line): The first Senkou line is calculated by averaging the Tenkan Sen and the Kijun Sen and plotted 26 periods ahead.
Senkou SpanB (purple line):
The second Senkou line is determined by averaging the highest high and the lowest low for the past 52 periods and plotted 26 periods ahead.
PERSONALLY I ADVISE YOU TO USE ICHIMOKU WITH DEAFULT LENGTHS (9,26,26,52,26) IN ORDER FOR STOCK MARKETS AND FOREX MARKETS
FOR CRYPTO YOU'D BETTER USE:
10,30,30,60,30 OR 20,60,60,120,60
THE TRICKY THING IS THAT KEEPING THE 1-3-3-6-3 RATIO CONSTANT IS NECESSARY
Here's a link of my Youtube video explaining ICHIMOKU but unfortunately only in TURKISH:
www.youtube.com
Developed by: Goichi Hosoda
Here's the link to a complete list of all my indicators:
tr.tradingview.com
Ichimoku kullanımı anlattığım detaylı video serisini linkten izleyebilirsiniz:
www.youtube.com
İndikatörü geliştiren: Goichi Hosoda
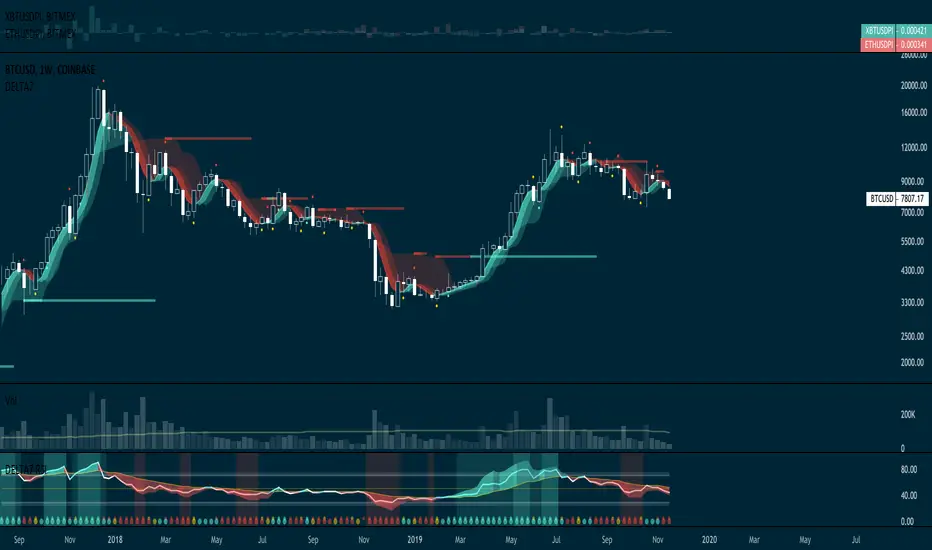
Ichimoku Cloud

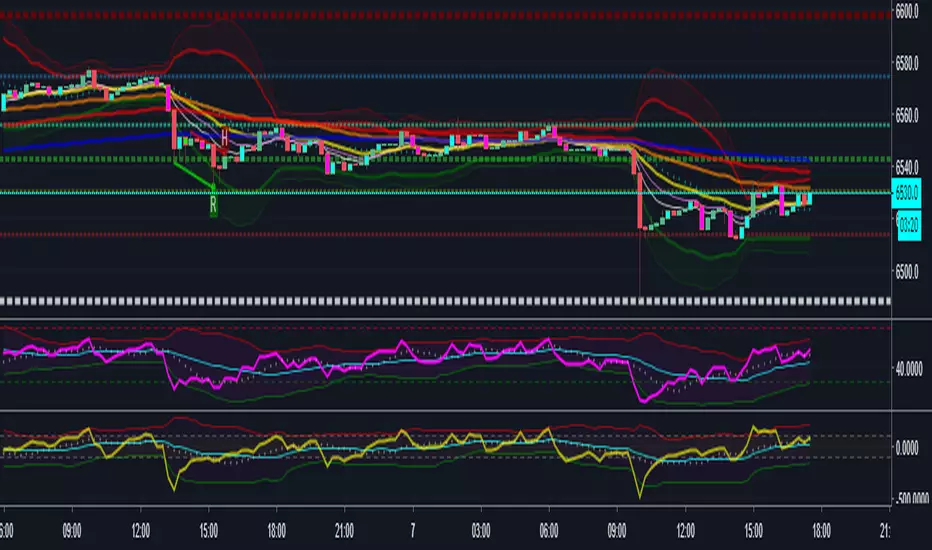
SSABU MTF Ichimoku Cloud✅ MTF Ichimoku Cloud (multi-time frame Ichimoku cloud) is an indicator.
This indicator is a supplementary indicator for viewing the cloud profile of a high-frame burst in a low-frame burst.
If you set the indicator instead of entering the time directly, you can set 1/3/5/13/30/45 minutes 1/2/3 / hour 1 day 1 day in Cloud MTF Set (Minute).
The default setting is 4H.
The screenshot above shows the Ichimoku Cloud with a 4-hour bar on a 15-minute chart.
Clouds of 4 hours seen from 15 minutes of sky blue, cloud of 15 minutes of blue
✅ MTF Ichimoku Cloud (멀티 타임 프레임 이치모쿠 클라우드) 지표입니다.
본 지표는 낮은 프레임의 분봉에서 높은 프레임의 분봉의 구름대 모습을 볼 수 있는 보조지표 입니다.
직접 시간을 입력 하는 건 아니고 지표를 설치하시면 Cloud MTF Set(Minute)에서 1/3/5/13/30/45분 1/2/3/시간 1일 1주로 설정이 가능합니다.
기본설정은 4H으로 되어있습니다.
위의 스크린샷은 15분봉의 차트에서 4시간봉의 Ichimoku Cloud를 적용한 모습입니다.
하늘색이 15분봉에서 보는 4시간봉의 구름, 파란색이 15분봉에 해당하는 구름
✅ Other indicators to help you trade
✅ 매매에 도움되는 다른 보조지표
Basel major 2.2


OBV-Ts-Ks [by: Bijan Ajdary]This indicator adds Tenkansen and 3 types of Kijunsen to the OBV chart And making it highly efficient for professional traders.
Written based on the teachings of dear Chris


Ichimoku & 3 BB & Multi MA by Theo Park V1.1.00Ichimoku Cloud
3 Bollinger Bands
Multi Moving Averages
Hophop Ichimoku Cloud with Fibonacci RetracementThis indicator automatically draws Fibonacci retracement levels on top of the Ichimoku Cloud indicator
There are plenty of great Auto Fib generator indicators, particularly
by KIVANCfr3762 is the one I like a lot.
However if you use Ichimoku Cloud strategy with Fibonacci levels for the cloud settings this indicator will be quite handy on saving the hassle of adjusting the look back period of the auto fib with baseline of Ichimoku,
and also it will save you from using 1 indicators per chart limit which may be an issue for free plan users
BTC Tip: 39bwXN1chms1yHskBaYwz76UhDakc7grJ7
LTC Tip: MGD3U9dBCBVctwnoCa1grU8ompxG6hUhMk
ETH Tip: 0xEE9684a5aceE85036527aB48E596DeE4627bD84b
Bu indikator Ichimoku Cloud indikatoru uzerinde otomatik olarak Fibonacci retracement degerlerini cizmektedir,
Eger sadece otomatik Fibonacci retracement indikatoru ariyorsaniz, KIVANCfr3762 a ait olan indikatorunu cok basarili buluyorum ve onu kullanmanizi tavsiye ederim
Ancak siklikla Ichimoku Cloud ve Fibonacci Retracement kullaniyor iseniz her seferinde iki indikatorun ayarlarini degistirmekten kacinmak ve ayrica grafik uzerindeki indikator limitinden tasarruf etmek isterseniz bu indikatorun isinize yarayacagini dusunuyorum
Bu indikatorden faydalaniyor ve benzerleri uzerinde calismam icin destek olmak isterseniz
BTC Bahsis: 39bwXN1chms1yHskBaYwz76UhDakc7grJ7
LTC Bahsis: MGD3U9dBCBVctwnoCa1grU8ompxG6hUhMk
ETH Bahsis: 0xEE9684a5aceE85036527aB48E596DeE4627bD84b

yutas_Chie's Indicator_ver.free
It is a free distribution version of Chie's Indicator.
ちえさんインジケーターの無料配布バージョンです。
RSI 𝝙 MapRSI 𝝙 Map is a on-chart application of signals produced by the original RSI 𝝙 Indicator.
RSI 𝝙 is a full study system of several RSI analysis that can be used on different timeframes and adapt strategy to trending markets or trading ranges.
Default Settings:
RSI: 13
Linear Regression of RSI: 34
Signal RSI: 5
Long RSI: 55
RSI 𝝙 Histogram: Delta between RSI and Long RSI based on Signal RSI_Length.
Activate Vertical Bar Highlights and/or Signal Candle Flags for:
- RSI Oversold/Overbought. (Default: Highlight Bar)
- Signal RSI Oversold/Overbought. (Default: Highlight Bar)
- RSI crossing its Linear Regression . (Default: Signal Candle Flag)
- RSI crossing its Long RSI . (Default: Off)
- Signal RSI crossing its RSI . (Default: Off)
- Signal RSI crossing its Long RSI . (Default: Off)
- RSI 𝝙 Histogram crossing baseline. (Default: Off)
Users can also do extra tuning in Style Section of Format options.
The market behaves differently when the pacing changes, volatility changes and when it trends or when it ranges. Develop an understanding of it with the help of this study.
Avoid risking more than 1% per trade. Be responsible for always making a priority about protecting capital and risk management. Develop emotional control and use this RSI study to develop a more complete trading system without any need for extra indicators other than Price and Volume .
👆active signals:
RSI Overbought/Oversold
Signal RSI Overbought/Oversold
RSI crossing Linear Regression
👆active signals:
RSI Overbought/Oversold
Signal RSI Overbought/Oversold
Signal RSI crossing RSI
Signal RSI crossing Long RSI
👆active signals:
RSI Overbought/Oversold
Signal RSI Overbought/Oversold
RSI crossing Linear Regression
RSI crossing Long RSI
Signal RSI crossing RSI
Crypto Day/Swing Trade ComboI've been having some (educational) fun with Pine lately, and wanted to improve the Trading Combo script, so here is my Crypto Day/Swing Trade script.
It's a combination of several indicators, included are:
Bollinger Bands (with 3 bands/StdDev, 2 enabled by default)
(Enhanced) Ichimoku Cloud
Automatic Fibonacci S/R levels
6 Moving Averages
3 Hull Moving Averages
Price Action Bars
Price Divergence Detector
Since Pine is limited to 64 plots, this is all i could get in.
Shout out goes to ChrisMoody, Albert Callisto, 100kiwi, LazyBear, RicardoSantos & JustUncleL for their ideas and (part of) the source code
The script is fully configurable. Use the Inputs tab to enable or disable indicators and use the Styles tab to enable/disable (or configure) specific parts of each indicator.
Happy Trading!
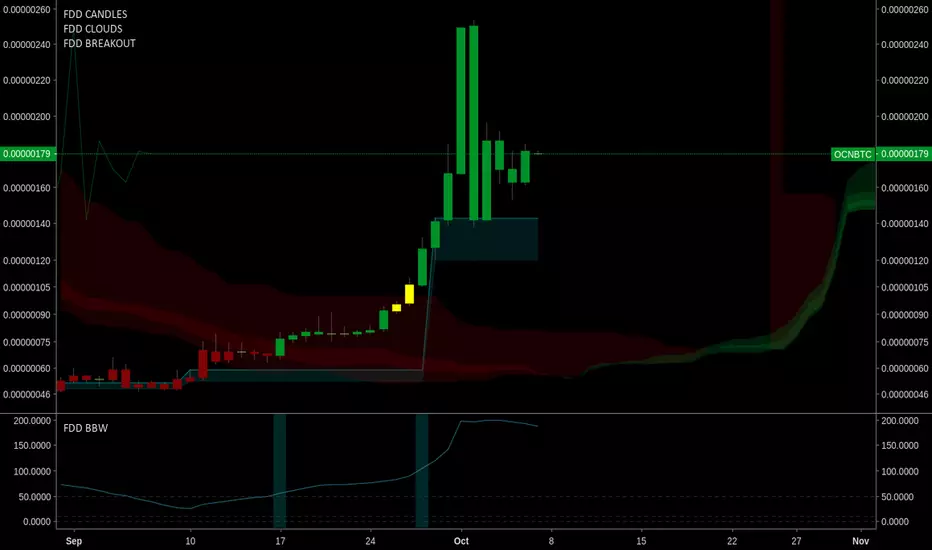
FOMO DRIVEN BREAKOUT INDICATORFomo Driven Developments Breakout Indicator
Works well with FDD Super Candles Indicator and Super Clouds.
This is the breakout indicator that F-DAS uses.
For access please go to www.fomodd.io.
Twitter = Telegram = @dgnsrekt
FOMO DRIVEN DEVELOPMENT
www.youtube.com
This video shows the F-DAS system watching TDI. F-DAS is a modular trading alert system that can easily be programmed to watch any exchange, market, or trading strategy. The video shows F-DAS watching TDI and FDD breakouts.
FOMO DRIVEN SUPERCLOUDSFomo Driven Developments Super Clouds
Works well with FDD Super Candles Indicator.
For access please go to www.fomodd.io.
Twitter = Telegram = @dgnsrekt
FOMO DRIVEN DEVELOPMENT

FOMO DRIVEN SUPERCANDLESIchimoku base candle coloring system
Works well with FDD Cloud Indicator.
For access please go to www.fomodd.io.
Twitter = Telegram = @dgnsrekt
FOMO DRIVEN DEVELOPMENT

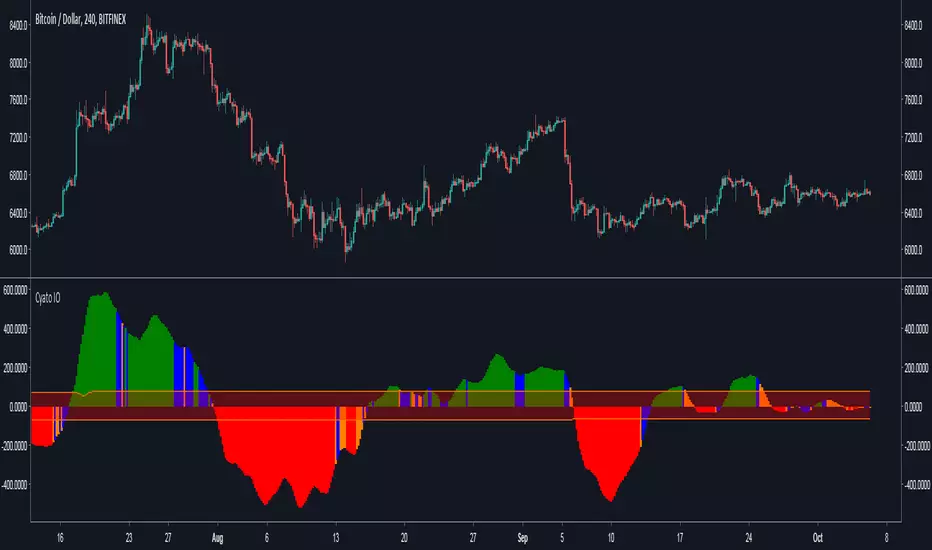
Cyatophilum Ichimoku Oscillator [ALERT SETUP]Hello, I built an oscillator based on Ichimoku trading rules. I wanted something simple to use, but powerful, with automated alerts that would help us trade breakouts and trend reversals.
The indicator can be used on all timeframes and everywhere : Crypto, Forex, Index, Stocks, Futures, CFD.
Basically, green bars equals bull market and red bars equals bear market.
Blue and Orange bars show potential breakouts and you can setup automatic alerts for receiving an email or SMS when it happens.
You can also setup alerts for new highs and new lows indicating a potential trend reversal.
The narrow channel in the middle indicates consolidating periods and unsignificant trades, because we know Ichimoku performs badly in range markets.
For more information on how to use it, I made a description page at the link below.
Sample Use Cases :
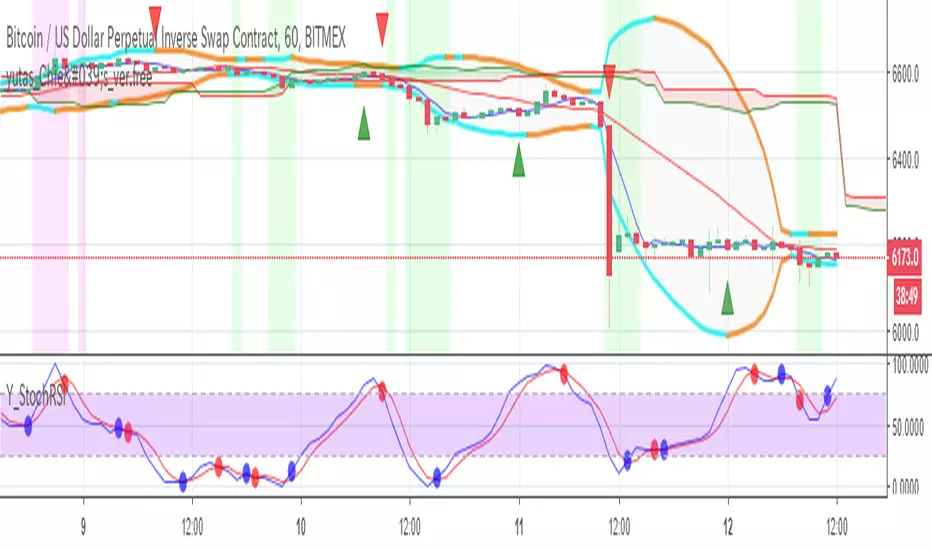
BTCUSD 4H
BTCUSD 2H with New Highs/Lows on chart (blue and red circles correspond to alert conditions)
BTCUSD 1H
ETHUSD 2H
Use divergences with price action to trade breakouts.
More information on my website
blockchainfiesta.com
Purchase this indicator today and get access to my other Cyatophilum Indicators that will help you in your trading
blockchainfiesta.com
Happy trading!


BinancemokuAn Ichimoku cloud indicator that uses the Binance moving averages (7, 25, 99) instead of the Ichimoku defaults of 9, 26, 52. Great for trading alts on the 4h but will work on any timeframe.
Also includes the Binance MA lines for comparison. They're hidden by default but you can enable them in settings and they'll show as fade lines.

Gunbot Deluxe Tuners BE [Alerts]Revision 18
Gunbot Deluxe Tuners BE Alerts is part of the official Gunthy version of Gunbot Deluxe Tuners.
It is the companion Alerts script for the Gunbot Deluxe Tuners BE (Black Edition) backtesting and optimizing script.
This Alerts script allows user to automatically send alerts directly to Gunbot through the Gunbot TradingView addon.
Available only to verified Gunbot owners. No exceptions. Anyone interested in obtaining this script must contact either their official Gunbot reseller or me privately.
No public requests or donations for access to this script will be granted. No exceptions.
NOTICE: By requesting access to this script you acknowledge that you have read and understood that this is for research purposes only and neither I or Gunthy are responsible for any financial losses you may incur by using this script!

Tenkan Kijun Cross Alert Modified to alert on EqualsI wanted it to alert on equals not only on crossover

^-^ Three Ichimoku Clouds ^-^ 4x4 Moving Average x EMA ^-^Three ichimoku clouds
Four moving averages
Four exponential moving averages

Ichimoku DoubleTF overlay
Hello guys, this code allow to overlay a second ichimoku over the first one loaded on the used time-frame.
It's simple.
Choose your preferred Time-frame.
Set the Time-frame for the second Ichimoku in the settings menu .
Now you can see two Ichimoku clouds based on two different time-frame.
It can be very usefull and more ordered of a multi-windows layout.
On second Ichimoku the Chikou-span is omitted 'cause i think that is useless and cumbersome.
To help to reading the graph i set two labels to identify the "2nds" tenkan and kijun.
Tell me if this script was useful and remember to follow me and adding a like.
Available combinations:
DAILY: WEEKLY AND MONTLY
4H: WEEKLY, DAILY
1H: WEEKLY, DAILY, 4H
30m: DAILY, 4H, 1H
15m: DAILY, 4H, 1H, 30m
5m: DAILY, 4H, 1H, 30m, 15m
3m: 1H, 30m, 15m
1m: 1H, 30m, 15m,5m,3min
Thanks, bhutano
*****************************************************************************************************
Ciao ragazzi, questo codice permette di sovrapporre un secondo Ichimoku a quello del time-frame utilizzato.
Scegliete il vostro time-frame preferito.
Impostate il time-frame del secondo Ichimoku dalle impostazioni dello script .
Adesso vedrete due Nuvole Ichimoku basati su due time-frame diversi.
Può essere davvero utile e più ordinato di un layout multi-window.
Sul secondo Ichimoku la Chickou è stata omessa perchè penso che sia inutile e ingombrante.
Per aiutare la lettura del grafico ho impostato due etichette per identificare le seconde tenkan e kijun.
Ditemi se questo script vi è stato utile e ricordatevi di seguirmi e aggiungere un mi piace.
Combinazioni possibili:
DAILY: WEEKLY AND MONTLY
4H: WEEKLY, DAILY
1H: WEEKLY, DAILY, 4H
30m: DAILY, 4H, 1H
15m: DAILY, 4H, 1H, 30m
5m: DAILY, 4H, 1H, 30m, 15m
3m: 1H, 30m, 15m
1m: 1H, 30m, 15m,5m,3min
Grazie, bhutano
