V2 Time Candle Markers (6H / 4H / 1H / 15M)V2 Time Candle Markers (6H / 4H / 1H / 15M) to highlight PSPs etcPine Script® indicatorby Pipsey2
Liquidity Sweep Sniper AP StyleAP Capital – Liquidity Sweep Sniper (Fab-Style) 📌 Overview This indicator is a precision scalping tool inspired by professional liquidity-based trading concepts often demonstrated by elite intraday scalpers. The script focuses on liquidity sweeps followed by strong displacement, aiming to capture short, high-probability momentum moves — particularly effective on lower timeframes (1–5 min) during active market sessions. It is not a signal spam tool. Signals appear only when multiple objective conditions align. 🧠 Core Concept Markets do not move randomly — they seek liquidity before expanding. This indicator identifies: Buy-side / Sell-side liquidity Liquidity sweeps (stop-hunts) Strong displacement candles reclaiming price Optional higher-timeframe trend alignment Only when all conditions are met does a signal print. 🔍 What the Indicator Detects 1️⃣ Liquidity Pools Equal highs or equal lows detected within a configurable lookback Minimum number of touches required ATR-based tolerance to adapt to volatility These levels represent areas where stop orders are likely resting. 2️⃣ Liquidity Sweep A valid sweep requires: Price to wick beyond the liquidity level Candle to close back inside the range This indicates failed breakout / stop-hunt behaviour. 3️⃣ Displacement Confirmation After the sweep, the candle must show: Strong body (default >60% of candle range) Candle range large relative to ATR Clear directional intent (momentum) This filters out weak reactions and chop. 4️⃣ Optional Trend Filter EMA-based higher-timeframe bias Helps align scalps with dominant direction Can be enabled or disabled 📈 Signals BUY: Sell-side liquidity sweep → bullish displacement SELL: Buy-side liquidity sweep → bearish displacement Signals are plotted directly on the chart and can be used with alerts. ⚙️ Recommended Usage Markets: XAUUSD, indices, liquid FX pairs Timeframes: 1m–5m Sessions: London & New York (best performance) Risk Management: Always required — this tool does not place trades Best used as a confirmation tool, not standalone. ⚠️ Important Notes This indicator is inspired by liquidity-based scalping concepts, not an exact replication of any individual trader’s private strategy. No indicator predicts the future — this tool highlights high-probability scenarios, not guarantees. Past performance is not indicative of future results.Pine Script® indicatorby APCapitalTrading1145
Apex Edge Sentinel - Stop Loss HUDApex Edge – ATR Sentinel Stop Loss HUD The Apex Edge – ATR Sentinel is a complete stop-loss intelligence system built as a clean, always-on HUD. It delivers institutional-level risk guidance by calculating and displaying live ATR-based stop levels for both long and short trades at multiple risk tolerances. Forget cluttered charts and repainting lines — Sentinel gives you a clear stop-loss reference panel that updates dynamically with every bar. ✅ Features • Triple ATR Multipliers User-defined (e.g. x1.5 / x2.0 / x2.5). Compare tight, medium, and wide stops instantly. • Dual-Side SL Levels Both Long and Short safe stop prices displayed side by side. No more guessing trend bias. • ATR Transparency HUD shows ATR(length) so you always know the calculation basis. Default = 14, adjustable to your style. • ATR Regime Meter Detects volatility conditions (LOW / NORMAL / HIGH) by comparing ATR to its SMA. Helps you avoid over-tight stops in high-volatility markets. • Tick-Aware Rounding Stop levels auto-rounded to the instrument’s tick size (Gold = 0.10, FX = 0.0001, indices = whole points). Custom HUD Design • Location: Top/Bottom, Left/Right • Sizes: Compact / Medium / Large (desktop or mobile) • Opacity control (25% default Apex styling) How to Use 1. Load Sentinel on your chart. 2. Check the HUD: • ATR(14): 2.6 → base volatility measure. • x1.5 / x2.0 / x2.5 → instant SL levels for both long & short trades. 3. Before entering a trade → decide which multiplier matches your style (tight scalper vs wider swing). 4. Manually place your SL at the level displayed in the HUD. Sentinel works as both: • A pre-trade check (is ATR stop too wide for my RR?). • A live risk compass (updated stop levels every bar). Why Apex Sentinel? Most ATR stop indicators clutter charts with lagging lines or repainting trails. Sentinel strips it back to what matters: • The numbers. • The risk levels. • The context. It’s a pure stop-loss HUD, designed for serious traders who want clarity, discipline, and instant reference points across any market or timeframe. Notes • This is a HUD-only system (no automatic SL line). Traders manually apply the SL level shown in the panel. • Defaults: ATR(14), multipliers 1.5 / 2.0 / 2.5. Adjust to your trading style. • Best used on intraday pairs like XAUUSD, EURUSD, indices, but works universally. Apex Edge Philosophy: Clean. Smart. Institutional. No clutter. No gimmicks. Just precision tools for modern markets. Pine Script® indicatorby ApexEdge19
Sector Rotation & Money Flow Dashboard📊 Overview The Sector Rotation & Money Flow Dashboard is a comprehensive market analysis tool that tracks 39 major sector ETFs in real-time, providing institutional-grade insights into sector rotation, momentum shifts, and money flow patterns. This indicator helps traders identify which sectors are attracting capital, which are losing favor, and where the next opportunities might emerge. Perfect for swing traders, position traders, and investors who want to stay ahead of sector rotation and ride the strongest trends while avoiding weak sectors. 🎯 What This Indicator Does Tracks 39 Major Sectors: From technology to utilities, cryptocurrencies to commodities Calculates Multiple Timeframes: 1-week, 1-month, 3-month, and 6-month performance Advanced Momentum Metrics: Proprietary momentum score and acceleration calculations Relative Strength Analysis: Compare sector performance against any benchmark index Money Flow Signals: Visual indicators showing where institutional money is moving Smart Filtering: Pre-built strategy filters for different trading styles Trend Detection: Emoji-based visual system for quick trend identification 💡 Key Features 1. Performance Metrics Multiple timeframe analysis (1W, 1M, 3M, 6M) Month-over-month change tracking Relative strength vs benchmark index 2. Advanced Analytics Momentum Score: Weighted composite of recent performance Acceleration: Rate of change in momentum (second derivative) Money Flow Signals: IN/OUT/TURN/WATCH indicators 3. Strategy Preset Filters 🎯 Swing Trade: High momentum opportunities 📈 Trend Follow: Established uptrends 🔄 Mean Reversion: Oversold bounce candidates 💎 Value Hunt: Deep value opportunities 🚀 Breakout: Emerging strength ⚠️ Risk Off: Sectors to avoid 4. Customization All 39 sector ETFs can be customized Adjustable benchmark index Flexible display options Multiple sorting methods 📋 Settings Documentation Display Settings Show Table (Default: On) Toggles the entire dashboard display Table Position (Default: Middle Center) Choose from 9 positions on your chart Options: Top/Middle/Bottom × Left/Center/Right Rows to Show (Default: 15) Number of sectors displayed (5-40) Useful for focusing on top/bottom performers Sort By (Default: Momentum) 1M/3M/6M: Sort by specific timeframe performance Momentum: Weighted recent performance score Acceleration: Rate of momentum change 1M Change: Month-over-month improvement RS: Relative strength vs benchmark Flow: IN First: Prioritize sectors with inflows Flow: TURN First: Focus on reversal candidates Recovery Plays: Oversold sectors recovering Oversold Bounce: Deepest declines with positive signs Top Gainers/Losers 3M: Best/worst quarterly performers Best Acc + Mom: Combined strength score Worst Acc (Topping): Sectors losing momentum Filter Settings Strategy Preset Filter (Default: All) All: No filtering 🎯 Swing Trade: Mom >5, Acc >2, Money flowing in 📈 Trend Follow: Positive 1M & 3M, RS >0 🔄 Mean Reversion: Oversold but improving 💎 Value Hunt: Down >10% with recovery signs 🚀 Breakout: Rapid momentum surge ⚠️ Risk Off: Declining or topping sectors Custom Flow Filter: Use manual flow filter Custom Flow Signal Filter (Default: All) Only active when Strategy Preset = "Custom Flow Filter" IN Only: Strong inflows TURN Only: Reversal signals WATCH Only: Recovery candidates OUT Only: Outflow sectors Active Flows Only: Any non-neutral signal Hide Low Volume ETFs (Default: Off) Filters out illiquid sectors (future enhancement) Visual Settings Show Trend Emojis (Default: On) 🚀 Breakout (Strong 1M + High Acceleration) 🔥 Hot Recovery (From -10% to positive) 💪 Steady Uptrend (All timeframes positive) ➡️ Sideways/Ranging ⚠️ Warning/Topping (Up >15%, now slowing) 📉 Falling (Negative + declining) 🔄 Bottoming (Improving from lows) Compact Mode (Default: Off) Removes decimals for cleaner display Useful when showing many rows Min Data Points Required (Default: 3) Minimum data points needed to display a sector Prevents showing sectors with insufficient data Relative Strength Settings RS Benchmark Index (Default: AMEX:SPY) Index to compare all sectors against Can use SPY, QQQ, IWM, or any other index RS Period (Days) (Default: 21) Lookback period for RS calculation 21 days = 1 month, 63 days = 3 months, etc. Sector ETF Settings (Groups 1-39) Each sector has two inputs: Symbol: The ticker (e.g., "AMEX:XLF") Name: Display name (e.g., "Financials") All 39 sectors can be customized to track different ETFs or markets. 📈 Column Explanations Sector: ETF name/description 1M%: 1-month (21-day) performance 3M%: 3-month (63-day) performance 6M%: 6-month (126-day) performance Mom: Momentum score (weighted average, recent-biased) Acc: Acceleration (momentum rate of change) Δ1M: Month-over-month change RS: Relative strength vs benchmark Flow: Money flow signal ↗️ IN: Strong inflows 🔄 TURN: Potential reversal 👀 WATCH: Recovery candidate ↘️ OUT: Outflows —: Neutral 🎮 Usage Tips For Swing Traders (3-14 days) Use "🎯 Swing Trade" filter Sort by "Acceleration" or "Momentum" Look for Flow = "IN" and Mom >10 Confirm with positive RS For Position Traders (2-8 weeks) Use "📈 Trend Follow" filter Sort by "RS" or "Best Acc + Mom" Focus on consistent green across timeframes Ensure RS >3 for market leaders For Value Investors Use "💎 Value Hunt" filter Sort by "Recovery Plays" or "Top Losers 3M" Look for improving Δ1M Check for "WATCH" or "TURN" signals For Risk Management Regularly check "⚠️ Risk Off" filter Sort by "Worst Acc (Topping)" Review holdings for ⚠️ warning emojis Exit sectors showing "OUT" flow Market Regime Recognition Bull Market: Many sectors showing "IN" flow, positive RS Bear Market: Widespread "OUT" flows, negative RS Rotation: Mixed flows, some "IN" while others "OUT" Recovery: Multiple "TURN" and "WATCH" signals 🔧 Pro Tips Combine Filters + Sorting: Filter first to narrow candidates, then sort to prioritize Multi-Timeframe Confirmation: Best setups show alignment across 1M, 3M, and momentum RS is Key: Sectors outperforming SPY (RS >0) tend to continue outperforming Acceleration Matters: Positive acceleration often precedes price breakouts Flow Transitions: "WATCH" → "TURN" → "IN" progression identifies new trends early Regular Scans: Daily: Check "Acceleration" sort Weekly: Review "1M Change" Monthly: Analyze "RS" shifts Divergence Signals: Price up but Acceleration down = Potential top Price down but Acceleration up = Potential bottom Sector Pairs Trading: Long sectors with "IN" flow, short sectors with "OUT" flow ⚠️ Important Notes This indicator makes 40 security requests (maximum allowed) Best used on Daily timeframe Data updates in real-time during market hours Some ETFs may show "—" if data is unavailable 🎯 Common Strategies "Follow the Flow" Only trade sectors showing "IN" flow with positive RS "Rotation Catcher" Focus on "TURN" signals in sectors down >15% from highs "Momentum Rider" Trade top 3 sectors by Momentum score, exit when Acceleration turns negative "Mean Reversion" Buy sectors in bottom 20% by 3M performance when Δ1M improves "Relative Strength Leader" Maintain positions only in sectors with RS >5 Not financial advice - always do additional researchPine Script® indicatorby colicoid1515467
ORB - Futures and Stocks (Breakouts + Alerts + ORB Selector)This indicator shows the Opening Range Breakout (ORB) based on the time range you choose. Important: It only works for intraday trading on time frames less than 1 day (like 1-minute, 5-minute, or hourly charts). You can use it with any stock or futures, such as US500, NAS100, or GER40. Inputs: ORB Range - Your preference. Session Start Time Zone Offset Examples: for EU Frankfurt, DAX (GER40): Set your ORB range Session Start 0900 Time Zone Offset +1 For US Stock Market and US500, NAS100: Set your ORB range Session Start 0930 Time Zone Offset -5 Created using ChatGPTPine Script® indicatorby tolosatrader150
[SHORT ONLY] 10 Bar Low Pullback█ STRATEGY DESCRIPTION The "10 Bar Low Pullback" strategy is a contrarian short trading system designed to capture pullbacks after a new 10‐bar low is made. it identifies a potential short opportunity when the current bar’s low breaks below the lowest low of the previous 10 bars, provided that the bar exhibits strong internal momentum as measured by its IBS value. An optional trend filter further refines entries by requiring that the close is below a 200-period EMA. █ WHAT IS INTERNAL BAR STRENGTH (IBS)? Internal Bar Strength (IBS) measures where the closing price falls within the high-low range of a bar. It is calculated as: ibs = (close - low) / (high - low) - Low IBS (≤ 0.2): Indicates the close is near the bar's low, suggesting oversold conditions. - High IBS (≥ 0.8): Indicates the close is near the bar's high, suggesting overbought conditions. █ SIGNAL GENERATION 1. SHORT ENTRY A Short Signal is triggered when: The current bar’s low is below the lowest low of the past X bars (default: 10). The bar’s IBS is greater than the specified threshold (default: 0.85). The signal occurs within the defined trading window (between Start Time and End Time). If the EMA Filter is enabled, the close must be below the 200-period EMA. 2. EXIT CONDITION An exit Signal is generated when the current close falls below the previous bar’s low (close < low ), indicating a potential bearish reversal and prompting the strategy to close its short position. █ ADDITIONAL SETTINGS Lookback Period: Defines the number of bars (default is 10) over which the lowest low is calculated. IBS Threshold: Sets the minimum required IBS value (default is 0.85) to qualify as a pullback. Trading Window: Trades are only executed between the user-defined Start Time and End Time. EMA Filter (Optional): When enabled, short entries are only considered if the current close is below the 200-period EMA, with the EMA period being adjustable (default is 200). █ PERFORMANCE OVERVIEW Designed for shorting opportunities, this strategy aims to capture pullbacks following an aggressive 10-bar low break. It leverages a combination of a lookback low and IBS measurement to identify overextended bullish moves that may revert. The optional EMA filter helps confirm a bearish market environment by ensuring the price remains under the trend line. Suitable for use on various assets, including stocks and ETFs, on daily or similar timeframes. Backtesting and parameter optimization are recommended to tailor the strategy to specific market conditions. Pine Script® strategyby Botnet10184
[SHORT ONLY] Internal Bar Strength (IBS) Mean Reversion Strategy█ STRATEGY DESCRIPTION The "Internal Bar Strength (IBS) Strategy" is a mean-reversion strategy designed to identify trading opportunities based on the closing price's position within the daily price range. It enters a short position when the IBS indicates overbought conditions and exits when the IBS reaches oversold levels. This strategy is Short-Only and was designed to be used on the Daily timeframe for Stocks and ETFs. █ WHAT IS INTERNAL BAR STRENGTH (IBS)? Internal Bar Strength (IBS) measures where the closing price falls within the high-low range of a bar. It is calculated as: IBS = (Close - Low) / (High - Low) - Low IBS (≤ 0.2) : Indicates the close is near the bar's low, suggesting oversold conditions. - High IBS (≥ 0.8) : Indicates the close is near the bar's high, suggesting overbought conditions. █ SIGNAL GENERATION 1. SHORT ENTRY A Short Signal is triggered when: The IBS value rises to or above the Upper Threshold (default: 0.9). The Closing price is greater than the previous bars High (close>high ). The signal occurs within the specified time window (between `Start Time` and `End Time`). 2. EXIT CONDITION An exit Signal is generated when the IBS value drops to or below the Lower Threshold (default: 0.3). This prompts the strategy to exit the position. █ ADDITIONAL SETTINGS Upper Threshold: The IBS level at which the strategy enters trades. Default is 0.9. Lower Threshold: The IBS level at which the strategy exits short positions. Default is 0.3. Start Time and End Time: The time window during which the strategy is allowed to execute trades. █ PERFORMANCE OVERVIEW This strategy is designed for Stocks and ETFs markets and performs best when prices frequently revert to the mean. The strategy can be optimized further using additional conditions such as using volume or volatility filters. It is sensitive to extreme IBS values, which help identify potential reversals. Backtesting results should be analyzed to optimize the Upper/Lower Thresholds for specific instruments and market conditions. Pine Script® strategyby Botnet10160
Bearish Wick Reversal█ STRATEGY OVERVIEW The "Bearish Wick Reversal Strategy" identifies potential bullish reversals following significant bearish price rejection (long lower wicks). This counter-trend approach enters long positions when bearish candles show exaggerated downside wicks relative to closing prices, then exits on bullish confirmation signals. Includes optional EMA trend filtering for improved reliability. █ What is a Bearish Wick? A price rejection pattern where: Bearish candle (close < open) forms with extended lower wick Wick represents failed selloff: Low drops significantly below close Measured as: (Low - Close)/Close × 100 (Negative percentage indicates downward extension) █ SIGNAL GENERATION 1. LONG ENTRY CONDITION Bearish candle forms with close < open Lower wick exceeds user-defined threshold (Default: -1% of close price) The signal occurs within the specified time window If enabled, the close price must also be above the 200-period EMA (Exponential Moving Average) 2. EXIT CONDITION A Sell Signal is generated when the current closing price exceeds the highest high of the previous seven bars (`close > _highest `). This indicates that the price has shown strength, potentially confirming the reversal and prompting the strategy to exit the position. █ PERFORMANCE OVERVIEW Ideal Market: Volatile instruments with frequent price rejections Key Risk: False signals in sustained bearish trends Optimization Tip: Test various thresholds Filter Impact: EMA reduces trades but improves win rate and reduces drawdown Pine Script® strategyby Botnet10190
Gap Down Reversal Strategy█ STRATEGY OVERVIEW The "Gap Down Reversal Strategy" capitalizes on price recovery patterns following bearish gap-down openings. This mean-reversion approach enters long positions on confirmed intraday recoveries and exits when prices breach previous session highs. This strategy is NOT optimized. █ What is a Gap Down Reversal? A gap down reversal occurs when: An instrument opens significantly below its prior session's low (price gap) Selling pressure exhausts itself during the session Buyers regain control, pushing price back above the opening level Creates a candlestick with: • Open < Prior Session Low (true gap) • Close > Open (bullish reversal candle) █ SIGNAL GENERATION 1. LONG ENTRY CONDITION Previous candle closes BELOW its opening price (bearish candle) Current session opens BELOW prior candle's low (gap down) Current candle closes ABOVE its opening price (bullish reversal) Executes market order at session close 2. EXIT CONDITION A Sell Signal is generated when the current closing price exceeds the highest high of the previous seven bars (`close > _highest `). This indicates that the price has shown strength, potentially confirming the reversal and prompting the strategy to exit the position. █ PERFORMANCE OVERVIEW Ideal Market: High volatility instruments with frequent gaps Key Risk: False reversals in sustained downtrends Optimization Tip: Test varying gap thresholds (1-3% ranges) Pine Script® strategyby Botnet10176
Closing Prices for Indices AMMOthe "Closing Prices for Indices" indicator displays the daily closing prices of four major stock indices: FTSE 100, DAX 40, Dow Jones Industrial Average, and NASDAQ Composite. The indicator updates the prices based on their respective market closing times: FTSE 100 and DAX 40: Updates at 4:30 PM UK time. Dow Jones and NASDAQ Composite: Updates at 9:00 PM UK time. Key features: Customizable Labels: Option to display labels showing the closing prices directly on the chart. Color-Coded Lines: Plots each index's closing price using distinct, customizable colors for easy differentiation. User-Friendly Settings: Includes options for customizing line and label colors. This indicator is perfect for traders and analysts looking to monitor and compare key index closing prices visually on their charts. Pine Script® indicatorby punjabiwapUpdated 44
3 Down, 3 Up Strategy█ STRATEGY DESCRIPTION The "3 Down, 3 Up Strategy" is a mean-reversion strategy designed to capitalize on short-term price reversals. It enters a long position after consecutive bearish closes and exits after consecutive bullish closes. This strategy is NOT optimized and can be used on any timeframes. █ WHAT ARE CONSECUTIVE DOWN/UP CLOSES? - Consecutive Down Closes: A sequence of trading bars where each close is lower than the previous close. - Consecutive Up Closes: A sequence of trading bars where each close is higher than the previous close. █ SIGNAL GENERATION 1. LONG ENTRY A Buy Signal is triggered when: The price closes lower than the previous close for Consecutive Down Closes for Entry (default: 3) consecutive bars. The signal occurs within the specified time window (between Start Time and End Time). If enabled, the close price must also be above the 200-period EMA (Exponential Moving Average). 2. EXIT CONDITION A Sell Signal is generated when the price closes higher than the previous close for Consecutive Up Closes for Exit (default: 3) consecutive bars. █ ADDITIONAL SETTINGS Consecutive Down Closes for Entry: Number of consecutive lower closes required to trigger a buy. Default = 3. Consecutive Up Closes for Exit: Number of consecutive higher closes required to exit. Default = 3. EMA Filter: Optional 200-period EMA filter to confirm long entries in bullish trends. Default = disabled. Start Time and End Time: Restrict trading to specific dates (default: 2014-2099). █ PERFORMANCE OVERVIEW Designed for volatile markets with frequent short-term reversals. Performs best when price oscillates between clear support/resistance levels. The EMA filter improves reliability in trending markets but may reduce trade frequency. Backtest to optimize consecutive close thresholds and EMA period for specific instruments. Pine Script® strategyby Botnet10111114
Internal Bar Strength (IBS) Strategy█ STRATEGY DESCRIPTION The "Internal Bar Strength (IBS) Strategy" is a mean-reversion strategy designed to identify trading opportunities based on the closing price's position within the daily price range. It enters a long position when the IBS indicates oversold conditions and exits when the IBS reaches overbought levels. This strategy was designed to be used on the daily timeframe. █ WHAT IS INTERNAL BAR STRENGTH (IBS)? Internal Bar Strength (IBS) measures where the closing price falls within the high-low range of a bar. It is calculated as: IBS = (Close - Low) / (High - Low) - **Low IBS (≤ 0.2)**: Indicates the close is near the bar's low, suggesting oversold conditions. - **High IBS (≥ 0.8)**: Indicates the close is near the bar's high, suggesting overbought conditions. █ SIGNAL GENERATION 1. LONG ENTRY A Buy Signal is triggered when: The IBS value drops below the Lower Threshold (default: 0.2). The signal occurs within the specified time window (between `Start Time` and `End Time`). 2. EXIT CONDITION A Sell Signal is generated when the IBS value rises to or above the Upper Threshold (default: 0.8). This prompts the strategy to exit the position. █ ADDITIONAL SETTINGS Upper Threshold: The IBS level at which the strategy exits trades. Default is 0.8. Lower Threshold: The IBS level at which the strategy enters long positions. Default is 0.2. Start Time and End Time: The time window during which the strategy is allowed to execute trades. █ PERFORMANCE OVERVIEW This strategy is designed for ranging markets and performs best when prices frequently revert to the mean. It is sensitive to extreme IBS values, which help identify potential reversals. Backtesting results should be analyzed to optimize the Upper/Lower Thresholds for specific instruments and market conditions. Pine Script® strategyby Botnet101101
Buy on 5 day low Strategy█ STRATEGY DESCRIPTION The "Buy on 5 Day Low Strategy" is a mean-reversion strategy designed to identify potential buying opportunities when the price drops below the lowest low of the previous five days. It enters a long position when specific conditions are met and exits when the price exceeds the high of the previous day. This strategy is optimized for use on daily or higher timeframes. █ WHAT IS THE 5-DAY LOW? The 5-Day Low is the lowest price observed over the last five days. This level is used as a reference to identify potential oversold conditions and reversal points. █ SIGNAL GENERATION 1. LONG ENTRY A Buy Signal is triggered when: The close price is below the lowest low of the previous five days (`close < _lowest `). The signal occurs within the specified time window (between `Start Time` and `End Time`). 2. EXIT CONDITION A Sell Signal is generated when the current closing price exceeds the high of the previous day (`close > high `). This indicates that the price has shown strength, potentially confirming the reversal and prompting the strategy to exit the position. █ ADDITIONAL SETTINGS Start Time and End Time: The time window during which the strategy is allowed to execute trades. █ PERFORMANCE OVERVIEW This strategy is designed for mean-reverting markets and performs best when the price frequently oscillates around key support levels. It is sensitive to oversold conditions, as indicated by the 5-Day Low, and overbought conditions, as indicated by the previous day's high. Backtesting results should be analyzed to optimize the strategy for specific instruments and market conditions. Pine Script® strategyby Botnet101107
3-Bar Low Strategy█ STRATEGY DESCRIPTION The "3-Bar Low Strategy" is a mean-reversion strategy designed to identify potential buying opportunities when the price drops below the lowest low of the previous three bars. It enters a long position when specific conditions are met and exits when the price exceeds the highest high of the previous seven bars. This strategy is suitable for use on various timeframes. █ WHAT IS THE 3-BAR LOW? The 3-Bar Low is the lowest price observed over the last three bars. This level is used as a reference to identify potential oversold conditions and reversal points. █ WHAT IS THE 7-BAR HIGH? The 7-Bar High is the highest price observed over the last seven bars. This level is used as a reference to identify potential overbought conditions and exit points. █ SIGNAL GENERATION 1. LONG ENTRY A Buy Signal is triggered when: The close price is below the lowest low of the previous three bars (`close < _lowest `). The signal occurs within the specified time window (between `Start Time` and `End Time`). If the EMA Filter is enabled, the close price must also be above the 200-period Exponential Moving Average (EMA). 2. EXIT CONDITION A Sell Signal is generated when the current closing price exceeds the highest high of the previous seven bars (`close > _highest `). This indicates that the price has shown strength, potentially confirming the reversal and prompting the strategy to exit the position. █ ADDITIONAL SETTINGS MA Period: The lookback period for the 200-period EMA used in the EMA Filter. Default is 200. Use EMA Filter: Enables or disables the EMA Filter for long entries. Default is disabled. Start Time and End Time: The time window during which the strategy is allowed to execute trades. █ PERFORMANCE OVERVIEW This strategy is designed for mean-reverting markets and performs best when the price frequently oscillates around key support and resistance levels. It is sensitive to oversold conditions, as indicated by the 3-Bar Low, and overbought conditions, as indicated by the 7-Bar High. Backtesting results should be analyzed to optimize the MA Period and EMA Filter settings for specific instruments. Pine Script® strategyby Botnet10188
Bollinger Bands Reversal + IBS Strategy█ STRATEGY DESCRIPTION The "Bollinger Bands Reversal Strategy" is a mean-reversion strategy designed to identify potential buying opportunities when the price deviates below the lower Bollinger Band and the Internal Bar Strength (IBS) indicates oversold conditions. It enters a long position when specific conditions are met and exits when the IBS indicates overbought conditions. This strategy is suitable for use on various timeframes. █ WHAT ARE BOLLINGER BANDS? Bollinger Bands consist of three lines: - **Basis**: A Simple Moving Average (SMA) of the price over a specified period. - **Upper Band**: The basis plus a multiple of the standard deviation of the price. - **Lower Band**: The basis minus a multiple of the standard deviation of the price. Bollinger Bands help identify periods of high volatility and potential reversal points. █ WHAT IS INTERNAL BAR STRENGTH (IBS)? Internal Bar Strength (IBS) is a measure of where the closing price is relative to the high and low of the bar. It is calculated as: IBS = (Close - Low) / (High - Low) A low IBS value (e.g., below 0.2) indicates that the close is near the low of the bar, suggesting oversold conditions. A high IBS value (e.g., above 0.8) indicates that the close is near the high of the bar, suggesting overbought conditions. █ SIGNAL GENERATION 1. LONG ENTRY A Buy Signal is triggered when: The IBS value is below 0.2, indicating oversold conditions. The close price is below the lower Bollinger Band. The signal occurs within the specified time window (between `Start Time` and `End Time`). 2. EXIT CONDITION A Sell Signal is generated when the IBS value exceeds 0.8, indicating overbought conditions. This prompts the strategy to exit the position. █ ADDITIONAL SETTINGS Length: The lookback period for calculating the Bollinger Bands. Default is 20. Multiplier: The number of standard deviations used to calculate the upper and lower Bollinger Bands. Default is 2.0. Start Time and End Time: The time window during which the strategy is allowed to execute trades. █ PERFORMANCE OVERVIEW This strategy is designed for mean-reverting markets and performs best when the price frequently deviates from the Bollinger Bands. It is sensitive to oversold and overbought conditions, as indicated by the IBS, which helps to identify potential reversals. Backtesting results should be analyzed to optimize the Length and Multiplier parameters for specific instruments. Pine Script® strategyby Botnet10199
Average High-Low Range + IBS Reversal Strategy█ STRATEGY DESCRIPTION The "Average High-Low Range + IBS Reversal Strategy" is a mean-reversion strategy designed to identify potential buying opportunities when the price deviates significantly from its average high-low range and the Internal Bar Strength (IBS) indicates oversold conditions. It enters a long position when specific conditions are met and exits when the price shows strength by exceeding the previous bar's high. This strategy is suitable for use on various timeframes. █ WHAT IS THE AVERAGE HIGH-LOW RANGE? The Average High-Low Range is calculated as the Simple Moving Average (SMA) of the difference between the high and low prices over a specified period. It helps identify periods of increased volatility and potential reversal points. █ WHAT IS INTERNAL BAR STRENGTH (IBS)? Internal Bar Strength (IBS) is a measure of where the closing price is relative to the high and low of the bar. It is calculated as: IBS = (Close - Low) / (High - Low) A low IBS value (e.g., below 0.2) indicates that the close is near the low of the bar, suggesting oversold conditions. █ SIGNAL GENERATION 1. LONG ENTRY A Buy Signal is triggered when: The close price has been below the buy threshold (calculated as `upper - (2.5 * hl_avg)`) for a specified number of consecutive bars (`bars_below_threshold`). The IBS value is below the specified buy threshold (`ibs_buy_treshold`). The signal occurs within the specified time window (between `Start Time` and `End Time`). 2. EXIT CONDITION A Sell Signal is generated when the current closing price exceeds the high of the previous bar (`close > high `). This indicates that the price has shown strength, potentially confirming the reversal and prompting the strategy to exit the position. █ ADDITIONAL SETTINGS Length: The lookback period for calculating the average high-low range. Default is 20. Bars Below Threshold: The number of consecutive bars the price must remain below the buy threshold to trigger a Buy Signal. Default is 2. IBS Buy Threshold: The IBS value below which a Buy Signal is triggered. Default is 0.2. Start Time and End Time: The time window during which the strategy is allowed to execute trades. █ PERFORMANCE OVERVIEW This strategy is designed for mean-reverting markets and performs best when the price frequently deviates from its average high-low range. It is sensitive to oversold conditions, as indicated by the IBS, which helps to identify potential reversals. Backtesting results should be analyzed to optimize the Length, Bars Below Threshold, and IBS Buy Threshold parameters for specific instruments. Pine Script® strategyby Botnet10162
Turn of the Month Strategy on Steroids█ STRATEGY DESCRIPTION The "Turn of the Month Strategy on Steroids" is a seasonal mean-reversion strategy designed to capitalize on price movements around the end of the month. It enters a long position when specific conditions are met and exits when the Relative Strength Index (RSI) indicates overbought conditions. This strategy is optimized for use on daily or higher timeframes. █ WHAT IS THE TURN OF THE MONTH EFFECT? The Turn of the Month effect refers to the observed tendency of stock prices to rise around the end of the month. This strategy leverages this phenomenon by entering long positions when the price shows signs of a reversal during this period. █ SIGNAL GENERATION 1. LONG ENTRY A Buy Signal is triggered when: The current day of the month is greater than or equal to the specified `dayOfMonth` threshold (default is 25). The close price is lower than the previous day's close (`close < close `). The previous day's close is also lower than the close two days ago (`close < close `). The signal occurs within the specified time window (between `Start Time` and `End Time`). There is no existing open position (`strategy.position_size == 0`). 2. EXIT CONDITION A Sell Signal is generated when the 2-period RSI exceeds 65, indicating overbought conditions. This prompts the strategy to exit the position. █ ADDITIONAL SETTINGS Day of Month: The day of the month threshold for triggering a Buy Signal. Default is 25. Start Time and End Time: The time window during which the strategy is allowed to execute trades. █ PERFORMANCE OVERVIEW This strategy is designed to exploit seasonal price patterns around the end of the month. It performs best in markets where the Turn of the Month effect is pronounced. Backtesting results should be analyzed to optimize the `dayOfMonth` threshold and RSI parameters for specific instruments. Pine Script® strategyby Botnet10139
Consecutive Bars Above/Below EMA Buy the Dip Strategy█ STRATEGY DESCRIPTION The "Consecutive Bars Above/Below EMA Buy the Dip Strategy" is a mean-reversion strategy designed to identify potential buying opportunities when the price dips below a moving average for a specified number of consecutive bars. It enters a long position when the dip condition is met and exits when the price shows strength by exceeding the previous bar's high. This strategy is suitable for use on various timeframes. █ WHAT IS THE MOVING AVERAGE? The strategy uses either a Simple Moving Average (SMA) or an Exponential Moving Average (EMA) as a reference for identifying dips. The type and length of the moving average can be customized in the settings. █ SIGNAL GENERATION 1. LONG ENTRY A Buy Signal is triggered when: The close price is below the selected moving average for a specified number of consecutive bars (`consecutiveBarsTreshold`). The signal occurs within the specified time window (between `Start Time` and `End Time`). 2. EXIT CONDITION A Sell Signal is generated when the current closing price exceeds the high of the previous bar (`close > high `). This indicates that the price has shown strength, potentially confirming the reversal and prompting the strategy to exit the position. █ ADDITIONAL SETTINGS Consecutive Bars Threshold: The number of consecutive bars the price must remain below the moving average to trigger a Buy Signal. Default is 3. MA Type: The type of moving average used (SMA or EMA). Default is SMA. MA Length: The length of the moving average. Default is 5. Start Time and End Time: The time window during which the strategy is allowed to execute trades. █ PERFORMANCE OVERVIEW This strategy is designed for mean-reverting markets and performs best when the price frequently oscillates around the moving average. It is sensitive to the number of consecutive bars below the moving average, which helps to identify potential dips. Backtesting results should be analysed to optimize the Consecutive Bars Threshold, MA Type, and MA Length for specific instruments. Pine Script® strategyby Botnet101110
Turn around Tuesday on Steroids Strategy█ STRATEGY DESCRIPTION The "Turn around Tuesday on Steroids Strategy" is a mean-reversion strategy designed to identify potential price reversals at the start of the trading week. It enters a long position when specific conditions are met and exits when the price shows strength by exceeding the previous bar's high. This strategy is optimized for ETFs, stocks, and other instruments on the daily timeframe. █ WHAT IS THE STARTING DAY? The Starting Day determines the first day of the trading week for the strategy. It can be set to either Sunday or Monday, depending on the instrument being traded. For ETFs and stocks, Monday is recommended. For other instruments, Sunday is recommended. █ SIGNAL GENERATION 1. LONG ENTRY A Buy Signal is triggered when: The current day is the first day of the trading week (either Sunday or Monday, depending on the Starting Day setting). The close price is lower than the previous day's close (`close < close `). The previous day's close is also lower than the close two days ago (`close < close `). The signal occurs within the specified time window (between `Start Time` and `End Time`). If the MA Filter is enabled, the close price must also be above the 200-period Simple Moving Average (SMA). 2. EXIT CONDITION A Sell Signal is generated when the current closing price exceeds the high of the previous bar (`close > high `). This indicates that the price has shown strength, potentially confirming the reversal and prompting the strategy to exit the position. █ ADDITIONAL SETTINGS Starting Day: Determines the first day of the trading week. Options are Sunday or Monday. Default is Sunday. Use MA Filter: Enables or disables the 200-period SMA filter for long entries. Default is disabled. Start Time and End Time: The time window during which the strategy is allowed to execute trades. █ PERFORMANCE OVERVIEW This strategy is designed for markets with frequent weekly reversals. It performs best in volatile conditions where price movements are significant at the start of the trading week. Backtesting results should be analysed to optimize the Starting Day and MA Filter settings for specific instruments. Pine Script® strategyby Botnet1011168
Consecutive Bearish Candle Strategy█ STRATEGY DESCRIPTION The "Consecutive Bearish Candle Strategy" is a momentum-based strategy designed to identify potential reversals after a sustained bearish move. It enters a long position when a specific number of consecutive bearish candles occur and exits when the price shows strength by exceeding the previous bar's high. This strategy is optimized for use on various timeframes and instruments. █ SIGNAL GENERATION 1. LONG ENTRY A Buy Signal is triggered when: The close price has been lower than the previous close for at least `Lookback` consecutive bars. This indicates a sustained bearish move, suggesting a potential reversal. The signal occurs within the specified time window (between `Start Time` and `End Time`). 2. EXIT CONDITION A Sell Signal is generated when the current closing price exceeds the high of the previous bar (`close > high `). This indicates that the price has shown strength, potentially confirming the reversal and prompting the strategy to exit the position. █ ADDITIONAL SETTINGS Lookback: The number of consecutive bearish bars required to trigger a Buy Signal. Default is 3. Start Time and End Time: The time window during which the strategy is allowed to execute trades. █ PERFORMANCE OVERVIEW This strategy is designed for markets with frequent momentum shifts. It performs best in volatile conditions where price movements are significant. Backtesting results should be analysed to optimize the `Lookback` parameter for specific instruments. Pine Script® strategyby Botnet10170
4 Bar Momentum Reversal strategy█ STRATEGY DESCRIPTION The "4 Bar Momentum Reversal Strategy" is a mean-reversion strategy designed to identify price reversals following a sustained downward move. It enters a long position when a reversal condition is met and exits when the price shows strength by exceeding the previous bar's high. This strategy is optimized for indices and stocks on the daily timeframe. █ WHAT IS THE REFERENCE CLOSE? The Reference Close is the closing price from X bars ago, where X is determined by the Lookback period. Think of it as a moving benchmark that helps the strategy assess whether prices are trending upwards or downwards relative to past performance. For example, if the Lookback is set to 4, the Reference Close is the closing price 4 bars ago (`close `). █ SIGNAL GENERATION 1. LONG ENTRY A Buy Signal is triggered when: The close price has been lower than the Reference Close for at least `Buy Threshold` consecutive bars. This indicates a sustained downward move, suggesting a potential reversal. The signal occurs within the specified time window (between `Start Time` and `End Time`). 2. EXIT CONDITION A Sell Signal is generated when the current closing price exceeds the high of the previous bar (`close > high `). This indicates that the price has shown strength, potentially confirming the reversal and prompting the strategy to exit the position. █ ADDITIONAL SETTINGS Buy Threshold: The number of consecutive bearish bars needed to trigger a Buy Signal. Default is 4. Lookback: The number of bars ago used to calculate the Reference Close. Default is 4. Start Time and End Time: The time window during which the strategy is allowed to execute trades. █ PERFORMANCE OVERVIEW This strategy is designed for trending markets with frequent reversals. It performs best in volatile conditions where price movements are significant. Backtesting results should be analysed to optimize the Buy Threshold and Lookback parameters for specific instruments. Pine Script® strategyby Botnet10111170
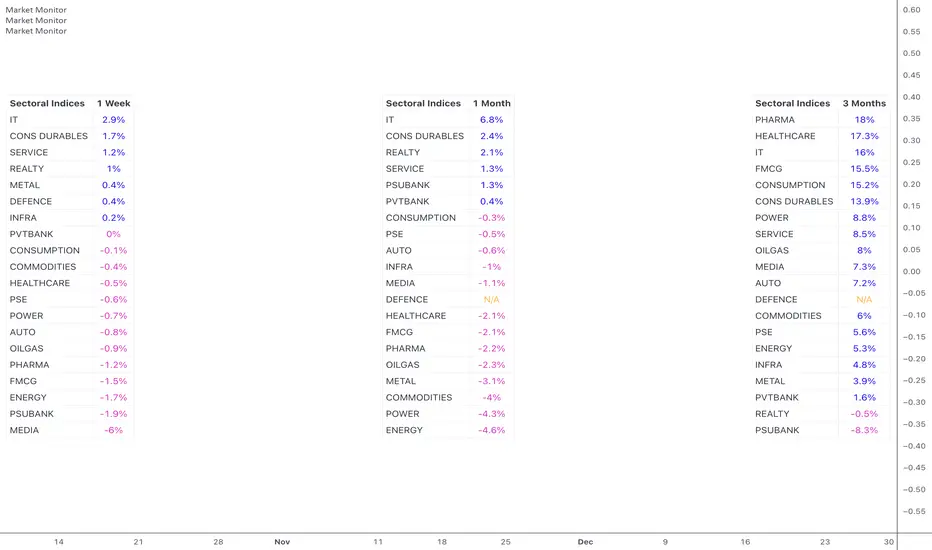
Market MonitorOverview The Market Monitor Indicator provides a customisable view of dynamic percentage changes across selected indices or sectors, calculated by comparing current and previous closing prices over the chosen timeframe. Key Features Choose up to 20 predefined indices or your own selected indices/stocks. Use checkboxes to show or hide individual entries. Monitor returns over daily, weekly, monthly, quarterly, half-yearly, or yearly timeframes Sort by returns (descending) to quickly identify top-performing indices or alphabetically for an organised and systematic review. Customisation Switch between Light Mode (Blue or Green themes) and Dark Mode for visual clarity. Adjust the table’s size, position, and location. Customise the table title to your own choice e.g. Sectoral, Broad, Portfolio etc. Use Cases Use multiple instances of the script with varying timeframes to study sectoral rotation and trends. Customise the stocks to see your portfolio returns for the day or over the past week, or longer. Pine Script® indicatorby finallynitinUpdated 1313 2.4 K
Sessioned EMA - Frozen EMA in post market hoursWhy I develop this indicator? In future indices, post market data with little volume distort the moving average seriously. This indicator is to eliminate the distortion of data during low volume post market hours. How to use? There is a time session setting in the indicator, you can set the cash hour time, moving average outside the session will be frozen. What this indicator gives you This indicator give you a more make sense ema pattern, the ema lines are more respected by the prices when you set the session properly. Setup 1. Session setting In US indices, such as NQ, ES etc, when there was data release at 0830 hr, huge volume transaction order appears, that makes the 0830 price data important that should be included in your ema trend line calculating. If that is the case, I will set the session begin from 0830, otherwise, I start the session at 0930. Golden rule : Price with huge volume counts. 2. Time zone The coding is decided for GMT+8 time zone, you may amend the code to fit your timezone.Pine Script® indicatorby MalibuKenny22139