TFPS_EngineLibrary "TFPS_Engine"
f_calculate_lead_lag(series1, series2, length, max_lag)
Parameters:
series1 (float)
series2 (float)
length (int)
max_lag (int)
f_calculate_pressure_score(spx_ticker, vix_ticker, dxy_ticker, us10y_ticker, benchmark_source, trend_lookback, score_smoothing, use_dynamic_weights, corr_lookback, w_spx, w_vix, w_dxy, w_us10y, zscore_lookback, max_lag)
Parameters:
spx_ticker (string)
vix_ticker (string)
dxy_ticker (string)
us10y_ticker (string)
benchmark_source (float)
trend_lookback (int)
score_smoothing (simple int)
use_dynamic_weights (bool)
corr_lookback (int)
w_spx (float)
w_vix (float)
w_dxy (float)
w_us10y (float)
zscore_lookback (int)
max_lag (int)
LeadLagOutput
Fields:
best_lag (series int)
max_corr (series float)
TFPS_Output
Fields:
historical_score (series float)
smoothed_score (series float)
z_score (series float)
regime_signal (series int)
lead_lag_bars (series int)
lead_lag_corr (series float)
weight_spx (series float)
weight_vix (series float)
weight_dxy (series float)
weight_us10y (series float)
Intermarket

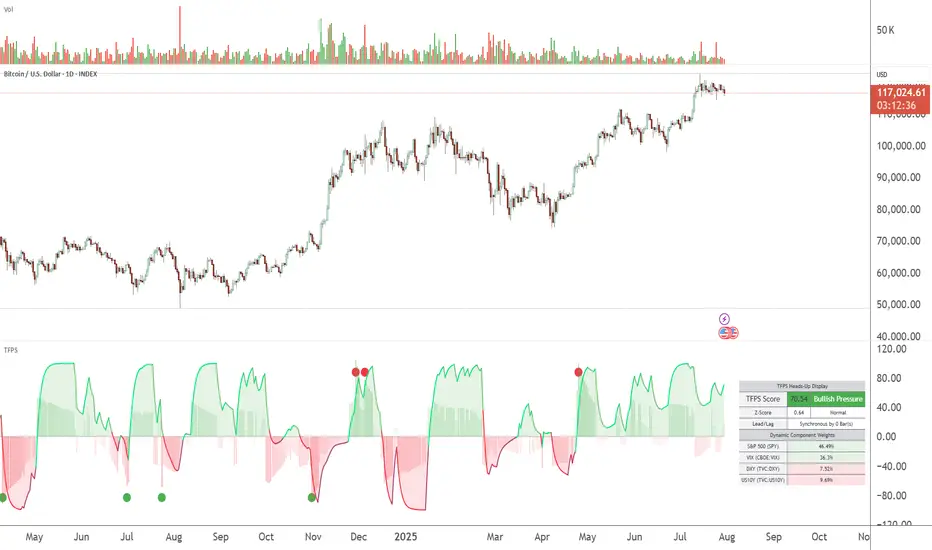
TFPS - TradFi Pressure ScoreThe Data-Driven Answer to a New Market Reality.
This indicator quantifies the pressure exerted by Wall Street on the crypto market across four critical dimensions: Risk Appetite, Fear, Liquidity Flows, and the Opportunity Cost of Capital. Our research has found that the correlation between this 4-dimensional pressure vector and crypto price action reaches peak values of 0.87. This is your decisive macro edge, delivered in real-time.
The Irreversible Transformation
A fundamental analysis of the last five years of market data proves an irreversible transformation: The crypto market has matured into a high-beta risk asset, its fate now inextricably linked to Traditional Finance (TradFi).
The empirical data is clear:
Bitcoin increasingly behaves like a leveraged version of the S&P 500.
The correlation to major stock indices is statistically significant and persistent.
The "digital gold" narrative is refuted by the data; the correlation to gold is virtually non-existent.
This means standard technical indicators are no longer sufficient. Tools like RSI or MACD are blind to the powerful, external macro context that now dominates price action. They see the effect, but not the cause.
The Solution: A 4-Dimensional Macro-Lens
The TradFi Pressure Score (TFPS) is the answer. It is an institutional-grade dashboard that aggregates the four most dominant external forces into a single, actionable score:
S&P 500 (SPY): The Pulse of Risk Appetite. A rising S&P signals a "risk-on" environment, fueling capital flows into crypto.
VIX: The Market's Fear Gauge. A rising VIX signals a "risk-off" flight to safety, draining liquidity from crypto.
DXY (US-Dollar Index): The Anchor of Global Liquidity. A strong Dollar (rising DXY) tightens financial conditions, creating powerful headwinds for risk assets like Bitcoin.
US 10Y Yield: The Opportunity Cost of Capital. Rising yields make risk-free assets more attractive, pulling capital away from non-yielding assets like crypto.
What makes the TFPS truly unique?
1. Dynamic Weighting (The Secret Weapon):
Which macro factor matters most right now? Is it a surging Dollar or a collapsing stock market? The TFPS answers this automatically. It continuously analyzes the correlation of all four components to your chosen asset (e.g., Bitcoin) and adjusts their influence in real-time. The dashboard shows you the exact live weights, ensuring you are always focused on the factor that is currently driving the market.
2. Adaptive Engine:
The forces driving a 15-minute chart are different from those driving a daily chart. The TFPS engine automatically recalibrates its internal lookback periods to your chosen timeframe. This ensures the score is always optimally relevant, whether you are a day trader or a swing trader.
3. Designed for Actionable Insights
The Pressure Line: The indicator's core output. Is its value > 0 (tailwind) or < 0 (headwind)? This provides an instant, unambiguous read on the macro environment for your trade.
The Z-Score (The Contrarian Signal): The background "Stress Cloud" and the discrete dots provide early warnings of extreme macro greed or fear. Readings above +2 or below -2 have historically pinpointed moments of market exhaustion that often precede major trend reversals.
Lead/Lag Status: Gain a critical edge by knowing who is in the driver's seat. The dashboard tells you if TradFi is leading the price action or if crypto is moving independently, allowing you to validate your trade thesis against the dominant market force.
This is a public indicator with protected source code
Access is now available for traders who understand the new market reality at the intersection of crypto and traditional finance.
You are among the first to leverage what is a new standard for macro analysis in crypto trading. Your feedback is highly valued as I continue to refine this tool.
Follow for updates and trade with the full context!
Strength Comparison @joshuuuexample:
if you want to find the stronger/weaker pair between eurusd and gbpusd, what you can do is check the eurgbp charts. if eurgbp is bullish, that means, that longs longs on eurusd are better than on gbpusd.
Unfortunately, there is no such thing to compare for example usoil with ukoil, or us100 with us500.
That's where this indicator comes in handy. You can choose whatever two symbols you want, that are supported by tradingview and you will get a chart, which shows symbol1/symbol2.
Now you can use normal market structure, or the ema option, to find out the stronger symbol.
This can also help predicting the so called SMT Divergences, taught by ICT.
⚠️ Open Source ⚠️
Coders and TV users are authorized to copy this code base, but a paid distribution is prohibited. A mention to the original author is expected, and appreciated.
⚠️ Terms and Conditions ⚠️
This financial tool is for educational purposes only and not financial advice. Users assume responsibility for decisions made based on the tool's information. Past performance doesn't guarantee future results. By using this tool, users agree to these terms.

Correlation with Matrix TableCorrelation coefficient is a measure of the strength of the relationship between two values. It can be useful for market analysis, cryptocurrencies, forex and much more.
Since it "describes the degree to which two series tend to deviate from their moving average values" (1), first of all you have to set the length of these moving averages. You can also retrieve the values from another timeframe, and choose whether or not to ignore the gaps.
After selecting the reference ticker, which is not dependent from the chart you are on, you can choose up to eight other tickers to relate to it. The provided matrix table will then give you a deeper insight through all of the correlations between the chosen symbols.
Correlation values are scored on a scale from 1 to -1
A value of 1 means the correlation between the values is perfect.
A value of 0 means that there is no correlation at all.
A value of -1 indicates that the correlation is perfectly opposite.
For a better view at a glance, eight level colors are available and it is possible to modify them at will. You can even change level ranges by setting their threshold values. The background color of the matrix's cells will change accordingly to all of these choices.
The default threshold values, commonly used in statistics, are as follows:
None to weak correlation: 0 - 0.3
Weak to moderate correlation: 0.3 - 0.5
Moderate to high correlation: 0.5 - 0.7
High to perfect correlation: 0.7 - 1
Remember to be careful about spurious correlations, which are strong correlations without a real causal relationship.
(1) www.tradingview.com

USDJPY Assumption v1Based on the "logical trading" post of Charles Cornley (thanks!).
Indicator States:
Very Bullish (Lime) = USD trend rising and JPY trend falling and Gold trend falling and US 10Y Bond trend falling and
Dow Jones trend rising and Nasdaq trend rising and Russell 2000 trend rising and
S&P 500 trend rising and Nikkei 225 trend rising
Bullish (Green) = USD trend rising and JPY trend falling
Bearish (Red) = USD trend falling and JPY trend rising
