Session Opening Range Breakout (ORBO)This strategy automates a classic Opening Range Breakout (ORBO) approach: it builds a price range for the first minutes after the market opens, then looks for strong breakouts above or below that range to catch early directional moves.
Concept
The idea behind ORBO is simple:
The first minutes after the session open are often highly informative.
Price forms an “opening range” that acts as a mini support/resistance zone.
A clean breakout beyond this zone can lead to high-momentum moves.
This script turns that logic into a fully backtestable strategy in TradingView.
How the strategy works
Opening Range Session
Default session: 09:30–09:50 (exchange time)
During this window, the script tracks:
orHigh → highest high within the session
orLow → lowest low within the session
This forms your Opening Range for the day.
Breakout Logic (after the window ends)
Once the defined session ends:
Long Entry:
If the close crosses above the Opening Range High (orHigh),
→ strategy.entry("OR Long", strategy.long) is triggered.
Short Entry:
If the close crosses below the Opening Range Low (orLow),
→ strategy.entry("OR Short", strategy.short) is triggered.
Only one opening range per day is considered, which keeps the logic clean and easy to interpret.
Daily Reset
At the start of a new trading day, the script resets:
orHigh := na
orLow := na
A fresh Opening Range is then built using the next session’s 09:30–09:50 candles.
This ensures entries are always based on today’s structure, not yesterday’s.
Visuals & Inputs
Inputs:
Opening range session → default: "0930-0950"
Show OR levels → toggle visibility of OR High / Low lines
Fill range body → optional shaded zone between OR High and OR Low
Chart visuals:
A green line marks the Opening Range High.
A red line marks the Opening Range Low.
Optional yellow fill highlights the entire OR zone.
Background shading during the session shows when the range is currently being built.
These visuals make it easy to see:
Where the OR sits relative to current price
How clean / noisy the breakout was
How often price respects or rejects the opening zone
Backtesting & Optimization
Because this is written as a strategy():
You can use TradingView’s Strategy Tester to view:
Win rate
Net profit
Drawdown
Profit factor
Equity curve
Ideas to experiment with:
Change the session window (e.g., 09:15–09:45, 10:00–10:30)
Apply to different:
Markets: indices, FX, crypto, stocks
Timeframes: 1m / 5m / 15m
Add your own:
Stop Loss & Take Profit levels
Time filters (only trade certain days / times)
Volatility filters (e.g., ATR, range size thresholds)
Higher-timeframe trend filter (e.g., only take longs above 200 EMA)
Intra

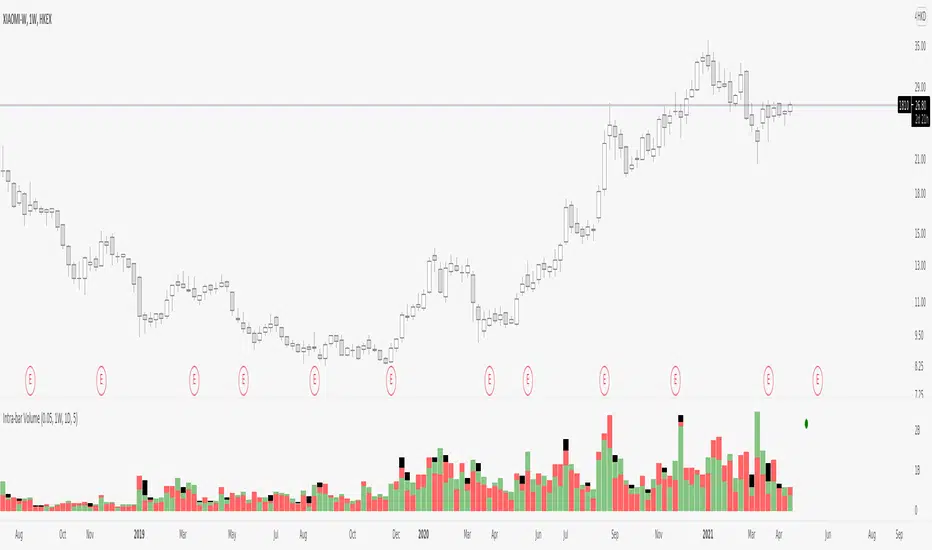
Intra-bar VolumeDisclamer : READ THIS BEFORE USING IT !!!
I have take and try to improuve the source code of indicator "intra-bar volume" by backtest-rookies.com
This indicator categorized the volume in lower timeframe, if the candle close up it's a buying volume, if it close down...
Beware that is not easy to work with different TF on tradingview so you have some limitation on the TF with this indicator. Also in TV we can't have a mutable variable in a security fonction.. so my approche is not clean but it works, if someone find better way, please comment or contact me :)
So by default the indicator can work on the following TF : 5m 15m 30m 60m 120m 240m 480m 720m 1D 1W 12M.
But ... this indicator need a lower timeframe and the number of bar to work correctly, in my code i suppose that the market run 24/7, so you need to adapte it or use intraday TF for other market.
To make sure that the indicator work correctly i have juste add circle, if it's green the buying+selling+balance volume is equal to the volume on the last close candle. If it's red theire is a problem.
I hope you enjoy it, feel free to modify the code and comment if you have any sugestion, i have just make it so maybe i will ajust some part of the code.