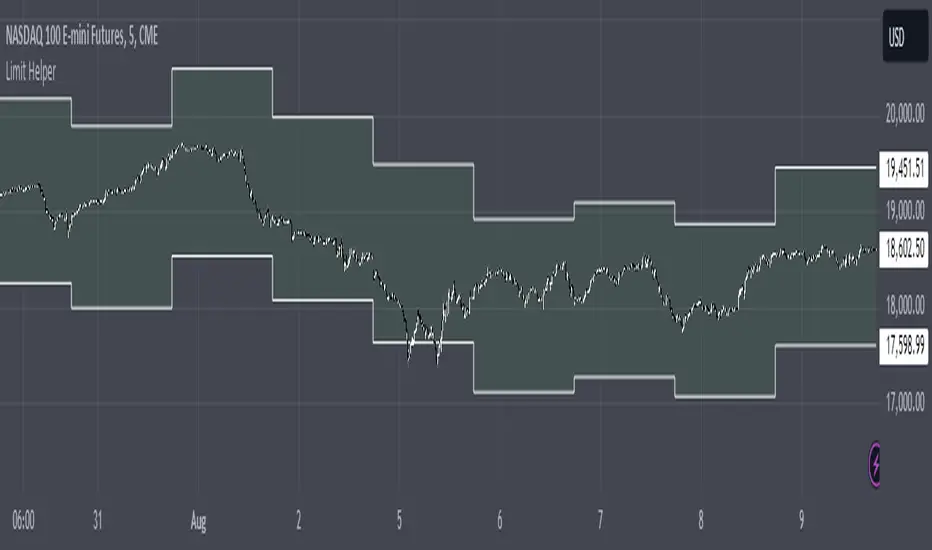
Limit HelperPlots an area based on daily settlement price +/- 5% of the current market you are looking at.
This is of particular interest to those who trade with Topstep's XFA or Live accounts.
Limits
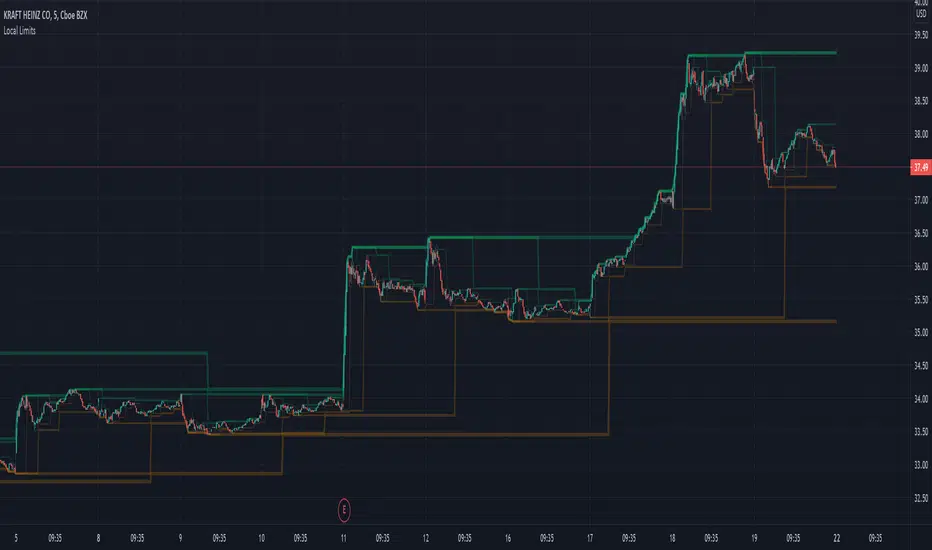
Local LimitsDisplays recent higher highs, lower highs, lower lows, and higher lows as a collection of local limit indicators.
In its simplicity is a lot more powerful than might appear at first glance.
Does not rely on volatility calculation.
Can be linked together to create an objective view of recent support and resistance levels.
Makes current trends more visible.
Excellent for use as a trailing stop algorithm.
Parameters
Single Bar Sensitivity: True (default) reacts to individual bars. False only responds to the alignment of 2 bars.
Margin (1-5): Adds extra distance from higher lows and lower highs to reduce the sensitivity of broken trends.
Single indicators with configurable sources:
Local Limit Higher
Local Limit Lower
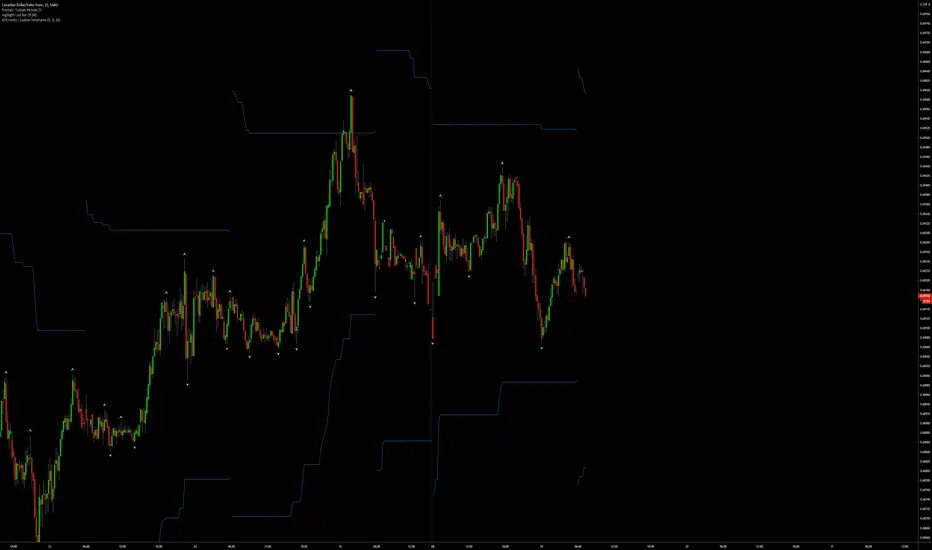
ATR Limits | Custom Timeframe | Day | Week | Month | H4 | H1Marks out the ATR limits for your own custom selected timeframe
Allows you to set an "Exact Distance" for the ATR.
Note:
If the "Exact Distance" is set = 0
then an ATR will be calculated for you based on an average of the "ATR Periods"
i.e. By Default: atr(20)
Otherwise if "Exact Distance" is not = 0
then ATR limits will be calculated using your specified distance
E.g. Exact Distance = 0.5
Low of Day = 1.0
High of Day = 1.1
ATR Limit Low = 1.1 - 0.5 = 0.6
ATR Limit High = 1.0 + 0.5 = 1.5
Enjoy!