Micro/Mini P&L [LDT]Overview
Micro/Mini P&L is a risk and P&L visualization tool built primarily for futures traders.
It provides accurate dollar-based calculations for either micros or minis, regardless of which contract type you are currently charting.
The indicator automatically detects your instrument (NQ, MNQ, ES, MES, YM, RTY, CL, GC, etc.) and adjusts point-value data accordingly, allowing you to chart one contract while evaluating risk for another.
This removes the need for manual conversions and keeps your position data consistent at all times.
Although optimized for futures, the tool also works on any other asset for general trade-level visualization.
Features
• Automatic instrument detection for major futures markets including NQ/MNQ, ES/MES, YM/MYM, RTY/M2K, CL/MCL, GC/MGC and others.
Point-value logic adjusts instantly based on the detected symbol ensuring accurate calculations without manual configuration.
• Micro/Mini display toggle, allowing you to calculate dollar values for either contract type regardless of which contract is on your chart.
Useful for traders who prefer charting minis whilst trading micros or the opposite.
• Trade-level visualization, including Entry, Take Profit and Stop Loss levels with automatically drawn lines and optional TP/SL zone shading for clear and structured display on the chart.
• Dynamic P/L calculations, showing both point-based and dollar-based metrics in real time.
This includes TP/SL dollar values, points to target/stop, real-time P/L and an optional risk-reward ratio.
• Adaptive risk table, displaying contract counts from 1 up to your selected maximum, total dollar risk for each row and highlighting your chosen contract size.
This provides a straightforward method for evaluating risk, scaling and position sizing.
• Customizable display options, including color settings, label visibility, extension length, bar offsets and table positioning.
This allows the tool to remain clean, unobtrusive and easy to integrate into any chart layout.
Purpose
This tool is designed to give futures traders a clear, consistent and reliable way to view dollar-accurate risk per contract without performing manual conversions.
Whether you trade micros or minis, the displayed values always align with your selected contract type, even when charting the opposite market.
Micro

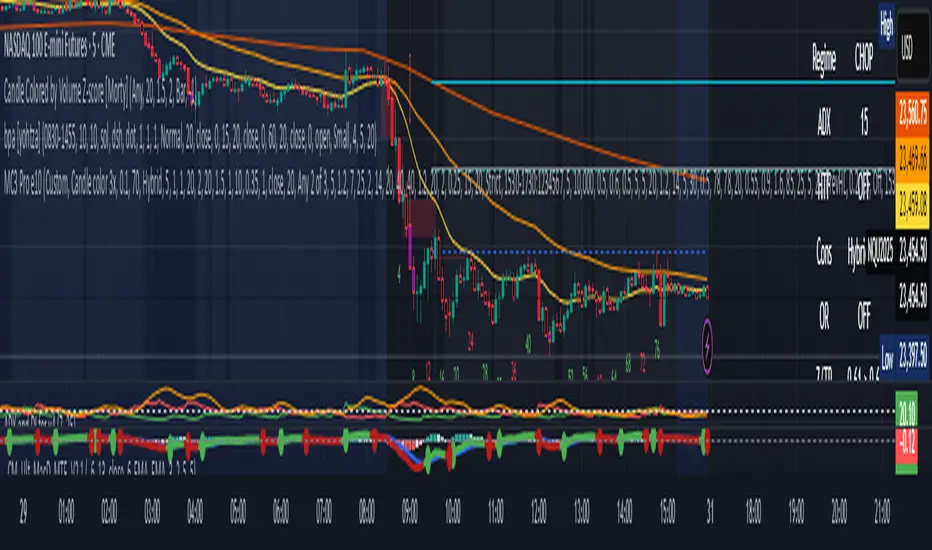
MC3 Pro Ultra e10Al-Brooks style MC3/Thrust signals with smart gating: EMA, Wilder ADX/DI, Consolidation, BO+FT, Z-score, Volume, RSI div, HTF EMA, Structure, OR/Blackout, Smart Cooldown. Non-repainting.
Full Description (for the main page)
MC3 Pro Ultra — Invite-Only (Al Brooks–inspired)
A high-discipline entry tool for 3-bar micro-channels (MC3) and optional 1-bar thrusts (MC1). Signals are filtered by a layered “gate” system: EMA side/slope/distance, Wilder ADX/DI, Consolidation (Box, BB<KC, Efficiency Ratio), Breakout+Follow-Through (BO+FT), TR Z-score expansion, Volume (mild/strict), true RSI divergence, HTF EMA (side/slope/strict), Market Structure (HH/HL vs LH/LL with optional BOS), Liquidity sweep guard, Open Range gate, Blackout windows (news) and Smart Cooldown v2.
Everything is non-repainting (evaluated on bar close or using closed higher-TF values).
What it does
MC3 (3-bar micro-channel) & Thrust (MC1) entries in both directions.
Auto regime: dynamically tightens thresholds in chop and relaxes them in trend.
BO+FT confirm: bar-3 must close beyond prior H/L by X points and near the extreme; optional follow-through (no immediate pullback).
Z-Score (TR): requires statistical range expansion (any bar inside the MC3).
EMA filter: side rule (All 3 / Any 2 / Last), slope, and max ATR distance.
Wilder ADX/DI: strength/rend bias; optional DI dominance.
Consolidation filter: Box+ATR (with break confirmation), Squeeze (BB<KC), or ER (Efficiency Ratio).
Volume gate: mild (above SMA×mult) or strict (3-bar rising).
True RSI divergence: pivot-based; blocks when divergence contradicts direction.
HTF EMA (non-repainting): side/slope/strict from a higher timeframe using closed bars.
Market Structure: longs only in HH/HL, shorts only in LH/LL; optional fresh BOS.
Liquidity Sweep guard: block-against or require-with sweep.
Open Range gate: require OR breakout before entries (optional).
Blackout windows: disable signals during macro/news windows.
Smart Cooldown v2: EMA-stretch + clustering penalty to avoid over-trading.
Retest mode (visual): after a signal, watch for a pullback to prev H/L or an EMA±ATR band.
Panel & Debug: status panel (regime, ADX, HTF, CONS, Z/TR, score, gates) + debug reasons for blocked signals.
R overlay: draws entry/stop/targets and an approximate position size.
Non-repainting: uses barstate.isconfirmed and closed HTF values. Signals print on bar close.
Presets
NQ A+ (2m/5m) – fast trend bias. BO+FT & Z-score on, Volume mild, DI dominance on, HTF strict.
NQ Pullback-safe (5m) – more conservative, higher min score & BO/Z thresholds.
ES 5m – balanced default.
(You can also use Custom and tweak only 2–3 knobs at a time.)
Suggested markets/timeframes: CME index futures (NQ/ES), 2m/5m/15m. Works on FX/indices/crypto with sensible retuning.
How to read signals
Green/Red arrows mark confirmed MC3 or Thrust entries (printed after bar closes).
Label shows S=Score and THR if the thrust override triggered.
Panel (top-right) shows: Regime (TREND/CHOP), ADX (prev closed bar optional), HTF (side/slope), Consolidation mode, OR status, current Z/TR vs threshold, Score≥, and quick Gates (✓/✗) for long/short.
Debug (optional, last bar): concatenated reasons why a signal did not pass (e.g., ).
Retest mode places “RT” markers when price pulls back to the chosen retest source.
Key inputs (high-level)
Definition: MC3 (color / close-to-close / micro-channel HL / combo), optional Thrust override.
EMA: side rule, slope, max ATR distance (with soft scoring).
ADX/DI: Wilder ADX len/threshold, optional DI dominance.
Consolidation: Box+ATR (with min breaks & confirm), Squeeze (BB<KC), ER.
BO+FT: min points beyond prior H/L, close% near extreme, “no-pullback” option.
Z-Score: TR Z-score length & min threshold.
Volume: mild (SMA×mult) or strict (3-bar rising).
RSI divergence: pivot L/R, max lookback age.
HTF: timeframe/length, rule (Side only / Slope only / Strict).
Structure gate: pivot L/R, optional BOS with max age.
Sweep guard: Off / BlockAgainst / RequireWith.
Open Range: session window + “require breakout” toggle.
Blackout: one or two session windows (e.g., FOMC/CPI).
Smart Cooldown v2: base cooldown, EMA-stretch bonus, cluster penalty.
Alerts
Comes with alertconditions for Bull/Bear signals.
Optional JSON payload (direction, score, preset, regime, price, est. R, symbol, timeframe) for webhook-based managers (auto-filtering or auto-sizing).
How to set: Add alert on this indicator → choose condition “Bull MC3/Thrust” or “Bear MC3/Thrust” → Once-per-bar-close → webhook (optional).
Best practices
In trend: keep Auto regime ON; you can slightly lower min score / Z / BO.
In chop: raise min score (+1~2), use Volume strict + DI dominance, increase Z and close% thresholds, optionally require OR breakout.
Retest entries: enable “Retest mode” to get better fills (prev H/L or EMA band).
HTF Strict + Structure gate will materially improve selectivity (fewer trades, higher quality).
Avoid trading during Blackout windows (macro releases, roll).
Respect Smart Cooldown to prevent clustering and revenge trades.
Disclaimers
This is not financial advice. Backtest/forward-test before risking capital.
No indicator guarantees win rate or profits; use stops and position sizing.
Invite-Only access at the author’s discretion. Redistribution is prohibited.
Credits
Inspired by Al Brooks methodology (micro-channels, breakouts, trend vs chop context) and classic Wilder ADX/DI.
NQ Position Size CalculatorNQ Position Size Line Calculator is designed specifically for Nasdaq 100 futures (NQ) and micro futures (MNQ) traders who want to maintain disciplined risk management. This visual tool eliminates the guesswork from position sizing by displaying distance lines and contract calculations directly on your chart.
The indicator creates horizontal lines at 10-tick intervals from your stop loss level, showing you exactly how many contracts to trade at each distance to maintain your predetermined risk amount. Whether you're trading regular NQ contracts or micro MNQ contracts, this calculator ensures you never risk more than intended while providing instant visual feedback for optimal position sizing decisions.
How to Use the Indicator
Step 1: Configure Your Settings
Stop Loss Price: Enter your exact stop loss level (e.g., 20000.00)
Risk Amount ($): Set your maximum dollar risk per trade (e.g., $500)
Contract Type: Choose between:
NQ (Regular): $5 per tick - for larger accounts
MNQ (Micro): $0.50 per tick - for smaller accounts or conservative sizing
Display Options:
Max Lines: Number of distance lines to show (default: 30)
Show Labels: Toggle tick distance and contract count labels
Line Color: Customize the color of distance lines
Label Size: Choose tiny, small, or normal label sizes
Step 2: Read the Visual Display
Once configured, the indicator displays:
Stop Loss Line:
Thick yellow line marking your exact stop loss level
Yellow label showing the stop loss price
Distance Lines:
Dashed red lines at 10-tick intervals above and below your stop loss
Lines appear on both sides for long and short position planning
Labels (if enabled):
Green labels (right side): For long positions above your stop loss
Red labels (left side): For short positions below your stop loss
Format: "20T 5x" means 20 ticks distance, 5 contracts maximum
Step 3: Use the Information Tables
The indicator provides two helpful tables:
Position Size Table (top-right):
Shows common tick distances (10, 20, 40, 80, 160 ticks)
Displays risk per contract at each distance
Contract count for your specified risk amount
Total risk with rounded contract numbers
Settings Table (bottom-right):
Confirms your current risk amount
Shows selected contract type
Displays current settings for quick reference
Step 4: Apply to Your Trading
For Long Positions:
Look at the green labels on the right side of your chart
Find your desired entry level
Read the label to see: distance in ticks and maximum contracts
Example: "30T 8x" = 30 ticks from stop, buy 8 contracts maximum
For Short Positions:
Look at the red labels on the left side of your chart
Find your desired entry level
Read the label for tick distance and contract count
Example: "40T 6x" = 40 ticks from stop, sell 6 contracts maximum
Step 5: Trading Execution
Before Entering a Trade:
Identify your stop loss level and input it into the indicator
Choose your entry point by looking at the distance lines
Note the contract count from the corresponding label
Verify the risk amount matches your trading plan
Execute your trade with the calculated position size
Risk Management Features:
Contract rounding: All position sizes are rounded down (never up) to ensure you don't exceed your risk limit
Zero position filtering: Lines only show where position size is at least 1 contract
Dual-sided display: Plan both long and short opportunities simultaneously

MicroStrategy MetricsA script showing all the key MSTR metrics. I will update the script every time degen Saylor sells some more office furniture to buy BTC.
All based around valuing MSTR, aside from its BTC holdings. I.e. the true market cap = enterprise value - BTC holdings. Hence, you're left with the value of the software business + any premium/discount decided by investors.
From this we can derive:
- BTC Holdings % of enterprise value
- Correlation to BTC (in this case we use CME futures...may change this)
- Equivalent Share Price (true market cap divided by shares outstanding)
- P/E Ratio (equivalent share price divided by quarterly EPS estimates x 4)
- Price to FCF Ratio (true market cap divided by FCF (ttm))
- Price to Revenue (^ but with total revenue (ttm))

MicroStrategy Software Business Share PriceSimilar to the MicroStrategy Premium script. This indicator derives MSTR's core software business value by calculating its Bitcoin holdings as a percentage of market cap. Thus you can do, (1 - Bitcoin holdings as a % of market cap) * current share price = Core business share price

Micro Strategy PremiumSince the decision to buy 38,250 Bitcoin under their new treasury policy. Micro Strategy has become an easy and tax efficient way for many investors to gain an exposure to Bitcoin.
This script displays:
- Micro Strategy premium vs price of BTCUSD (CME)
- Micro Strategy premium vs price of BTCUSD (CME) minus Nasdaq 100 (QQQ ETF). A straightforward method to detach Micro Strategy’s share price from the overall performance of the US tech sector. This could potentially give you a more accurate premium.
- Micro Strategy’s 38,250 BTC as a percentage of their Market Cap
This script also acknowledges that Micro Strategy should be renamed “Macro Strategy” and that Michael Saylor is a living legend.