Modified Covariance Autoregressive Estimator of Price [Loxx]What is the Modified Covariance AR Estimator?
The Modified Covariance AR Estimator uses the modified covariance method to fit an autoregressive (AR) model to the input data. This method minimizes the forward and backward prediction errors in the least squares sense. The input is a frame of consecutive time samples, which is assumed to be the output of an AR system driven by white noise. The block computes the normalized estimate of the AR system parameters, A(z), independently for each successive input.
Characteristics of Modified Covariance AR Estimator
Minimizes the forward prediction error in the least squares sense
Minimizes the forward and backward prediction errors in the least squares sense
High resolution for short data records
Able to extract frequencies from data consisting of p or more pure sinusoids
Does not suffer spectral line-splitting
May produce unstable models
Peak locations slightly dependent on initial phase
Minor frequency bias for estimates of sinusoids in noise
Order must be less than or equal to 2/3 the input frame size
Purpose
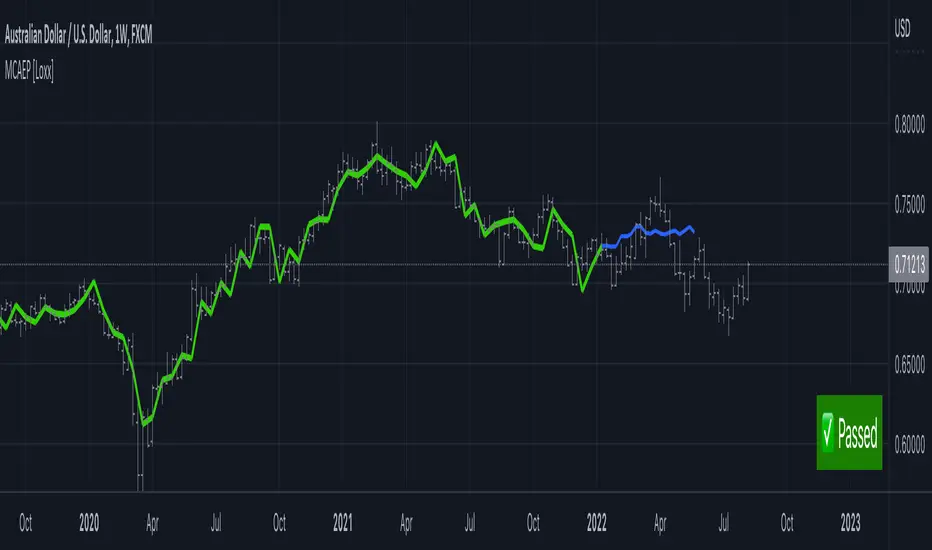
This indicator calculates a prediction of price. This will NOT work on all tickers. To see whether this works on a ticker for the settings you have chosen, you must check the label message on the lower right of the chart. The label will show either a pass or fail. If it passes, then it's green, if it fails, it's red. The reason for this is because the Modified Covariance method produce unstable models
H(z)= G / A(z) = G / (1+. a(2)z −1 +…+a(p+1)z)
You specify the order, "ip", of the all-pole model in the Estimation order parameter. To guarantee a valid output, you must set the Estimation order parameter to be less than or equal to two thirds the input vector length.
The output port labeled "a" outputs the normalized estimate of the AR model coefficients in descending powers of z.
The implementation of the Modified Covariance AR Estimator in this indicator is the fast algorithm for the solution of the modified covariance least squares normal equations.
Inputs
x - Array of complex data samples X(1) through X(N)
ip - Order of linear prediction model (integer)
Notable local variables
v - Real linear prediction variance at order IP
Outputs
a - Array of complex linear prediction coefficients
stop - value at time of exit, with error message
false - for normal exit (no numerical ill-conditioning)
true - if v is not a positive value
true - if delta and gamma do not lie in the range 0 to 1
true - if v is not a positive value
true - if delta and gamma do not lie in the range 0 to 1
errormessage - an error message based on "stop" parameter; this message will be displayed in the lower righthand corner of the chart. If you see a green "passed" then the analysis is valid, otherwise the test failed.
Indicator inputs
LastBar = bars backward from current bar to test estimate reliability
PastBars = how many bars are we going to analyze
LPOrder = Order of Linear Prediction, and for Modified Covariance AR method, this must be less than or equal to 2/3 the input frame size, so this number has a max value of 0.67
FutBars = how many bars you'd like to show in the future. This algorithm will either accept or reject your value input here and then project forward
Further reading
Spectrum Analysis-A Modern Perspective 1380 PROCEEDINGS OF THE IEEE, VOL. 69, NO. 11, NOVEMBER 1981
Related indicators
Levinson-Durbin Autocorrelation Extrapolation of Price
Weighted Burg AR Spectral Estimate Extrapolation of Price
Helme-Nikias Weighted Burg AR-SE Extra. of Price
Itakura-Saito Autoregressive Extrapolation of Price
Modified Covariance Autoregressive Estimator of Price