Fear Greed zones and Money Waves FusedThis indicator, named "Fear Greed zones and Money Waves" combines a smoothed Money Flow Index (MFI)-based wave and the Relative Strength Index (RSI) to visualize market sentiment through fear and greed zones and generate buy/sell signals.
Core Functions
- It calculates a zero-centered and smoothed version of the MFI (MoneyWave) using configurable smoothing methods (SMA, EMA, RMA) with parameters for length and smoothing intensity.
- It uses RSI to define fear and greed zones based on user-defined thresholds (e.g., RSI below 30 indicates fear, above 70 indicates greed).
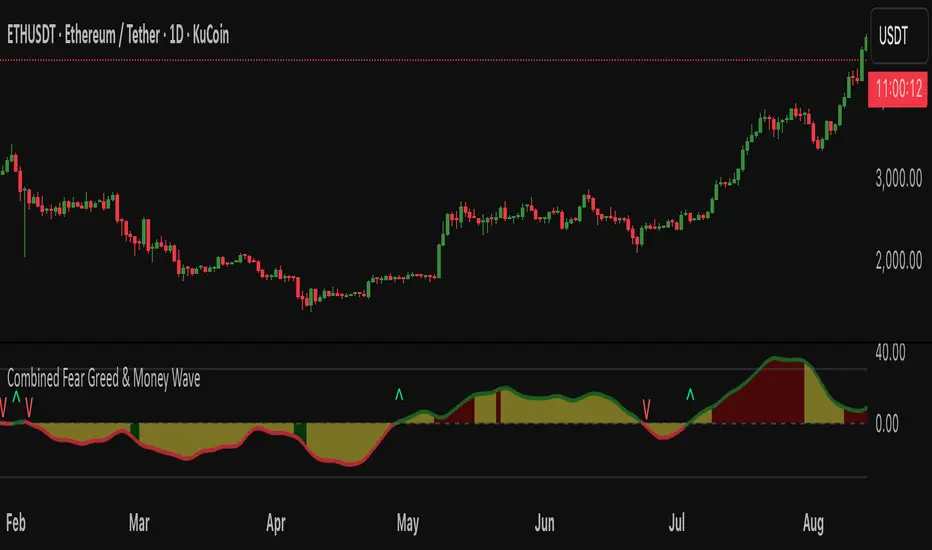
- The MoneyWave area is color-coded based on these fear/greed RSI zones: dark green for fear, dark red for greed, and yellow neutral.
- The edge line of the MoneyWave shows bullish (lime) when above zero and bearish (red) when below zero.
Visual Elements
- Plots the MoneyWave as a colored area with an edge line.
- Displays horizontal lines representing the zero line and upper/lower bounds derived from MFI thresholds.
- Optionally shows direction change arrows when the MoneyWave sign changes and labels indicating BUY or SELL signals based on MoneyWave crossing zero combined with fear/greed conditions.
Trading Signals and Alerts
- Buy signal triggers when MoneyWave crosses upward through zero while in the fear zone (RSI low).
- Sell signal triggers when MoneyWave crosses downward through zero while in the greed zone (RSI high).
- Alerts can be generated for these buy/sell events.
In summary, this indicator provides a combined measure of money flow momentum (MoneyWave) with market sentiment zones (fear and greed from RSI), helping identify potential market entry and exit points with visual markers and alerts .
Moneywave
Money Wave Script (Visual Adaptive MFI)This Script is a visual modification of the Money Flow Index (MFI)
//@version=5
indicator(title="Money Flow Index", shorttitle="MFI", format=format.price, precision=2, timeframe="", timeframe_gaps=true)
length = input.int(title="Length", defval=14, minval=1, maxval=2000)
src = hlc3
mf = ta.mfi(src, length)
plot(mf, "MF", color=#7E57C2)
overbought=hline(80, title="Overbought", color=#787B86)
hline(50, "Middle Band", color=color.new(#787B86, 50))
oversold=hline(20, title="Oversold", color=#787B86)
fill(overbought, oversold, color=color.rgb(126, 87, 194, 90), title="Background")
This Money Wave Script is culled from. the Money Flow Index with visual representation to help traders identify money flow. In addition, the waves can be smoothened. Here’s a detailed overview based on its functionality, color coding, usage, risk management, and a concluding summary.
Functionality
The Money Wave Script operates as an oscillator that measures the inflow and outflow of money into an asset over a specified period. It calculates the MFI by considering both price and volume, which allows it to assess buying and selling pressures more accurately than traditional indicators that rely solely on price data.
Color Coding
The indicator employs a color-coded scheme to enhance visual interpretation:
Green Area: Indicates bullish conditions when the normalized Money wave is above zero, suggesting buying pressure.
Red Area: Indicates bearish conditions when the normalized Money wave is below zero, suggesting selling pressure.
Background Colors: The background changes to green when the MoneyWave exceeds the upper threshold (overbought) and red when it falls below the lower threshold (oversold), providing immediate visual cues about market conditions.
Usage
Traders utilize the Money Wave indicator in various ways:
Identifying Overbought and Oversold Levels: By observing the MFI readings, traders can determine when an asset may be overbought or oversold, prompting potential entry or exit points.
Spotting Divergences: Traders look for divergences between price and the MFI to anticipate potential reversals. For example, if prices are making new highs but the MFI is not, it could indicate weakening momentum.
Trend Confirmation: The indicator can help confirm trends by showing whether buying or selling pressure is dominating.
Customizable Settings: Users can adjust parameters such as the MFI length , Smoothen index and overbought/oversold thresholds to tailor the indicator to their trading strategies.
Conclusion
The Money Wave indicator is a powerful tool for traders seeking to analyze market conditions based on the flow of money into and out of assets. Its combination of price and volume analysis, along with clear visual cues, makes it an effective choice for identifying overbought and oversold conditions, spotting divergences, and confirming trends.
