Manual Vertical Lines (ramlakshman das)This script is useful for traders who want to visually mark important past or upcoming events such as earnings announcements, market opens/closes, or economic dates directly on their price charts. Its manual input format offers maximal customization for each individual line without loops, making it straightforward to fine-tune each line’s parameters individually.
Key features include:
Manual control over up to multiple vertical lines.
Support for any date and time with precise timestamp inputs.
Customizable line colors.
Persistence of lines into the future.
Clear, user-friendly input naming for ease of use.
This indicator helps traders visually track crucial dates and prepare for events by highlighting them on their charts, improving decision-making and situational awareness during trading.
Moonphase
DHYT Moon Cycles IndicatorThis indicator tracks the moon cycles which seem to correlate with bullish and bearish periods for Cryptocurrency trading. This indicator allows you to calibrate these windows using recent moon phase dates and times. You can also add customizable highlighted bands before and after these events to highlight these bullish and bearish periods.
Created by: Dan Heilman

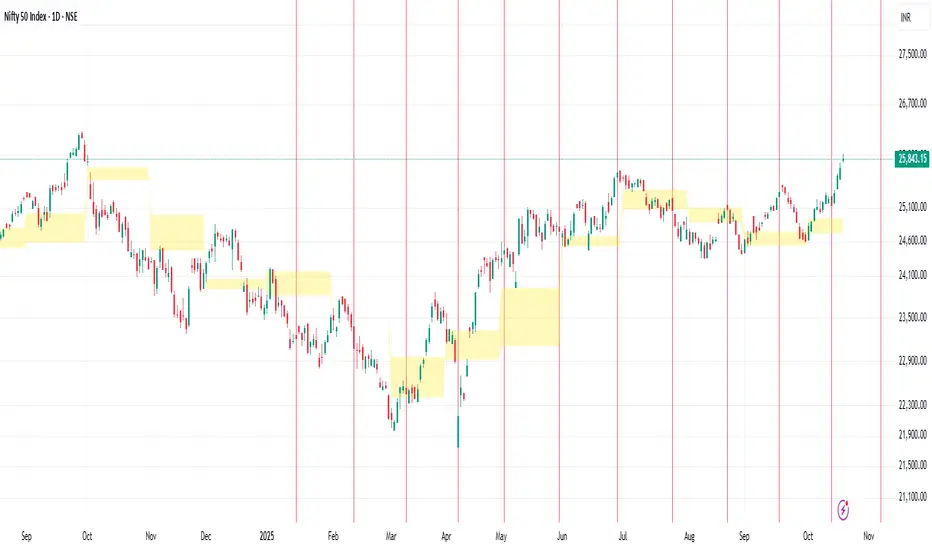
Next Moon Phases 2025Next Moon Phases 2025
This custom indicator marks both past and future moon phases with vertical lines on your chart, providing a unique way to incorporate lunar cycles into your trading strategy.
This indicator is best used on the Daily timeframe. The lunar cycle is most effective when viewed in daily bars, providing the clearest correlation between moon phases and market trends.
Key Features:
Past Moon Phases (2016–2024): Marks the key lunar phases—New Moon, First Quarter, Full Moon, and Last Quarter—with vertical lines on the chart. Perfect for backtesting and analyzing the historical relationship between moon phases and market movements.
Future Moon Phases (2025): Unlike most indicators, this tool also projects upcoming moon phases for 2025, allowing you to plan ahead and anticipate potential market reactions based on future lunar events.
Adjustable Visibility: Customize which moon phases are displayed by toggling the visibility of each phase (New Moon, First Quarter, Full Moon, Last Quarter) with a simple control.
Why Moon Phases Matter in Trading:
Many traders believe that the lunar cycle can influence market sentiment and behavior. For example:
New Moon is often associated with new beginnings and potential market reversals.
Full Moon is thought to bring increased volatility and market climaxes.
First Quarter and Last Quarter may indicate periods of consolidation or momentum shifts.
By including both past and future moon phases, this indicator allows you to examine historical data while also planning for upcoming lunar events, giving you a strategic edge for both short-term and long-term trading decisions.

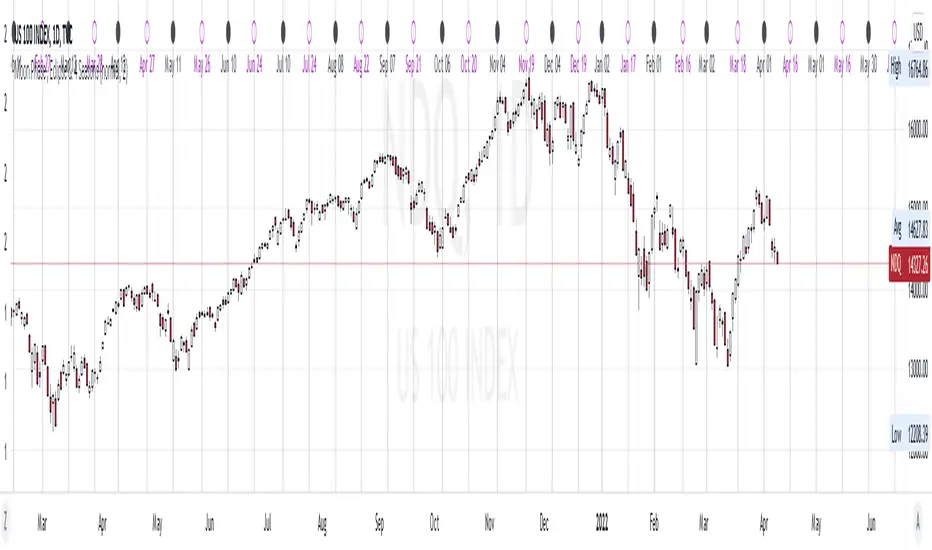
Moon Phase , Eclipse & 4 SeasonsHi Traders,
This script is a little bit different than the others Moon Phase scripts, added Moon Eclipse and 4 Seasons..
The objectives of this script:
1. you can see the Moon Phase schedule at certain periods (you can double check it in mooncalendar.astro-seek.com)
2. you can see the correlation between the Moon Phase and market reaction
3. you can see the correlation between the Moon Eclipse and market reaction
4. you can see the correlation between the 4 Seasons and market reaction
Those Dates are the Moon Phase (history & future), so when the Moon Phase arrived, we can forecast the turning or swinghigh/low in the market (cryptos, stocks, commoditties & indexes), the turning or swinghigh/low is +/- 1 day.
Those lines are just a simply vertical lines that can help us backtest easily, hopefully we can take profit from this Moon Phase..
New Moon & Full Moon
New Moon
Full Moon
Moon Eclipse
4 Seasons (Spring Equinox, Summer Solstice, Autumn Equinox, Winter Solstice)
Moon Phase This Script is calculating the Moon Phase IE full moon and new moon. In the past most of the time during these times the price action does a nice size move either up or down depending on the current trend that we are in. the New Moon and Full Moon are indicated by color and a moon printed on the chart.

[PX] Moon PhaseHello guys,
while scrolling through the public library, I was surprised that there was no Open-Source version of the Moon Phase indicator. All moon phase indicators in the public library were either protected or not exactly what I was looking for. There is a built-in "Moon Phase" indicator, but even for this one, we can't access its source code.
Therefore, I started searching for an algorithm that I could implement into PineScript.
So here we go, an Open-Source Moon Phase indicator. It comes with the option to color the background based on the recent moon. Compared to the built-in indicator, the moon is slightly shifted, because it is centered on the candle and not plotted between two candles like the built-in indicator is doing it.
Feel free to use the indicator for your analysis or build on top of it in an open-source fashion.
Happy trading,
paaax :)
Reference: This indicator is a converted and simplified version of the original javascript algorithm, which can be found here .
