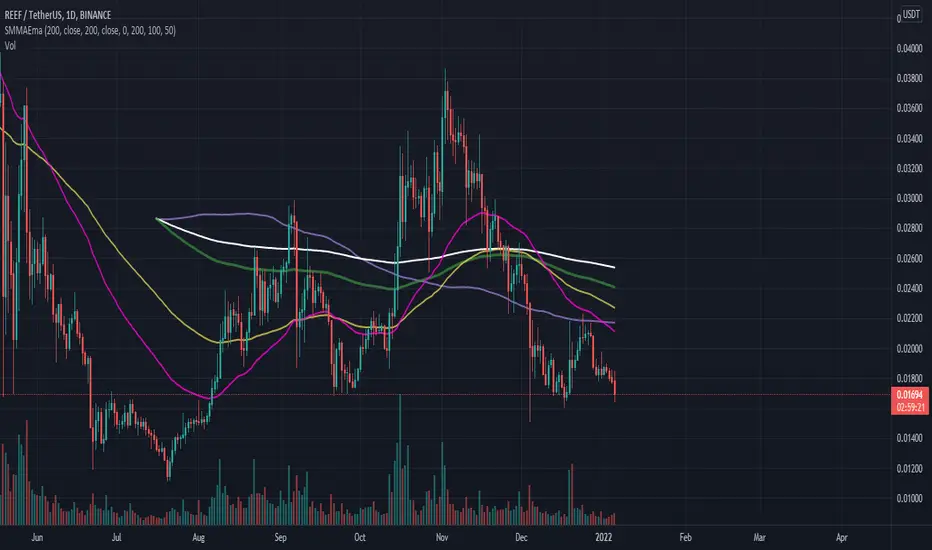
Smamaema1 SMA, 3 EMA, 1 MA. The SMA in white is an amazing support/resistence level on 4h charts with a long history, the three EMA are good indicators of buy/sell zones and and the MA is the same as EMA but with lag. Pine Script® indicatorby alintheter1112
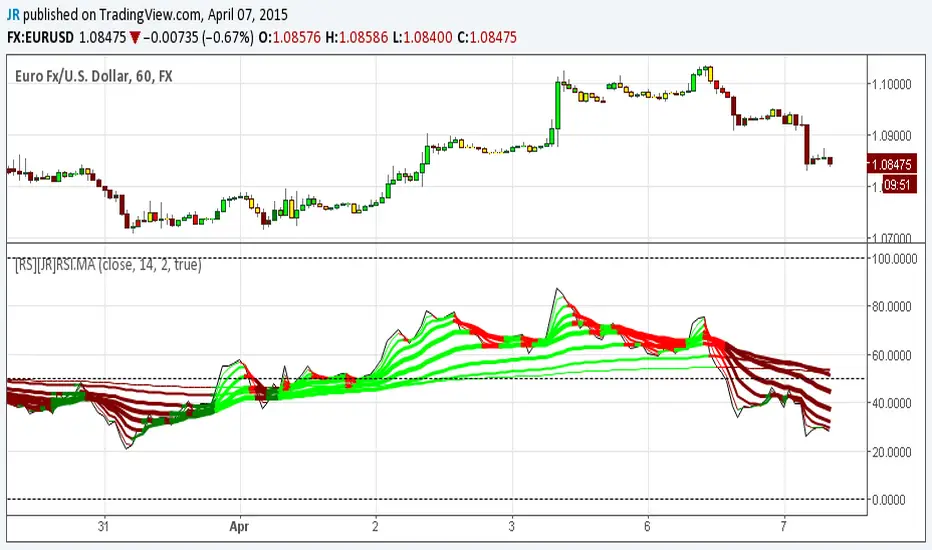
[RS][JR]RSI Ribbon + CandleRSI Ribbon + Candle By Ricardo Santos and JR In this chart rendering we are combining RSI and Moving Averages. For an added features we included colors to the candles and ribbons. Lime and green displays a strong bullish trend, yellow is caution or no trade, red and maroon are bearish trends. You can also find divergences using the ribbon. Divergence Pine Script® indicatorby QuantitativeExhaustion66740