Multi-Asset Cross Timeframe Divergence Ind. (MACDI) // AlgoFyreThe Multi-Asset Cross Timeframe Divergence Indicator (MACDI) identifies divergences in momentum like RSI across multiple assets and timeframes. It visually highlights lagging correlated asset momentum divergences, helping traders spot inefficiencies and potential trade opportunities in the following asset.
🔶 KEY FEATURES
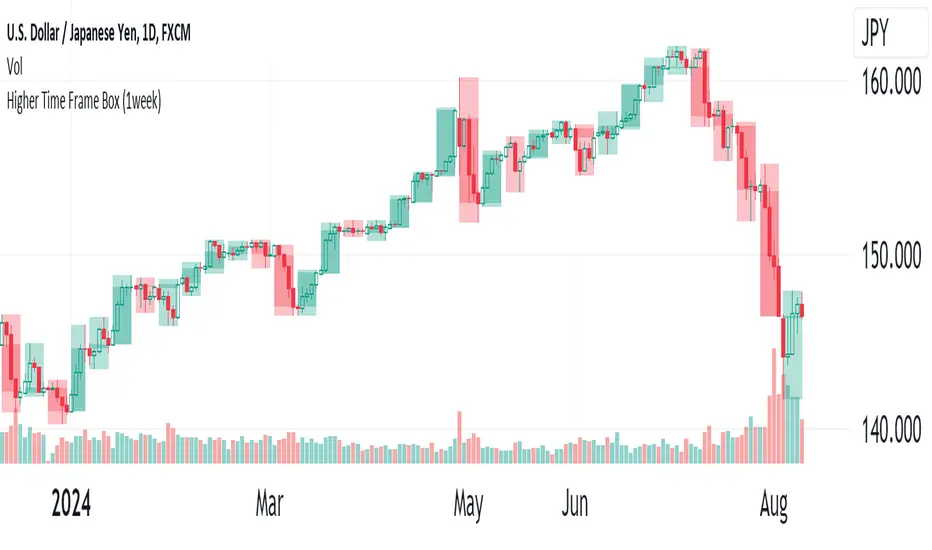
🔸Average Momentum Trendline for Each Timeframe
The Average Momentum Trendline feature calculates the average momentum of multiple assets over specified timeframes. It uses smoothed values to determine the momentum trend for each timeframe on the average aggregated momentum of both assets. This trendline helps traders identify the overall direction of the market momentum, providing a clearer picture of potential price movements.
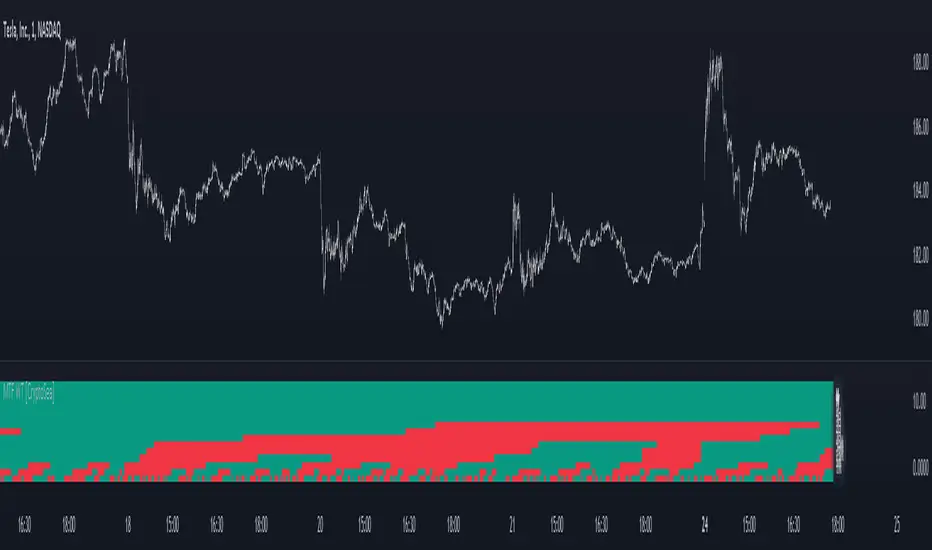
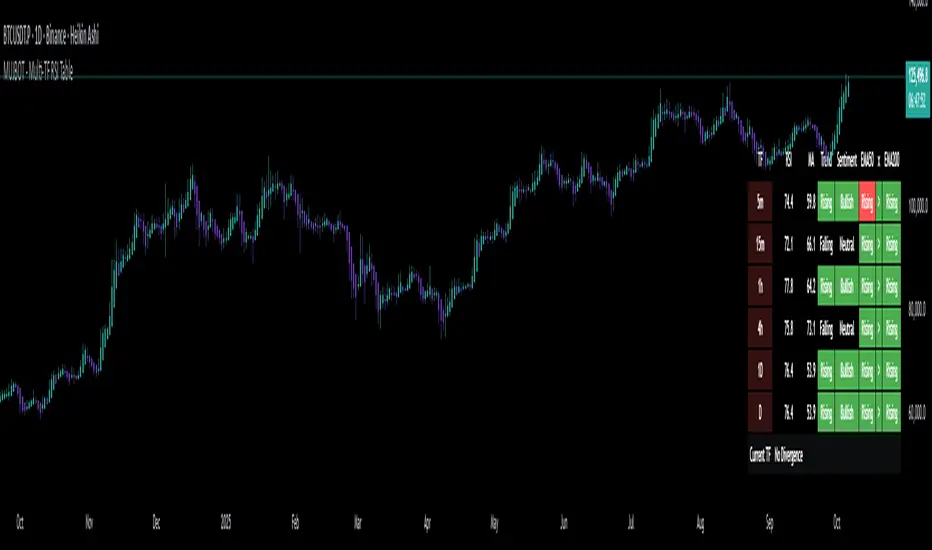
🔸Real-time Divergence Indication and Alert Table
The Real-time Divergence Indications and Alert Table feature visualizes detected divergences between the momentum values of the two assets across different timeframes. It identifies both bullish and bearish divergences, signaling lagging reversals in the the following asset and potential trading opportunities. When a divergence is detected, the system generates real-time visual indications on the chart and in an overview table for traders to act promptly. The alert table provides a comprehensive overview of all detected divergences, making it easier for traders to monitor and respond to market changes.
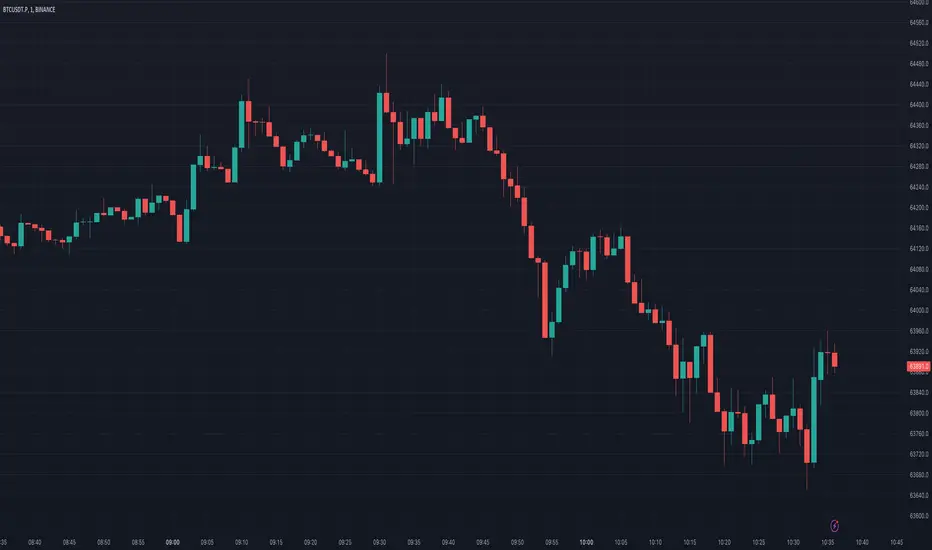
🔸Color and Size Based Labels on Price Chart based on Divergence Type
The Color and Size Based Labels feature visually represents divergences directly on the price chart. Bullish and bearish divergences are marked with distinct colors and sizes, making them easily identifiable at a glance. Larger labels indicate higher timeframes and thus generally more significance.
🔶 INSTRUCTION GUIDELINES
🔸Identify Divergence Clusters
The more divergences align, the higher the probability of a potential trend reversal in the asset. When multiple multi-timeframe divergences occur in both lower and higher timeframes within a local cluster, the probability of a reversal increases. This is valid for both for bullish and bearish divergences.
🔸Spot Low Probability Divergences
To further increase the probability, analyze the current state of the average momentum trendline. For a bullish reversal, a relatively low level of the average momentum trendline is preferred, whereas for a bearish reversal, a relatively high level is preferred.
🔶 INDIVIDUAL CONFIGURATION
🔸Leading Asset
This input allows the user to select the leading asset for the divergence analysis.
🔸Following Asset
This input allows the user to select the following asset for the divergence analysis.
🔸Higher Timeframe
This input sets the higher timeframe for the analysis.
🔸Lower Timeframe
This input sets the lower timeframe for the analysis.
🔸Show RSI Divergence
This input enables or disables the display of RSI divergence signals.
🔸RSI Length
This input sets the length of the RSI calculation.
🔸RSI Source
This input sets the source data for the RSI calculation (e.g., close price).
🔸RSI Smoothing Length
This input sets the length of the smoothing applied to the RSI values.
🔸Smoothing Method
This input sets the method used for smoothing the RSI values.
🔶 CONCLUSION
The Multi-Asset Cross Timeframe Divergence Indicator (MACDI) is a powerful tool for identifying momentum divergences across multiple assets and timeframes. Its visual cues and customizable table make it easy to use and interpret, providing valuable insights for trading decisions.
Pine Script® indicator