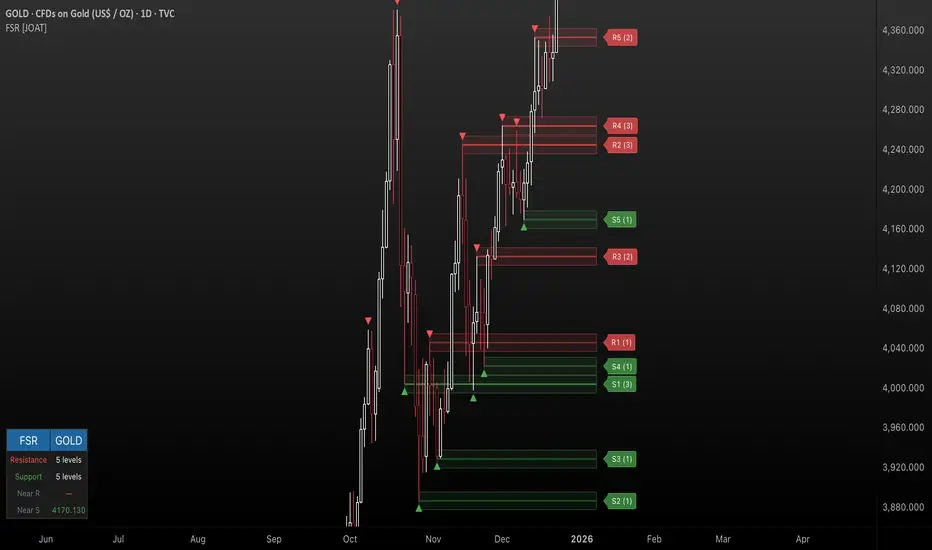
Pivot Point Zones [JOAT]Pivot Point Zones — Multi-Formula Pivot Levels with ATR Zones
Pivot Point Zones calculates and displays traditional pivot points with five formula options, enhanced with ATR-based zones around each level. This creates more practical trading zones that account for price noise around key levels—because price rarely reacts at exact mathematical levels.
What Makes This Indicator Unique
Unlike basic pivot point indicators, Pivot Point Zones:
Offers five different pivot calculation formulas in one indicator
Creates ATR-based zones around each level for realistic reaction areas
Pulls data from higher timeframes automatically
Displays clean labels with exact price values
Provides a comprehensive dashboard with all levels
What This Indicator Does
Calculates pivot points using Standard, Fibonacci, Camarilla, Woodie, and more formulas
Draws horizontal lines at Pivot, R1-R3, and S1-S3 levels
Creates ATR-based zones around each level for realistic price reaction areas
Displays labels with exact price values
Updates automatically based on higher timeframe closes
Provides fills between zone boundaries for visual clarity
Pivot Formulas Explained
// Standard Pivot - Classic (H+L+C)/3 calculation
pp := (pivotHigh + pivotLow + pivotClose) / 3
r1 := 2 * pp - pivotLow
s1 := 2 * pp - pivotHigh
r2 := pp + pivotRange
s2 := pp - pivotRange
// Fibonacci Pivot - Uses Fib ratios for level spacing
r1 := pp + 0.382 * pivotRange
r2 := pp + 0.618 * pivotRange
r3 := pp + 1.0 * pivotRange
// Camarilla Pivot - Tighter levels for intraday
r1 := pivotClose + pivotRange * 1.1 / 12
r2 := pivotClose + pivotRange * 1.1 / 6
r3 := pivotClose + pivotRange * 1.1 / 4
// Woodie Pivot - Weights current close more heavily
pp := (pivotHigh + pivotLow + 2 * close) / 4
// TD Pivot - Conditional based on open/close relationship
x = pivotClose < pivotOpen ? pivotHigh + 2*pivotLow + pivotClose :
pivotClose > pivotOpen ? 2*pivotHigh + pivotLow + pivotClose :
pivotHigh + pivotLow + 2*pivotClose
pp := x / 4
Formula Characteristics
Standard — Classic pivot calculation. Balanced levels, good for swing trading.
Fibonacci — Uses 0.382, 0.618, and 1.0 ratios. Popular with Fibonacci traders.
Camarilla — Tighter levels derived from range. Excellent for intraday mean-reversion.
Woodie — Weights current close more heavily. More responsive to recent price action.
TD — Conditional calculation based on open/close relationship. Adapts to bar type.
Zone System
Each pivot level includes an ATR-based zone that provides a more realistic area for potential price reactions:
// ATR-based zone width calculation
float atr = ta.atr(atrLength)
float zoneHalf = atr * zoneWidth / 2
// Zone boundaries around each level
zoneUpper = level + zoneHalf
zoneLower = level - zoneHalf
This accounts for market noise and helps avoid false breakout signals at exact level prices.
Visual Features
Pivot Lines — Horizontal lines at each calculated level
Zone Fills — Transparent fills between zone boundaries
Level Labels — Labels showing level name and exact price (e.g., "PP 45123.50")
Color Coding :
- Yellow: Pivot Point (PP)
- Red gradient: Resistance levels (R1, R2, R3) - darker = further from PP
- Green gradient: Support levels (S1, S2, S3) - darker = further from PP
Color Scheme
Pivot Color — Default: #FFEB3B (yellow) — Central pivot point
Resistance Color — Default: #FF5252 (red) — R1, R2, R3 levels
Support Color — Default: #4CAF50 (green) — S1, S2, S3 levels
Zone Transparency — 85-90% transparent fills around levels
Dashboard Information
The on-chart table (bottom-right corner) displays:
Selected pivot type (Standard, Fibonacci, etc.)
R3, R2, R1 resistance levels with exact prices
PP (Pivot Point) highlighted
S1, S2, S3 support levels with exact prices
Inputs Overview
Pivot Settings:
Pivot Type — Formula selection (Standard, Fibonacci, Camarilla, Woodie, TD)
Pivot Timeframe — Higher timeframe for OHLC data (default: D = Daily)
ATR Length — Period for zone width calculation (default: 14)
Zone Width — ATR multiplier for zone size (default: 0.5)
Level Display:
Show Pivot (P) — Toggle central pivot line
Show R1/S1 — Toggle first resistance/support levels
Show R2/S2 — Toggle second resistance/support levels
Show R3/S3 — Toggle third resistance/support levels
Show Zones — Toggle ATR-based zone fills
Show Labels — Toggle price labels at each level
Visual Settings:
Pivot/Resistance/Support Colors — Customizable color scheme
Line Width — Thickness of level lines (default: 2)
Extend Lines Right — Project lines forward on chart
Show Dashboard — Toggle the information table
How to Use It
For Intraday Trading:
Use Daily pivots on intraday charts (15m, 1H)
Pivot point often acts as the day's "fair value" reference
Camarilla levels work well for intraday mean-reversion
R1/S1 are the most commonly tested levels
For Swing Trading:
Use Weekly pivots on daily charts
Standard or Fibonacci formulas work well
R2/S2 and R3/S3 become more relevant
Zone boundaries provide realistic entry/exit areas
For Support/Resistance:
R levels above price act as resistance targets
S levels below price act as support targets
Zone boundaries are more realistic than exact lines
Multiple formula confluence adds significance
Alerts Available
DPZ Cross Above Pivot — Price crosses above central pivot
DPZ Cross Below Pivot — Price crosses below central pivot
DPZ Cross Above R1/R2 — Price breaks resistance levels
DPZ Cross Below S1/S2 — Price breaks support levels
Best Practices
Match pivot timeframe to your trading style (Daily for intraday, Weekly for swing)
Use zones instead of exact levels for more realistic expectations
Camarilla is best for mean-reversion; Standard/Fibonacci for breakouts
Combine with other indicators for confirmation
— Made with passion by officialjackofalltrades
Pine Script® indicator