Algorithmic Kalman Filter [CRYPTIK1]Price action is chaos. Markets are driven by high-frequency algorithms, emotional reactions, and raw speculation, creating a constant stream of noise that obscures the true underlying trend. A simple moving average is too slow, too primitive to navigate this environment effectively. It lags, it gets chopped up, and it fails when you need it most.
This script implements an Algorithmic Kalman Filter (AKF), a sophisticated signal processing algorithm adapted from aerospace and robotic guidance systems. Its purpose is singular: to strip away market noise and provide a hyper-adaptive, self-correcting estimate of an asset's true trajectory.
The Concept: An Adaptive Intelligence
Unlike a moving average that mindlessly averages past data, the Kalman Filter operates on a two-step principle: Predict and Update.
Predict: On each new bar, the filter makes a prediction of the true price based on its previous state.
Update: It then measures the error between its prediction and the actual closing price. It uses this error to intelligently correct its estimate, learning from its mistakes in real-time.
The result is a flawlessly smooth line that adapts to volatility. It remains stable during chop and reacts swiftly to new trends, giving you a crystal-clear view of the market's real intention.
How to Wield the Filter: The Core Settings
The power of the AKF lies in its two tuning parameters, which allow you to calibrate the filter's "brain" to any asset or timeframe.
Process Noise (Q) - Responsiveness: This controls how much you expect the true trend to change.
A higher Q value makes the filter more sensitive and responsive to recent price action. Use this for highly volatile assets or lower timeframes.
A lower Q value makes the filter smoother and more stable, trusting that the underlying trend is slow-moving. Use this for higher timeframes or ranging markets.
Measurement Noise (R) - Smoothness: This controls how much you trust the incoming price data.
A higher R value tells the filter that the price is extremely noisy and to be more skeptical. This results in a much smoother, slower-moving line.
A lower R value tells the filter to trust the price data more, resulting in a line that tracks price more closely.
The interaction between Q and R is what gives the filter its power. The default settings provide a solid baseline, but a true operator will fine-tune these to perfectly match the rhythm of their chosen market.
Tactical Application
The AKF is not just a line; it's a complete framework for viewing the market.
Trend Identification: The primary signal. The filter's color code provides an unambiguous definition of the trend. Teal for an uptrend, Pink for a downtrend. No more guesswork.
Dynamic Support & Resistance: The filter itself acts as a dynamic level. Watch for price to pull back and find support on a rising (Teal) filter in an uptrend, or to be rejected by a falling (Pink) filter in a downtrend.
A Higher-Order Filter: Use the AKF's trend state to filter signals from your primary strategy. For example, only take long signals when the AKF is Teal. This single rule can dramatically reduce noise and eliminate low-probability trades.
This is a professional-grade tool for traders who are serious about gaining a statistical edge. Ditch the lagging averages. Extract the signal from the noise.
Noisefree

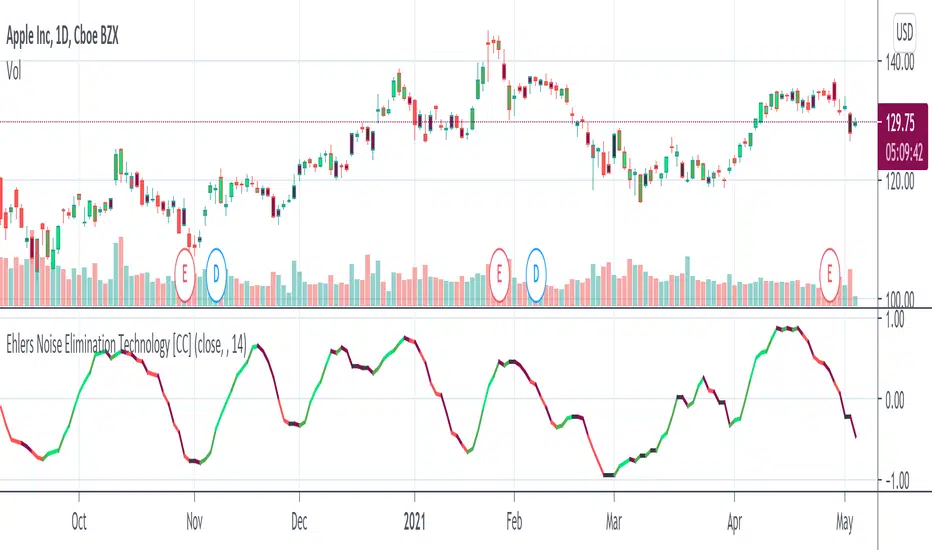
Ehlers Noise Elimination Technology [CC]The Noise Elimination Technology Indicator was created by John Ehlers (Stocks and Commodities Dec 2020 pg 17) and he created this indicator to be used with his version of RSI but I think it works well with any price data or any indicator really.
I'm trying a new signal system due to a request from @luckyCamel58789 so let me know what you think. I now differentiate between a buy and a strong buy when the indicator increases over itself twice and vice versa. Dark green is a strong buy and light green is a regular buy. Dark red is a strong sell and light red is a regular sell.
Let me know what indicators you would like to see me publish!
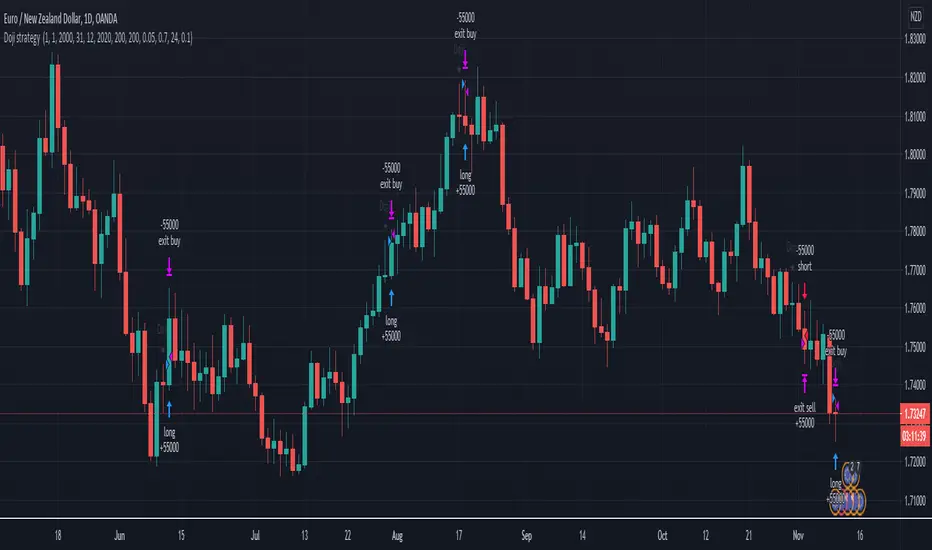
Doji swing strategyThis is a simple strategy based on Doji star candlestick
This strategy is suited for big time frames, like 4h -1Day and so on.
It places two orders: long at doji star high or previous candle high and short at doji star low or previous candle low.
It can also be applied volume average, in order to filter between trades .
This strategy works very well with high time frames like Weekly TF because it eliminates the noise in doji formation.
It also has inside a risk management made of SL/TP , or if not prefered it can exit based on a exit condition.
If you have any questions, please let me know !
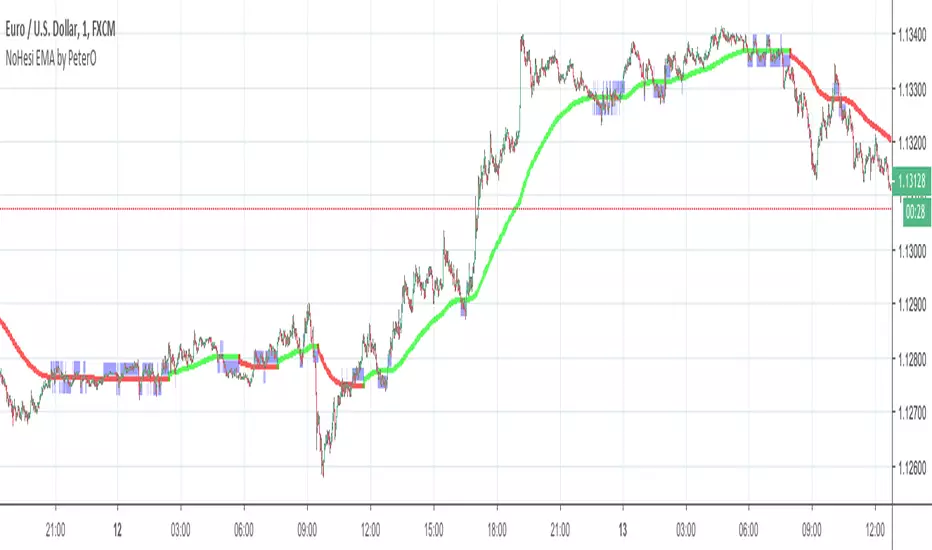
EMA NoHesi - cutting noise in EMA and any other data seriesNoise is common issue in variety of indicators. NoHesi is my take on reducing this noise.
Moving Averages are great indicators to show and maintain the trend. But sometimes - especially in pullback areas, smooth reversal zones or flat markets - MAs suggest trend changes, while it would be best for them to stay quiet :)
NoHesi function smoothens this noise, without adding unnecessary delay. NoHesi will make MA stay in the same direction as long as the move is not significant. If significant - MAs will report trend-change instantly.
Check the chart for illustration - NoHesi EMA keeps showing the same direction, despite its numerous attempts to change it (marked blue).
NoHesi can be applied to any data series: MAs, RSI , ADX , etc. EMA seemed like the most obvious example, so I used it for this presentation.
Hope it helps in your research!
P.S. When applying this to EMAs in other markets/timeframes, you will need to adjust "hesitation" parameter.
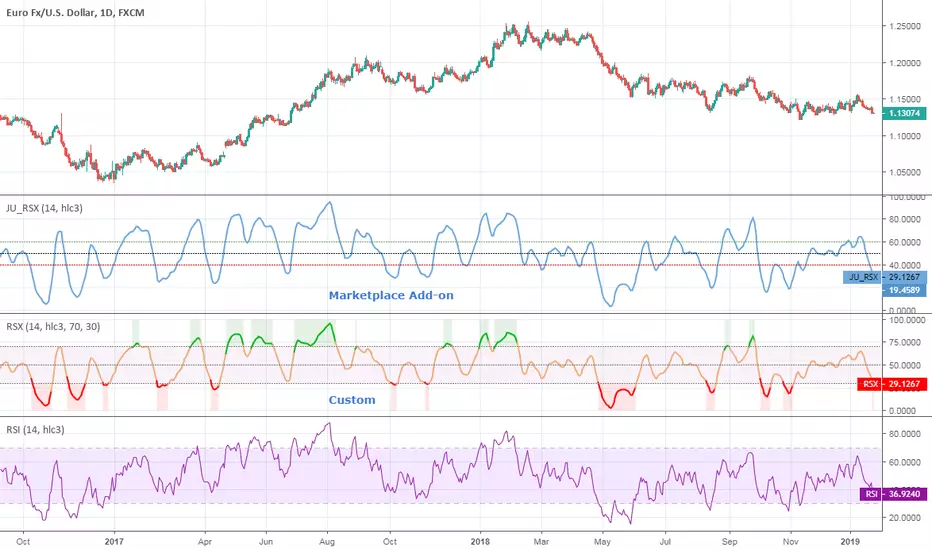
Jurik RSXAdopted to Pine from www.prorealcode.com .
I haven't yet understood the details of the algorithm but it matches the original Jurik's RSX one to one.
Jurik's RSX is a "noise free" version of RSI, with no added lag. To learn more about this indicator see www.jurikres.com .
Good luck!