Normalized Volatility IndicatorFrom an article by Rajesh Kayakkal:
"Early bear phase signals can help you get out of the market before it turns down. This indicator tells you how.
There are many ways to identify the trend of a financial market, the most common being the 200-day exponential moving average (Ema). When price is trending down below the 200-day Ema, the market is believed to be in a bear phase. If the market is trending up above the 200-day Ema, it is considered to be in a bull phase.
Since every indicator fails at times, I wanted to find other indicators to confirm a trend. In my quest for another indicator to determine the trend for the financial markets, I found the Cboe Volatility Index (Vix) to be a good indicator of the market direction. The Vix is calculated from the weighted average of the implied volatilities of various options on the Standard & Poor’s 500 index futures.
J. Welles Wilder’s average true range can also give an indication of the financial market trends; that is, when the market is in a bull phase, the average true range narrows, and when it is in a bear phase, the average true range expands. The normalized volatility indicator (Nvi) is based on this behavior.
Normalized volatility indicator (Nvi)
Average true range (Atr) varies depending on time. But how do we determine the phase of the financial market with Atr? Perhaps some type of ratio could give us a clue. A ratio presents a relationship of a quantity with respect to another. I did some research based on a ratio of the 64-day average true range and the end-of-day value of equity indexes such as the Standard & Poor’s 500 (Spx). I selected the 64-day period since it is close to the average number of trading days in a quarter. The ratio of the 64-day average true range and closing price does discount seasonal variations in the average true range and gives a single number that can be used to compare volatility of an instrument across many decades. I call this ratio the normalized volatility indicator.
I found an interesting correlation between Nvi and cycles of major equity market indexes. The formula for the Nvi is:
Nvi = 64 - Day average true range/End-of-day price * 100
The NVI gave advanced signals before the cyclical bear phase of SPX commenced in October 2000 and was almost on the spot with the bull phase that began in 2003 and the current secular bear market cycle, which started in November 2007."
Includes options to show inverse NVI and change the ATR length and smoothing.
Normalizedvolatility

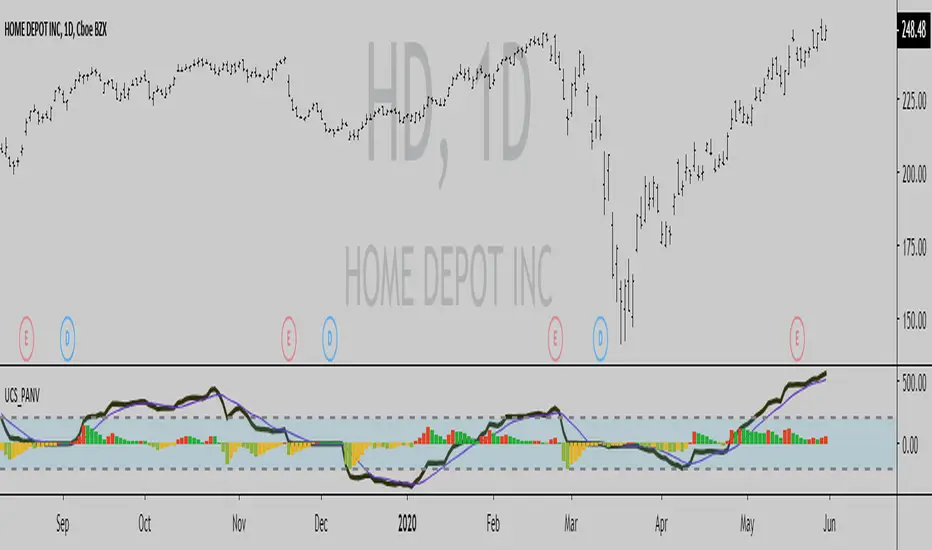
UCS_Price Action Normalized VolatilityFor Stock, Futures and Forex traders this may not be a replacement for MACD . But for an Option Trader, this would make sense 1000 times.
So, What is this?
This is the MACD for OPTIONS traders, remove the smoothness and adjust for volatility . Thats all it is.
Why is it important?
No one, ABSOLUTELY no one should be buying options in high volatility period for a long haul. So, this indicator takes that out of your guess work and only spits out price movement with relation to volatility .
You can use this exactly like a MACD for any options ( aka , volatility driven market).
Few things I have added, since I created and used it privately.
1. Chop Zone - Trade the Extremes of any Product
2. Buyers Zone - Shorts reconsider
3. Sellers Zone - Longs reconsider
Why did I create this?
Volatility dictates the market movement. That is an indepth conversation. If you are curious you can research on how shorts are squeezed, what are market makers obligations, how they maintain profitability. How NITE got burned, are some starting point for your own research.
So, if you are an options trader, I highly recommend to use this/test it and share your thoughts and how you use it.
- Good Luck Everyone.