Advanced MACD [CryptoSea]Advanced MACD (AMACD) enhances the traditional MACD indicator, integrating innovative features for traders aiming for deeper insights into market momentum and sentiment. It's crafted for those seeking to explore nuanced behaviors of the MACD histogram, thus offering a refined perspective on market dynamics.
Divergence moves can offer insight into continuation or potential reversals in structure, the example below is a clear continuation signal.
Key Features
Enhanced Histogram Analysis: Precisely tracks movements of the MACD histogram, identifying growth or decline periods, essential for understanding market momentum.
High/Low Markers: Marks the highest and lowest points of the histogram within a user-defined period, signaling potential shifts in the market.
Dynamic Averages Calculation: Computes average durations of histogram phases, providing a benchmark against historical performance.
Color-Coded Histogram: Dynamically adjusts the histogram's color intensity based on the current streak's duration relative to its average, offering a visual cue of momentum strength.
Customisable MACD Settings: Enables adjustments to MACD parameters, aligning with individual trading strategies.
Interactive Dashboard: Showcases an on-chart table with average durations for each phase, aiding swift decision-making.
Settings & Customisation
MACD Settings: Customise fast length, slow length, and signal smoothing to tailor the MACD calculations to your trading needs.
Reset Period: Determine the number of bars to identify the histogram's significant high and low points.
Histogram High/Lows: Option to display critical high and low levels of the histogram for easy referencing.
Candle Colours: Select between neutral or traditional candle colors to match your analytical preferences.
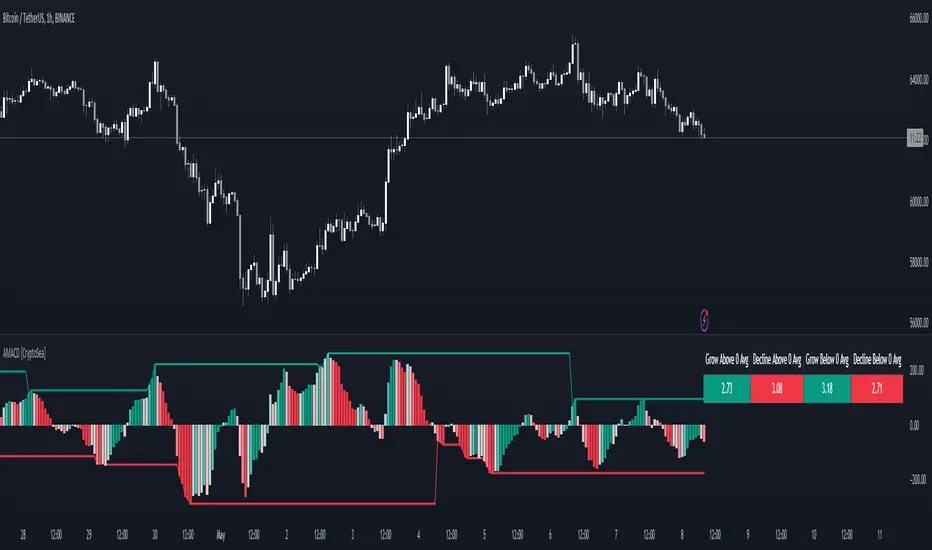
When in strong trends, you can use the average table to determine when to look to get into a position. This example we are in a strong downtrend, we then see the histogram growing above the average in these conditions which is where we should look to get into a shorting position.
Strategic Applications
The AMACD serves not just as an indicator but as a comprehensive analytical tool for spotting market trends, momentum shifts, and potential reversal points. It's particularly useful for traders to:
Spot Momentum Changes Utilise dynamic coloring and streak tracking to alert shifts in momentum, helping anticipate market movements.
Identify Market Extremes Use high and low markers to spot potential market turning points, aiding in risk management and decision-making.
Alert Conditions
Above Average Movement Alerts: Triggered when the duration of the MACD histogram's growth or decline is unusually long, these alerts signal sustained momentum:
Above Zero: Alerts for both growing and declining movements above zero, indicating either continued bullish trends or potential bearish reversals.
Below Zero: Alerts for growth and decline below zero, pointing to potential bullish reversals or confirmed bearish trends.
High/Low Break Alerts: Activated when the histogram reaches new highs or falls to new lows beyond the set thresholds, these alerts are crucial for identifying shifts in market dynamics:
Break Above Last High: Indicates a potential upward trend as the histogram surpasses recent highs.
Break Below Last Low: Warns of a possible downward trend as the histogram drops below recent lows.
These alert conditions enable traders to automate part of their market monitoring or potential to automate the signals to take action elsewhere.
Opensource
Entry FraggerEntry Fragger is a simple buy signal indicator.
It is most suitable for cryptocurrency, especially for altcoins on the 5 minute to daily timeframe and is based on simple volume calculations, in combination with EMA's.
Main Signal Logic explained:
A buy signal is generated by counting candles with an above average sell volume of 130% to 170%, taking into account the candles position below and above the 50 and 200 EMA.
If criteria meet, the first green candle above the 50 EMA's suggests upcoming higher prices.
The indicator has 2 input variables.
"Signal Confirmations (0 - 7):" Changes signal accuracy by a defining an ammount of high sell volume candles necessary below the 50 EMA.
"Volume Calculation Base (9 - 200):" Sets the exponential volume multiplier, this affects candle coloring and the volume calculation inside the candle.
"Style Settings": Turn ON/OFF Signals, Cloud, Bar Coloring, EMA's, etc...
There are no generally suitable default numbers for those 2 inputs, those have to be tested out, depending on cryptocurrency and timeframe.
The calculation is very basic, the underlying idea being, market maker initiating range breakouts through rapid increase of volume above or below the EMA's .
Example settings:
SOLUSDT: Signal Confirmations: 2, Volume Calculation Base 13.
SOLUSDT: Signal Confirmations: 0, Volume Calculation Base 20.
As you can see it affects signals quite a lot, but staying accurate.
Finetune the inputs to your preference.
Risk to Reward, Stoploss, Take Profit, position sizing, etc... is up to the user.
Recommended entry is to wait for following candle closes, entering half of the candle size and setting Stoploss outside the structure, like this:
Or right below the candles open, for safety.

MTF Order Block FinderAn Order Block is a special type of pivot point that satisfies the following requirement:
A Bull/Bear candle followed by X consecutive candles in the opposite direction.
Order Blocks are interesting areas that are frequently revisited and can be treated as Support/Resistance levels.
Often, you can see explosive price rejection of these areas via long wicks, high volume, and rapid price change.
Features
Choose from two themes:
- LIGHT: a classic Red and Green representing Bearish and Bullish OBs, respectively
- DARK: a clean Blue and White scheme
Choose from two drawing styles:
- LINE: three lines representing the High, Low, and Mid price levels of the OB candle
- BOX: a bounded area similar to the "rectangle" tool
Chose a custom timeframe:
- From 1 Minute (useful for Seconds interval) up to 1 Month
Note, this setting is experimental and choosing a timeframe that is extraordinarily large may not function properly.
Filter order blocks with two settings:
- Number of consecutive bars
- Minimum % change of the potential OB bar (default 0.25%)
Keep your charts clean and show only relevant OBs
- Maximum number of Bullish zones to show
- Maximum number of Bearish zones to show
FAQ
Q: How do I trade with this indicator?
A:Personally, I use a fast entry indicator to confirm Long/Short position when price is rejected. I set my SL and TP based on the current Zone and the next one, if available.
Q: Does this repaint?
A:Yes and this is okay! The "Bear" and "Bull" signals are not meant for taking positions, only showing which candle reveals the Order Block. The Zone is much more useful to us and can result in several successful trades in the near future when treated as a support/resistance area.
Q What's the winrate?
A:Hard to say - this isn't a standalone strategy and I haven't been able to properly backtest it quite yet.

Technical Analysis Consulting Table (TACT)Inspired by Tradingview's own "Technical Analysis Summary", I present to you a table with analogous logic.
You can track any ticker you want, no matter your chart. You can even have multiple tables to track multiple tickers. By default it tracks the Total Crypto Cap.
You can change the resolution you want to track. By default it is the same as the chart.
You can position the table to whichever corner of the chart you want. By default it draws in the bottom right corner.
Background colors and text size can be adjusted.
Indicators Used:
Oscillators
RSI(14)
STOCH(14, 3, 3)
CCI(20)
ADX(14)
AO
Momentum(10)
MACD(12, 26)
STOCH RSI(3, 3, 14, 14)
%R(14)
Bull Bear Power
UO(7,14,28)
Moving Averages
EMA(5)
SMA(5)
EMA(10)
SMA(10)
EMA(20)
SMA(20)
EMA(30)
SMA(30)
EMA(50)
SMA(50)
EMA(100)
SMA(100)
EMA(200)
SMA(200)
Ichimoku Cloud(9, 26, 52, 26)
VMWA(20)
HMA(9)
Pivots
Traditional
Fibonacci
Camarilla
Woodie
WARNING: I have observed up to a couple of seconds of signal jitter/delay, so use it with caution in very small resolutions (1s to 1m).
I hope you enjoy this and good luck with your trading. Suggestions and feedback are most welcome.
