Binary Options Gold Scalping [TradingFinder] 1 & 5 Min Strategy🔵 Introduction
In binary options trading, price movements are often driven by the market’s tendency to reach key liquidity zones. These areas include Liquidity, Fair Value Gaps (FVGs), and Order Blocks (OBs), zones where a large number of pending orders are concentrated.
When price reaches one of these zones, it typically enters a Liquidity Sweep phase to collect available liquidity. After this process, the market often reacts sharply, either reversing direction or continuing its move with renewed momentum. Understanding this cycle forms the foundation of most smart money-based binary options strategies.
In this analytical approach, a Liquidity Sweep is usually seen as a False Breakout, often recognized through a distinctive candle confirmation pattern. The pattern appears when price briefly breaks a level to trigger stops, then quickly returns within range. This formation is one of the most reliable reversal signals for short-term trades and plays a central role in many binary options strategies.
After a liquidity sweep, price often returns to Fair Value Gap (FVG) or Order Block (OB) areas to restore balance in the market. These are zones where institutional orders are typically placed, and reactions around them can create high-probability trade setups. In binary options trading, this quick reaction following a sweep and retrace into an FVG or OB provides one of the best entry opportunities for short-term trades.
By combining the concepts of Liquidity Sweep, Fair Value Gap, and Order Block, traders can build a precise binary options strategy based on smart money behavior, allowing them to identify market reversals with greater confidence and enter at the optimal moment.
Bullish Setup :
Bearish Setup :
🔵 How to Use
This indicator is built on the Smart Money Concept (SMC) framework and serves as a core tool for accurately detecting Liquidity Sweeps, Order Blocks, and Fair Value Gaps in binary options trading.
Its logic is simple yet powerful : when price reaches high-interest liquidity zones and shows reversal signs, the indicator issues an entry signal immediately after a Candle Confirmation is complete.
Signals only activate when both the market structure and the candle confirmation pattern align, ensuring high accuracy in spotting genuine reversals.
🟣 Long Position
A bullish signal appears when the market, after a downward move, reaches sell-side liquidity zones where liquidity has built up below previous lows. In such conditions, a bullish Order Block or Fair Value Gap often exists in the same region, acting as a potential reversal point.
When the indicator detects the presence of liquidity, an imbalance zone (FVG), and a valid candle confirmation simultaneously, it triggers a green Call signal.
In a binary options strategy, the best entry moment is immediately after the candle confirmation closes, as this is when the probability of reversal is highest and the market tends to react strongly within the next few candles.
In the example below, after the liquidity sweep and candle confirmation, price quickly rallied, resulting in a Binary Win setup.
🟣 Short Position
A bearish signal occurs when price, after an upward move, reaches an area of buy-side liquidity and collects liquidity above recent highs. At this stage, the market is typically overbought and ready to reverse. If a bearish Order Block or Fair Value Gap exists in the same area and a candle confirmation pattern forms, the indicator displays a red Put signal.
This setup is highly accurate because multiple structural confirmations occur simultaneously : liquidity has been absorbed, price is rebalancing, and the confirmation candle has closed.
In binary options trading, this is the ideal moment to enter a Put (Sell) position, as the price reaction to the downside is usually quick and decisive.
In the example chart, the indicator generated a bearish signal right after the candle confirmation and completion of the liquidity sweep, price then dropped within minutes, resulting in another Binary Win.
🔵 Settings
Time Frame : Select the desired timeframe for analysis. If left blank, the indicator uses the chart’s current timeframe.
Swing Period : Defines how many candles are used to detect structural pivots (swing highs and lows). A higher value increases accuracy but reduces the number of signals.
Candle Pattern : Enables candle-based confirmation logic. When turned on, the indicator issues signals only if a valid reversal pattern is detected. You can also choose the confirmation filter strength, tighter filters show fewer but more precise signals.
🔵 Conclusion
A deep understanding of Liquidity Sweeps, Order Blocks, and Fair Value Gaps can make a decisive difference between ordinary and professional traders in the binary options market.
This indicator, combining smart money logic with candle confirmation, is one of the most precise tools for detecting true market reversals. When liquidity is collected and structural reversal signs emerge, the indicator automatically recognizes the price reaction and generates a reliable Call or Put signal.
Using this tool alongside market structure analysis and FVG detection allows traders to enter high-probability setups while filtering out false breakouts. For that reason, this binary options strategy is not only suitable for short-term trading but also valuable for understanding deeper smart-money behavior across timeframes.
Ultimately, success with this system comes down to two key principles: understanding the logic of the liquidity sweep and waiting for the candle confirmation to close. When these two conditions align, the indicator can pinpoint the best entry points with remarkable precision, helping you build a structured, intelligent, and profitable binary options strategy.
Options

korea time with 200 korea time
start time
08
09
17
18
23
00
This script makes it easier to look at the charts
The time automatically displays even if you don't bother to bring the mouse by hand
Now you can see the time intuitively
Run a very happy trading session

3s CISD 9 EMA- [CT]Private Algorithm that is invite only. It is only spread through word of mouth and is not available on any website.
This algorithm will give you the best chance at being green and is even better when following specific plays of someone or yourself.
This is not supposed to guarantee profit and the team are not financial advisors. Please always manage your own risk according to your risk tolerance .
Overview
The 3s CISD 9 EMA – indicator is a versatile market structure and sentiment tool that combines CISD (Change in Structural Direction) levels, EMA-based trend bias, and candlestick pattern detection to identify key turning points and continuation setups in price action.
It’s designed for traders seeking precision entries during structural shifts or reversals across any symbol or timeframe.
Key Features
🟡 9 EMA Trend Bias
Plots a 9-period Exponential Moving Average (EMA) to define short-term trend direction.
Optional bar coloring (green for bullish, red for bearish) helps visualize momentum shifts.
📊 CISD (Change in Structural Direction) Levels
Detects bullish and bearish pullbacks and confirms CISD breaks when price structure shifts direction.
Auto-draws labeled horizontal lines (+CISD / -CISD) at critical breakout points.
Supports line style customization (Solid, Dotted, Dashed), width, and extension for clarity.
Option to keep or clear old CISD levels.
Includes alert conditions when a new CISD formation is confirmed.
Real-time state table shows current structure bias: Bullish or Bearish.
📈 Candlestick Signal Suite
1. 3-Line Strike Pattern
Detects both bullish and bearish 3-line strike formations.
Useful for identifying exhaustion moves or reversals after a trend leg.
Configurable on/off toggles for each direction.
2. Engulfing (Big A$$ Candles)
Highlights large engulfing candles that dominate the previous bar.
Distinguishes bullish engulfing (orange triangle up) and bearish engulfing (blue triangle down).
Integrated alert conditions for automated notifications.
Customization Options
Toggle visibility for EMA, bar colors, CISD lines, labels, and pattern signals.
Adjustable line width, style, and extension length for CISD visuals.
Selectable table position (Top Right, Bottom Center, etc.).
Separate alert controls for bullish and bearish CISD events.
Alerts
“Bullish CISD Formed” → Indicates potential upward structural shift.
“Bearish CISD Formed” → Indicates potential downward structural shift.
Engulfing pattern alerts → Triggered when large reversal candles appear.
How to Use
Enable EMA and bar color for quick trend visualization.
Watch for CISD line breaks to anticipate structural changes.
Confirm entries with 3-Line Strike or Engulfing candle signals.
Use the State Table to track current directional bias.
Optional: Set alerts for CISD events to stay informed automatically.
Best Used For
Structure-based trading (ICT, Wyckoff, or price-action styles).
Identifying short-term reversals or continuation setups.
Multi-timeframe confluence analysis.
Momentum confirmation with 9 EMA and pattern alignment.
Disclaimer:
This script is for educational and analytical purposes only. Past performance does not guarantee future results. Always perform independent analysis before making trading decisions.

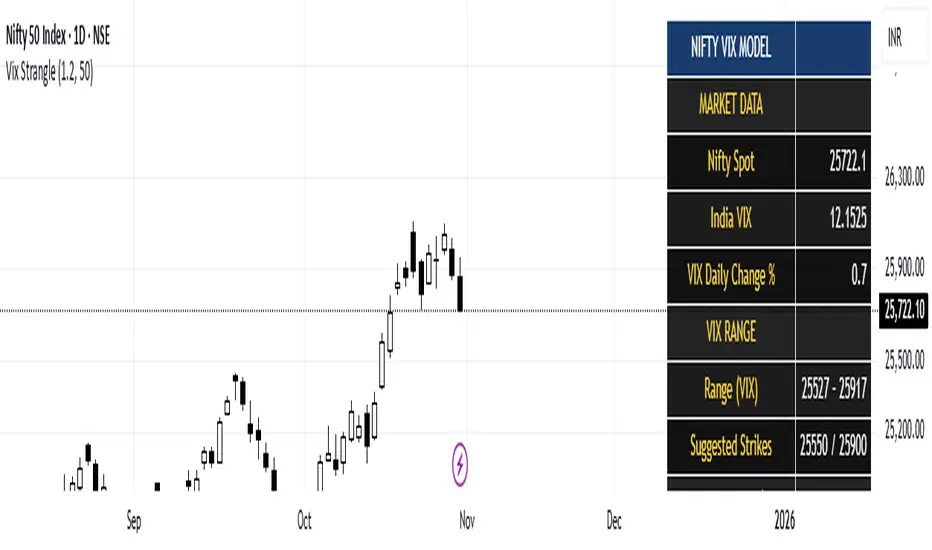
India Vix based Strangle StrikesA clean Nifty–VIX dashboard that converts India VIX into expected daily moves, price ranges, and suggested strangle strikes. Includes VIX %, expanded 1.2× range, and smart rounded strike levels for options trading.
This script provides a professional on-chart dashboard that converts India VIX into actionable trading levels for Nifty. It calculates the VIX-based expected daily move, projected price ranges, expanded 1.2× ranges, and suggested strangle strike prices. Includes clean formatting, color-coded sections, and real-time updates.
Ideal for traders using straddles, strangles, intraday volatility models, range-bound setups, and options-based risk management.
1.2x expanded range is better success probability, may keep 20% of strangle value as stop loss.
The vix based system is intended to give approx. 70%+ success rate.
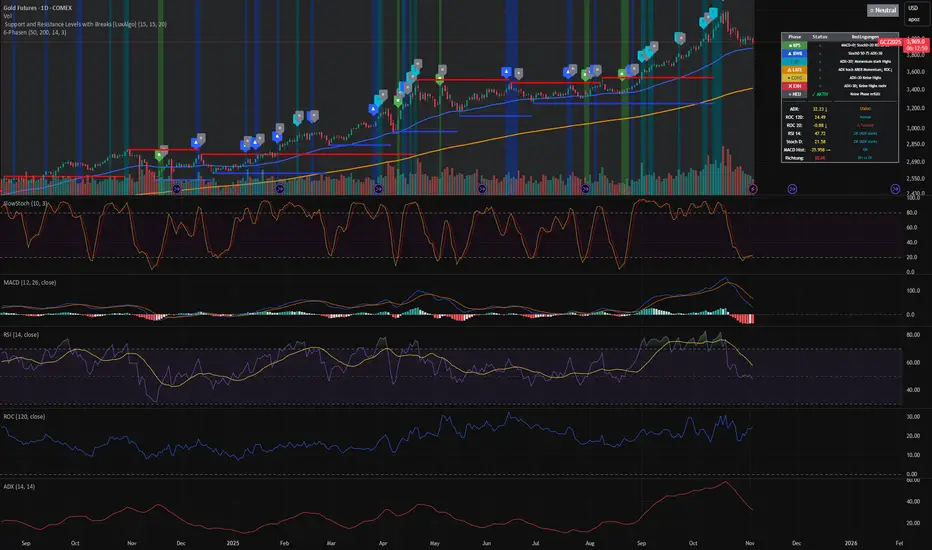
3-Phasen-Scanner (BPS / BWB / Neutral) – exakt wie TV-EMA3-Phasen-Scanner (BPS / BWB / Neutral) – exakt wie TV-EMA
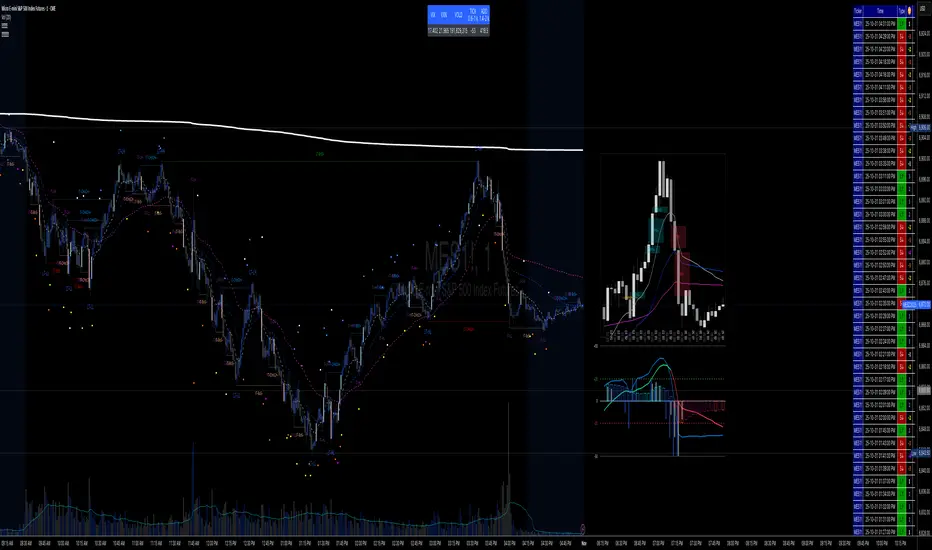
✝️📈📉☢️BANG is a comprehensive multi-timeframe indicator for TradingView, designed for intraday trading of futures and stocks.
To use: Add to a low timeframe chart (e.g., 1-5 minutes), configure anchor mode (daily/weekly/monthly/manual) for session resets, and select timeframe for signals (e.g., 5m). Monitor the mini-charts for HTF overview (candles, VWEMA/VWAP, FVG), RSI/MACD trends, market data table (VIX/VXN/etc.), and ICT structure (pivots, BOS/CHoCH).
For trading: Enter LONG/SHORT on signal bars with strength ☢️ (1-6, higher = stronger confluence), confirmed by multi-timeframe alignment (e.g., anchor daily while trading minutes). Use ATR-based risk management; backtest in demo mode.
US Standard Quarterly Option Expirations accounting US HolidaysUS Standard Quarterly Option Expirations accounting US Holidays

NWOG/NDOG - HOKO (Public Version)This indicator shows you the intervals between the start of the week and the new day, and it is useful for everyone and everyone can use it.

Session Vertical Lines – WIB (Consistent)Session Line by farisradifana
Give the Session on Indonesian Time :
Asian Session : 6 A.M
London Session : 2 P.M
New York Session : 7 P.M

GB · Set upUp & Confirmation (Lower Pane)The GB Set-Up & Confirmation Indicator transforms raw momentum into a clear, color-coded decision framework for intraday scalping.
It’s the heartbeat monitor of 0DTE trading — revealing when momentum quietly shifts and when it explodes into confirmation.
Milliseconds Ahead: Confirm-on-Prior mode mimics predictive confirmation, letting traders catch reversals before the lag candle.
Noise-Adaptive: Near-zero band filtering reduces false breaks from micro volatility.
Visual Precision: Dual markers and labeled confirmations remove hesitation in execution.
Configurable Latency: Sensitivity presets + fine-tune ensure adaptability from SPX 1-min charts to QQQ 5-min momentum waves.
Platform: Designed for lower-pane deployment beneath the main price chart.
Primary Use: Time-sensitive momentum confirmation for 0DTE SPX/SPY/QQQ scalps.
Typical Workflow:
Wait for Early (Set-Up) triangle near the zero band → signals momentum shift.
Enter on the Confirmed triangle (or one candle prior if using “Confirm on Prior”).
Exit when opposite signal fires or wave color fades (momentum exhaustion).
Complementary Indicators: Pairs seamlessly with GB TMA Overlay, GB ORB Shading, or Phoenix Fire Confluence for full-stack entry validation.
Adaptive Sensitivity Presets
- Aggressive: reacts early to momentum pulses (scalp mode).
- Balanced: optimized for intraday consistency.
- Strict: waits for full trend maturity (swing mode).

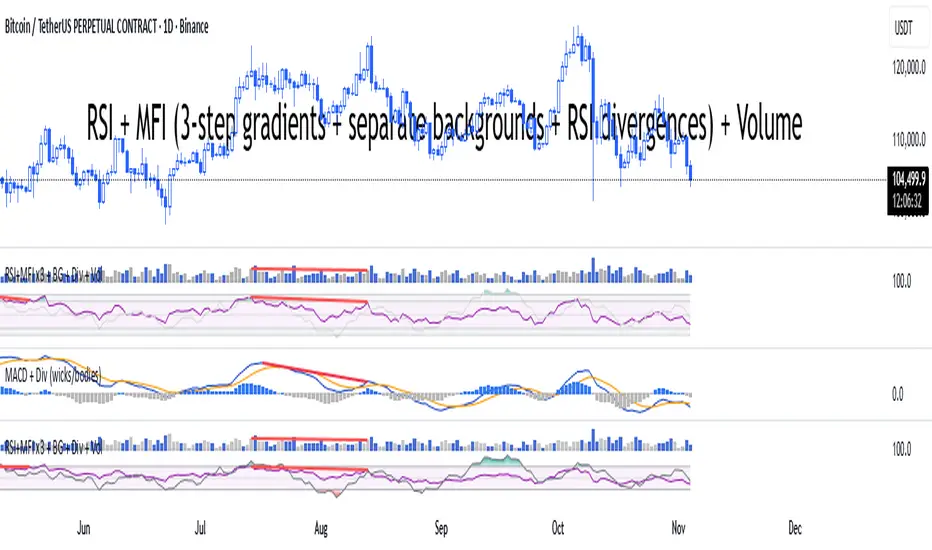
RSI + MFI + VolumeIndicator shows RSI + MFI + Volume in one panel, marks divergences separate for wicks and bodies, green dots shows where MFI and RSI are oversold
Price Above PDH - Complete Multi-Confirmation Alert
Cashapp $jmoskyhigh
Initial Breakout: Must have ALL confirmations to even start counting
During Hold Period: If ANY confirmation fails at ANY bar, the counter RESETS to zero
Must Re-qualify: If confirmations fail, must cross PDH again with all confirmations to restart
Alert Only Fires: When ALL confirmations are continuously met for the ENTIRE hold period
3. Visual Feedback:
Green background: Above PDH + ALL confirmations present
Red background: Above PDH but MISSING one or more confirmations
Red X above bar: Shows when a confirmation is lost during breakout (counter resets)
Green triangle with "✓ ALL": Alert triggered after full confirmation period
4. Example Scenario:
Scenario 1 - SUCCESS:
Bar 1: Price crosses PDH, Volume spike, MA bullish, Above VWAP → Counter = 1
Bar 2: Still above PDH, ALL confirmations still met → Counter = 2
Bar 3: Still above PDH, ALL confirmations still met → Counter = 3
Bar 4: Still above PDH, ALL confirmations still met → Counter = 4
Bar 5: Still above PDH, ALL confirmations still met → Counter = 5 → ALERT!
Scenario 2 - FAILURE (resets):
Bar 1: Price crosses PDH, Volume spike, MA bullish, Above VWAP → Counter = 1
Bar 2: Still above PDH, ALL confirmations still met → Counter = 2
Bar 3: Still above PDH, but volume drops below threshold → RESET Counter = 0
Bar 4: Still above PDH, ALL confirmations back → Counter = 1 (starts over)
5. Info Panel:
Shows which specific confirmations are failing
"OFF" displayed for disabled confirmations
Big "ALL CONFIRMED" row shows overall status
Warning message if confirmations are lost during breakout
This ensures you only get alerts when the setup is truly strong with ALL confirmations maintained throughout the entire hold period! 🎯

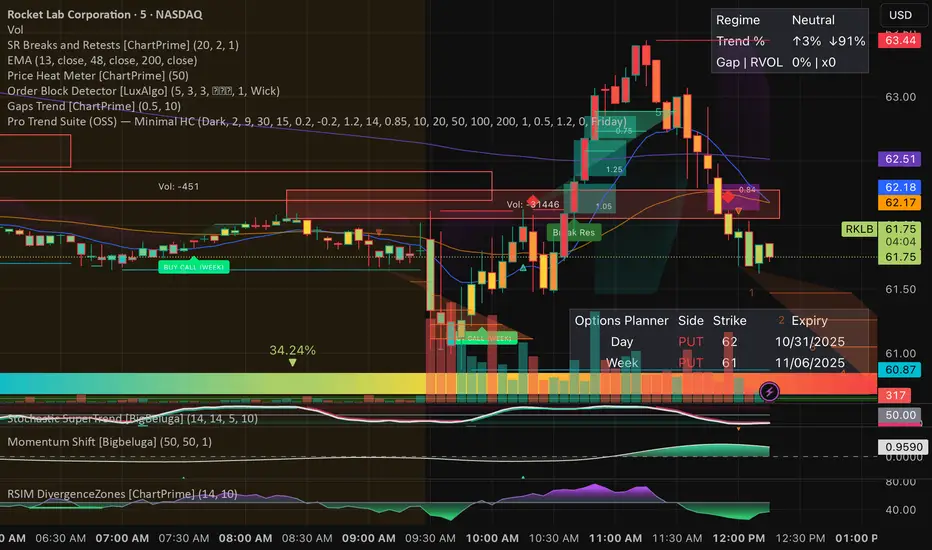
Pro Trend Suite + Options (Minimal Auto, Hi-Confidence)Help pick the best options play and helps know what the trend is.
MACD (classic) + Divergences (wicks & bodies, fast/slow)macd with divergences. Wicks + bodies. Two settings for right bar

Multi-Timeframe SMA + AlertsThis indicator displays the Simple Moving Average (SMA) across multiple timeframes simultaneously on your chart. It helps traders quickly visualize trend direction across different intervals without switching charts.
Features:
Multi-Timeframe SMA: Shows SMA for multiple timeframes (1m, 3m, 5m, 15m, 30m by default; visibility customizable).
Customizable SMA Length: Choose any SMA length to suit your trading strategy.
Colored SMAs: Each timeframe is represented with a distinct color for easy differentiation.
Price vs SMA Table: Displays SMA values and whether the current price is Above, Below, or At the SMA for each timeframe.
Chart Labels: Marks the last SMA values on the chart for quick reference.
Alerts: Set alerts when price crosses above or below any timeframe’s SMA, with clear messages indicating the timeframe and price.
Customizable Inputs: Select which SMAs to display and define the SMA length.
Use Cases:
Identify short-term vs. longer-term trend alignment.
Spot potential entry or exit points when price crosses the SMA on multiple timeframes.
Keep track of SMA relationships without constantly switching timeframes.
How to Use:
Add the indicator to any chart.
Choose which timeframes’ SMAs to display.
Set the SMA length according to your strategy.
Optionally, set alerts for crossovers or crossunders.
Use the table and labels to monitor SMA levels at a glance.
Tips:
Combine with other indicators for confirmation of trend direction.
Use alerts to avoid constantly watching the chart.

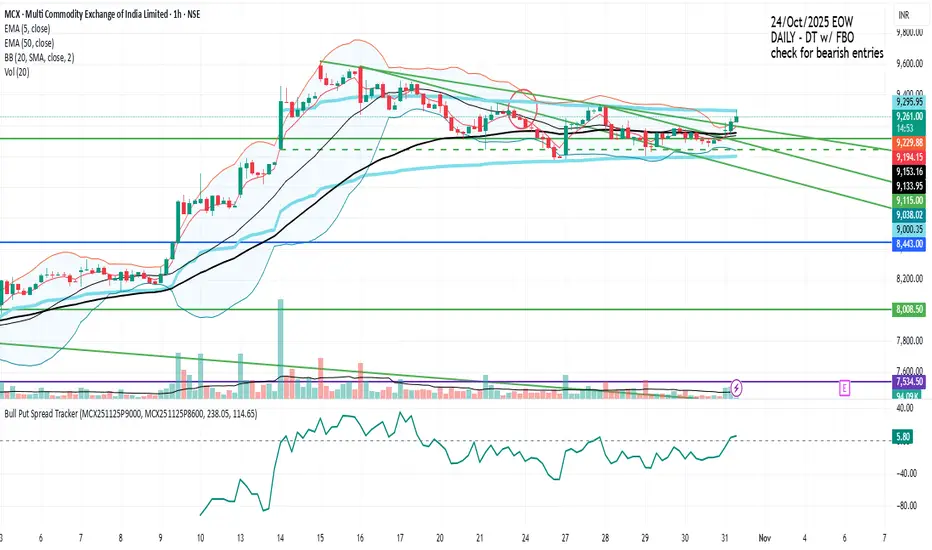
Bull Put Spread TrackerScript that will add an indicator (like MACD/RSI) to the chart.
Manually need to enter: Symbol names for the spread legs & the entry prices
PDH/PDL- [CT]Private Algorithm that is invite only. It is only spread through word of mouth and is not available on any website.
This algorithm will give you the best chance at being green and is even better when following specific plays of someone or yourself.
This is not supposed to guarantee profit and the team are not financial advisors. Please always manage your own risk according to your risk tolerance .
PDH/PDL –
by calmstrades
Description:
The PDH/PDL – indicator automatically plots the Previous Day’s High (PDH) and Previous Day’s Low (PDL) levels directly on your chart — essential reference points for Smart Money Concepts (SMC) and intraday traders.
It also detects and highlights liquidity sweeps when price takes out the prior day’s highs or lows, helping identify potential reversal or continuation zones.
🔍 Features:
Automatic PDH/PDL Levels:
Draws dynamic lines for the previous day’s high and low with customizable styles, colors, and widths.
Smart Money Sweep Detection:
Marks PDH or PDL sweeps using visual labels whenever liquidity is taken.
Clean Visual Customization:
Choose line style (Solid, Dashed, Dotted), color themes, label display, and toggle visibility for all components.
Lightweight & Efficient:
Optimized for smooth performance even on lower timeframes (1m–15m).
⚙️ Settings:
✅ Show PDH / Show PDL
🏷️ Show Labels on Lines
💧 Show Liquidity Sweeps
🎨 Line Style, Width, and Color Controls
💡 How to Use:
Use PDH/PDL as key liquidity levels where price often reacts.
Watch for sweeps (liquidity grabs) followed by structure shifts to identify potential trade setups.
Combine with other SMC tools, such as Order Blocks, FVGs, or BOS/CHoCH indicators, for confirmation.

Brahmastra with SMC by PoojaSummary
This indicator provides a structured trend-and-momentum workflow that issues Partial and Confirmed trade signals using a combination of trend filters, momentum confirmation, and structure breaks.
It helps traders identify higher-probability trade locations through multi-timeframe confirmation and automatic alert payloads — while keeping the underlying signal logic private (invite-only).
Core Components (high level overview — no source code revealed)
• Trend Filters: EMA (configurable length), VWAP, and Supertrend are used to define overall trend direction and to gate signals.
• Momentum: RSI (configurable length and upper/lower thresholds) helps confirm momentum and optional divergence blocking.
• Market Structure: BOS / CHoCH (Break of Structure / Change of Character) logic with MTF pivots to detect structure-based opportunities.
• Signal Types: Partial signals appear early as potential setups; Confirmed signals meet stricter multi-factor conditions (EMA/VWAP/Supertrend + RSI + optional MTF).
• Repaint Safety: Non-repaint mode available (triggers only after candle close).
• Alerts: Built-in alert messages with optional JSON webhook format.
• Customization: Flexible inputs for sessions, pivots, labels, colors, lookbacks, and MTF parameters to adapt across multiple timeframes.
How to Interpret Signals
• Treat Partial signals as setups to monitor — not instant entries. Wait for confirmation or confluence from price behavior.
• Treat Confirmed signals as higher-probability opportunities that satisfy trend and momentum alignment.
• Enable MTF confirmation selectively on smaller timeframes (e.g., 5m using 15m/1H confirmation).
• Use Non-repaint mode (trigger only after candle close) for safe alert generation.
Limitations & Risk Notice
This indicator does not guarantee profits or accuracy. It is a technical and educational tool meant to assist analysis.
All trading decisions, entries, and exits are the sole responsibility of the user. Always perform backtesting and paper trading before live use.
This is not financial advice.
Version Note & Support
This is a closed invite-only script. The indicator includes configuration options for labels, alerts, and MTF pivots.
For approved users seeking modifications or usage details, please contact the author (see Author’s Instructions section).

X C/P VPDescription
The X C/P VP indicator visualizes intraperiod option flow dynamics for any selected call and put contracts. It plots the volume of both options as overlapping histograms, allowing traders to observe where liquidity and participation are concentrated.
A small dot appears above a bar only when the option’s closing price increases relative to the prior bar, providing an immediate visual cue of upward price pressure within volume spikes.
By combining these two layers—volume intensity and directional confirmation—the indicator makes it easy to spot where the market is actively repricing risk across the call/put structure.
Use Case
Designed for 0DTE and short-dated options, especially index ETFs such as QQQ or SPY.
Helps traders compare call vs. put participation to gauge sentiment skew and intraday balance.
Useful for monitoring volume surges tied to delta hedging, gamma shifts, or option repricing following volatility or directional moves.
Can be applied on 1-minute to 15-minute timeframes to observe how option volume evolves through key market sessions (e.g., open, midday, close).
Dots highlight periods where premium expansion accompanies increased volume—often an early sign of momentum or positioning bias.
Summary
X C/P VP serves as a lightweight, visually intuitive tool to read the rhythm of call and put activity intraday—offering an at-a-glance pulse of which side of the options market is taking control.

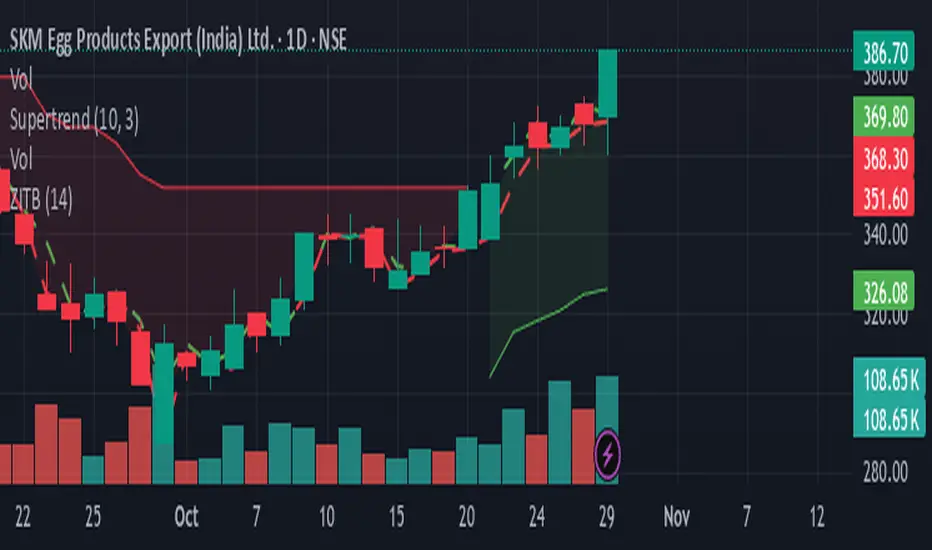
Zarattini Intra-day Threshold Bands (ZITB)This indicator implements the intraday threshold band methodology described in the research paper by Carlo Zarattini et al.
Overview:
Plots intraday threshold bands based on daily open/close levels.
Supports visualization of BaseUp/BaseDown levels and Threshold Upper/Lower bands.
Optional shading between threshold bands for easier interpretation.
Usage Notes / Limitations:
Originally studied on SPY (US equities), this implementation is adapted for NSE intraday market timing, specifically the NIFTY50 index.
Internally, 2-minute candles are used if the chart timeframe is less than 2 minutes.
Values may be inaccurate if the chart timeframe is more than 1 day.
Lookback days are auto-capped to avoid exceeding TradingView’s 5000-bar limit.
The indicator automatically aligns intraday bars across multiple days to compute average deltas.
For better returns, it is recommended to use this indicator in conjunction with VWAP and a volatility-based position sizing mechanism.
Can be used as a reference for Open Range Breakout (ORB) strategies.
Customizations:
Toggle plotting of base levels and thresholds.
Toggle shading between thresholds.
Line colors and styles can be adjusted in the Style tab.
Intended for educational and research purposes only.
This indicator implements the approach described in the research paper by Zarattini et al.
Note: This implementation is designed for the NSE NIFTY50 index. While Zarattini’s original study was conducted on SPY, this version adapts the methodology for the Indian market.
Methodology Explanation
This indicator is primarily designed for Open Range Breakout (ORB) strategies.
Base Levels
BaseUp = Maximum of today’s open and previous day’s close
BaseDown = Minimum of today’s open and previous day’s close
Delta Calculation
For the past 14 trading days (lookbackDays), the delta for each intraday candle is calculated as the ab
solute difference from the close of the first candle of that day.
Average Delta
For a given intraday time/candle today, deltaAvg is computed as the average of the deltas at the same time across the previous 14 days.
Threshold Bands
ThresholdUp = BaseUp + deltaAvg
ThresholdDown = BaseDown − deltaAvg
Signals
Spot price moving above ThresholdUp → Long signal
Spot price moving below ThresholdDown → Short signal
Tip: For better returns, combine this indicator with VWAP and a volatility-based position sizing mechanism.
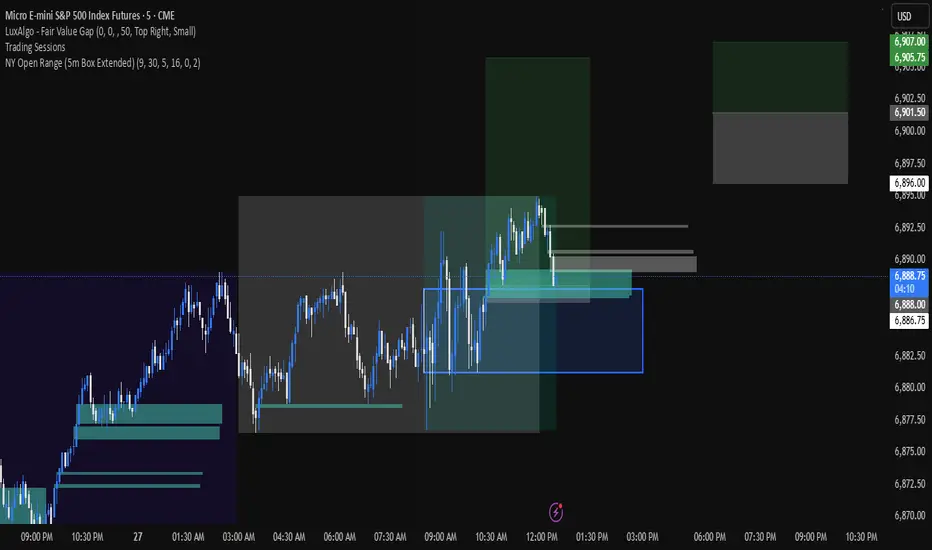
NY Open 5 minute Range (5m Box Extended)Draws a box around the first 5 minute candle for the New York session.
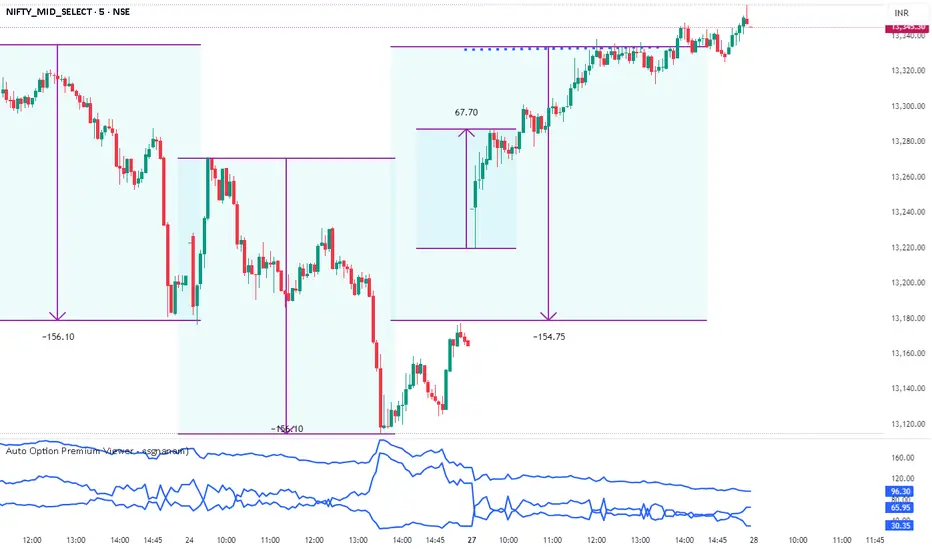
Auto Option Premium Viewer - csgnanamThat's a great idea! Clear documentation is key for anyone using your script. Since your selected code block is the dedicated space for documentation, I'll provide an explanation tailored for that context, covering the main features of your "Auto Option Premium Viewer" Canvas.
Here is a detailed explanation of the script's core functionality, which you can use in your Canvas description or in a separate document to help users understand it.
I will not edit the Canvas itself, as you requested a separate explanation.
***
### Explanation of the "Auto Option Premium Viewer" Canvas
This Pine Script indicator, **"Auto Option Premium Viewer — Full Auto Symbols (NSE format, improved detection),"** is designed to automatically fetch and display the At-The-Money (ATM) Call and Put option premiums for major NSE indices (NIFTY, BANKNIFTY, MIDCPNIFTY, FINNIFTY) in real-time.
The primary goal is to provide a single, clean chart overlay showing the total premium (CE + PE) for the options closest to the current spot price, without requiring the user to manually enter strike prices or steps.
#### 1. Automatic Index Detection (`AUTO` Functionality)
* **Smart Underlying Detection:** The script attempts to automatically detect the index you are currently viewing (`activeUnderlying`). For example, if your chart is set to `BANKNIFTY`, the indicator automatically focuses on Bank Nifty options.
* **Spot Ticker Mapping (The Fix):** To accurately find the spot price, the script uses a helper function (`getSpotTicker`) to map the common index name (like `FINNIFTY`) to the specific underlying ticker required by TradingView (like `CNXFINANCE` or `NIFTY_MID_SELECT`). This ensures accurate price referencing for ATM calculation across all indices.
#### 2. Fully Automated Strike & Step Sizing
* **No Base Strike Inputs:** The script dynamically calculates the At-The-Money (ATM) strike price based on the live spot price of the underlying index.
* **Fixed Strike Steps:** The strike increment (`current_step`) is hardcoded based on market conventions:
* **100:** NIFTY, BANKNIFTY, FINNIFTY
* **50:** MIDCPNIFTY
* **Dynamic ATM Calculation:** The live spot price is rounded to the nearest valid strike based on the correct step size. This automatically determines the central strike (B), along with the adjacent strikes (A and C) to ensure the fetched data is always relevant.
#### 3. Data Fetching and Display
* **Symbol Construction:** The `buildSymbol` function creates the exact NSE option symbol string (e.g., `NSE:NIFTY251028C26000`) required by the `request.security` function.
* **Option Price Request:** The script uses `request.security` to fetch the closing price (`close`) of the Call and Put options for the three relevant strikes (A, B, C) on a fixed **5-minute** timeframe (`dataTF`).
* **Plots:** The indicator displays three lines on the chart's lower panel:
1. **ATM CE Premium:** The price of the Call option closest to ATM.
2. **ATM PE Premium:** The price of the Put option closest to ATM.
3. **ATM Total Premium:** The sum of CE + PE, often used as a proxy for the minimum expected range or implied volatility.
This automatic setup makes the Canvas extremely efficient for quick analysis without needing to manually adjust any numerical settings.
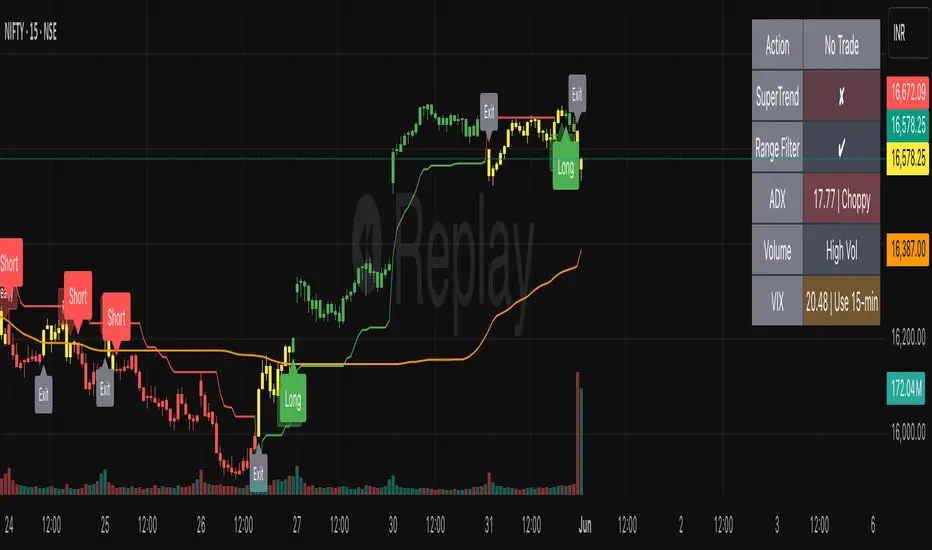
SmartTrend Pro - Options [V5.0 ]A Multi-filter trend-following system designed specifically OPTION SPREAD STRATEGY in NIFTY and Indian Indices - Works by combining price action, volatility, and market regime awareness to reduce whipsaws while capturing strong trends. The indicator dynamically adapts to market conditions using real VIX data and enforces disciplined entry/exit rules based on confirmed signals.
Adaptive Timeframe Guidance
Recommends 15-minute chart when VIX ≥ 13 (high volatility)
Recommends 45-minute chart when VIX < 13 (low volatility)
Uses real-time NSE:INDIAVIX data (daily close)
Whipsaw-Resistant Logic
SuperTrend (ATR 10, Multiplier 3.0) for stable trend direction
Range Filter (100-period smoothed median) to confirm price structure
2-bar confirmation required for all entries (avoids false breakouts)
ADX ≥ 25 ensures only strong trends are traded
Smart Trade Management
Exits based purely on price action (no premature exits due to volatility drops)
No forced reversals — positions held until trend truly end
Designed For
Traders who want fewer, higher-quality signals
Markets with volatile regime shifts (like NIFTY)
Avoiding choppy, sideways whipsaws without missing major moves
Philosophy
“Be patient in noise, aggressive in trend.”
This system stays out during uncertainty (yellow candles) and commits fully when all conditions align — letting winners run while cutting losers quickly.
How to Use
Apply to NIFTY futures or spot
Check dashboard:
If VIX ≥ 13 → use 15-min chart
If VIX < 13 → use 45-min chart
Only take trades when:
All ✔ align under “Long” or “Short”
Candle turns green/red (not yellow)
This indicator is not a black box — it’s a transparent, rule-based framework that puts you in control, with full visibility into why every signal appears (or doesn’t).