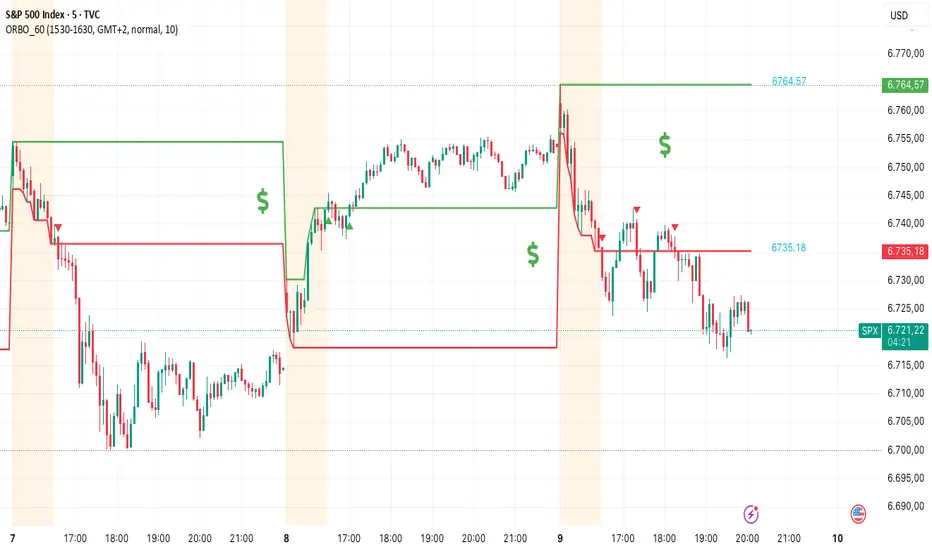
Willy ORB for Gold – Session Presets (NY 5m)What it does:
Plots the opening-range high/low for the main Gold sessions (Shanghai, Tokyo, Sydney, Frankfurt, London, New York 5-minute OR by default). It projects TP1/TP2 expansion targets, supports a timezone offset so opens line up with your broker, and includes breakout alerts on confirmed closes.
⸻
Why it’s Gold-friendly
• New York (COMEX pit): 5-minute opening range at ~20:20 local (via your offset) to capture the most active burst.
• London / Frankfurt: strong European volatility windows for XAU/USD.
• Shanghai / Tokyo / Sydney: structure-setting sessions before momentum builds.
⸻
Features
• Session presets: SH, TK, SY, FR, LDN, NY (5m) — toggle individually
• 15m OR for all sessions except NY (5m) by default (editable per session)
• TP1 / TP2 expansion targets (user-defined multiples)
• Labels for 15m/5m range and targets; customizable styles
• Timezone offset control (aligns lines to your local clock)
• Daily auto-reset for clean levels
• Alerts: “Closed Above Range High” / “Closed Below Range Low” per session
⸻
How to use
1. Add to chart (best on 1–15m).
2. In settings → Gold Sessions, toggle the sessions you want.
3. Set “My time offset from chart (hours)” so session lines match your broker time.
4. Trade the breakouts: when price closes beyond the session high/low, TP levels plot automatically.
⸻
Parameters (quick guide)
• Targets: TP1/TP2 multiples (e.g., 1.0 and 2.0).
• Labels: left/right label placement, line styles/colors.
• Sessions: enable/disable + choose each session’s OR length (NY defaults to 5m).
⸻
Tips for XAU/USD
• London often gives the cleanest first breakout.
• New York tends to drive continuation after data releases.
• Consider pairing with volume/volatility or HTF trend for confluence.
⸻
Notes
• Built in Pine Script v6.
• Indicator (not a strategy). For backtests, use a companion strategy that trades the closes beyond the OR with SL at the opposite side and TP by R.
⸻
Disclaimer
For educational purposes only. Not financial advice. Always backtest and manage risk.
Orb

Opening Range HarmoniX
This is an all-in-one, modular toolkit designed for intraday traders, especially those focusing on the New York session. It combines a fully customizable Opening Range (OR) with a suite of essential indicators (Moving Average, VWAP, Supertrend, and Pivots) to provide a complete and clean view of the market.
All modules (indicators) can be toggled on or off individually, and the entire settings menu is fully translated in both English and Farsi (Persian).
Key Features
1. Customizable Opening Range (OR):
Range Timeframe: Set your OR timeframe (5, 15, or 30 min).
Precise Start Time: Define the exact start hour and minute (default 9:30 NY Time).
Key Levels: Includes OR High, OR Low, and a crucial Mid Line for price equilibrium.
Extension Method: Choose how lines extend: "Until NY Session Close" (16:00) or for a fixed "Number of Bars".
Full Styling: Complete control over color, width, and line style (solid, dashed, dotted) for all levels.
2. Dynamic Day Label:
Automatically displays the day of the week (in English or Farsi) and the selected OR timeframe (e.g., "Monday - 15m") at the start of the range.
3. Built-in Indicator Suite (All Toggleable):
Moving Average (MA):
Multiple Types: Choose from SMA, EMA, WMA, HMA, or VWMA.
Dynamic Coloring: MA line color automatically changes based on its upward (Uptrend) or downward (Downtrend) slope.
VWAP (Daily):
Features similar dynamic coloring to quickly identify the intraday trend bias.
Supertrend:
A classic trend-following tool with customizable ATR Period and Factor.
Dynamic trend-based coloring (uptrend/downtrend).
Pivot Points:
Classic high/low pivots with customizable lookback periods (left/right) to spot key turning points in the market.
💡 Core Concept
Use the Opening Range levels (High, Low, and Mid) as primary support/resistance and to establish the bias for the day. Then, use the additional indicators (MA, VWAP, Supertrend) to confirm trend direction and identify entry/exit opportunities in relation to the OR levels.

15-Min Opening Range Indicator & Breakout Targets (ORB)- Willy
🔍 Overview
The **15-Min ORB (Opening Range Breakout)** indicator automatically identifies the **first 15-minute high and low range** after a market opens — and plots breakout targets based on user-defined expansion multiples.
It’s designed for traders who use **Opening Range Breakout (ORB)** strategies across multiple markets or sessions — and want **precise timing adjusted to their own timezone**.
---
⚙️ Features
🕐 **Time-Zone Offset (Local Adjustment)**
* Automatically shift your ORB window to match your **local timezone**.
* No more guessing when “09:30” happens in your region.
* Simply set the **offset (hours ahead or behind chart time)** and the indicator adjusts everything automatically.
⏱ **15-Minute Opening Range**
* Plots the high and low of your chosen 15-minute window.
* Works with any market or trading session (NYSE, London, Tokyo, Crypto, etc.).
* User can define **custom start hour and minute**.
🎯 **Breakout Targets (TP1, TP2)**
* Automatically calculates and draws **Take Profit levels** using customizable expansion multiples.
* Configurable TP1 / TP2 lines and labels with selectable styles (solid, dashed, dotted).
💬 **Visual Labels**
* Clear text labels showing:
* 15m High and Low levels.
* TP1 and TP2 targets.
* Label placement (left or right) adjustable for chart preference.
🧹 **Automatic Daily Reset**
* Resets all levels and targets at your midnight (or market day boundary).
* Ensures clean new ORB levels every day.
🔔 **Breakout Alerts**
* Built-in TradingView alerts for:
* **Closed Above 15m High**
* **Closed Below 15m Low**
---
🧭 How to Use
1. **Add to Chart**
* Click “Add to Favorite Scripts” and apply to your desired symbol.
* Works best on intraday timeframes (1m–15m).
2. **Set Your Market Session**
* Choose your **Range Start Hour and Minute** (e.g., 9:30 for NYSE).
* Set **My Time Offset from Chart (hours)** — for example:
* NYSE 9:30 New York → Bangkok (+12 hours)
* London 8:00 → Bangkok (+7 hours)
* The indicator adjusts automatically.
3. **Monitor the Range**
* The first 15-minute high and low are drawn as purple lines.
* When price breaks above or below, TP levels appear.
4. **Trade Your Plan**
* Alerts trigger when candles close outside the range.
* Manage targets using the expansion multipliers.
---
🧮 Example Settings
| Market | Local Open (Your Time) | Range Start (chart time) | Offset | Notes |
| :----------- | :--------------------------------- | :----------------------- | :----- | :----------------------- |
| NYSE (US) | 9:30 AM New York → 9:30 PM Bangkok | 9 | +12 | Typical for Thai traders |
| LSE (UK) | 8:00 AM London → 3:00 PM Bangkok | 8 | +7 | EU market overlap |
| Tokyo | 9:00 AM Tokyo → 7:00 AM Bangkok | 9 | +2 | Asian session |
| Crypto (UTC) | 0:00 UTC → 7:00 AM Bangkok | 0 | +7 | 24/7 markets |
---
📐 Parameters
### 15-Minute Range
* **Display 15-Minute Range** — toggles the range lines.
* **Show 15-Minute Labels** — toggles the range high/low labels.
* **Range Start Hour / Minute** — defines the start of your 15m window.
* **My Time Offset from Chart (hours)** — shifts the calculation to your local time.
* **Range Color / Style** — customize the look of your range lines.
### Targets
* **TP1 Expansion Multiple** — default `1.0` (equal to full range).
* **TP2 Expansion Multiple** — default `2.0`.
* **Show TP1 / TP2 Levels & Labels** — toggle individually.
* **TP Label Color** — customize breakout target visuals.
### Labels
* **Label Position (Left/Right)** — choose where labels appear on chart.
---
## 💡 Strategy Ideas
* Combine with volume or volatility filters for better confirmation.
* Use alongside VWAP, EMA, or session profiles for confluence.
* Apply on different markets:
* **Stocks (NYSE, NASDAQ)** — morning ORB strategy.
* **FX (London Open)** — volatility breakout.
* **Crypto (UTC 00:00)** — daily range breakout.
---
🧩 Technical Notes
* Built in **Pine Script v6**.
* Works on all intraday timeframes.
* Time calculations are local-adjusted using integer offset logic (avoids DST issues).
* No repainting — range values lock once 15m window completes.
---
🚀 Author Notes
Created for traders who want **simple, reliable ORB logic that respects your timezone**.
No unnecessary complexity — everything resets cleanly each day.
Tested and verified on:
* BTCUSD (Binance)
* ES1! (CME Futures)
* NAS100 / SPX500
* EURUSD / GBPJPY
* Thai SET50 index
---
🔔 Alerts
* “Closed Above 15m High”
* “Closed Below 15m Low”
You can configure custom alerts with your own messages.
---
## ⚠️ Disclaimer
This script is **for educational purposes only**.
It does not constitute financial advice or guarantee results.
Always backtest and trade responsibly.

BrianDayTrades ORBThis script enables you to trade the 5m, 15m, or 30m ORB or any combination. You can select the main one you want, and see 25%, 50%, 75% lines as well as 50% and 100% extension lines above and below.
BrianDayTrades IBThis indicator plots the Initial Balance for the NY Open. This takes the high and low of the first hour between 9:30am and 10:30am New York time.
You can adjust which lines and labels are shown.
The Initial Balance high and low are shown with 25%, 50%, 75% lines; as well as 50% and 100% above and below the IB range for targets to use as take profits.
Luxy BIG beautiful Dynamic ORBThis is an advanced Opening Range Breakout (ORB) indicator that tracks price breakouts from the first 5, 15, 30, and 60 minutes of the trading session. It provides complete trade management including entry signals, stop-loss placement, take-profit targets, and position sizing calculations.
The ORB strategy is based on the concept that the opening range of a trading session often acts as support/resistance, and breakouts from this range tend to lead to significant moves.
What Makes This Different?
Most ORB indicators simply draw horizontal lines and leave you to figure out the rest. This indicator goes several steps further:
Multi-Stage Tracking
Instead of just one ORB timeframe, this tracks FOUR simultaneously (5min, 15min, 30min, 60min). Each stage builds on the previous one, giving you multiple trading opportunities throughout the session.
Active Trade Management
When a breakout occurs, the indicator automatically calculates and displays entry price, stop-loss, and multiple take-profit targets. These lines extend forward and update in real-time until the trade completes.
Cycle Detection
Unlike indicators that only show the first breakout, this tracks the complete cycle: Breakout → Retest → Re-breakout. You can see when price returns to test the ORB level after breaking out (potential re-entry).
Failed Breakout Warning
If price breaks out but quickly returns inside the range (within a few bars), the label changes to "FAILED BREAK" - warning you to exit or avoid the trade.
Position Sizing Calculator
Built-in risk management that tells you exactly how many shares to buy based on your account size and risk tolerance. No more guessing or manual calculations.
Advanced Filtering
Optional filters for volume confirmation, trend alignment, and Fair Value Gaps (FVG) to reduce false signals and improve win rate.
Core Features Explained
### 1. Multi-Stage ORB Levels
The indicator builds four separate Opening Range levels:
ORB 5 - First 5 minutes (fastest signals, most volatile)
ORB 15 - First 15 minutes (balanced, most popular)
ORB 30 - First 30 minutes (slower, more reliable)
ORB 60 - First 60 minutes (slowest, most confirmed)
Each level is drawn as a horizontal range on your chart. As time progresses, the ranges expand to include more price action. You can enable or disable any stage and assign custom colors to each.
How it works: During the opening minutes, the indicator tracks the highest high and lowest low. Once the time period completes, those levels become your ORB high and low for that stage.
### 2. Breakout Detection
When price closes outside the ORB range, a label appears:
BREAK UP (green label above price) - Price closed above ORB High
BREAK DOWN (red label below price) - Price closed below ORB Low
The label shows which ORB stage triggered (ORB5, ORB15, etc.) and the cycle number if tracking multiple breakouts.
Important: Signals appear on bar close only - no repainting. What you see is what you get.
### 3. Retest Detection
After price breaks out and moves away, if it returns to test the ORB level, a "RETEST" label appears (orange). This indicates:
The original breakout level is now acting as support/resistance
Potential re-entry opportunity if you missed the first breakout
Confirmation that the level is significant
The indicator requires price to move a minimum distance away before considering it a valid retest (configurable in settings).
### 4. Failed Breakout Detection
If price breaks out but returns inside the ORB range within a few bars (before the breakout is "committed"), the original label changes to "FAILED BREAK" in orange.
This warns you:
The breakout lacked conviction
Consider exiting if already in the trade
Wait for better setup
Committed Breakout: The indicator tracks how many bars price stays outside the range. Only after staying outside for the minimum number of bars does it become a committed breakout that can be retested.
### 5. TP/SL Lines (Trade Management)
When a breakout occurs, colored horizontal lines appear showing:
Entry Line (cyan for long, orange for short) - Your entry price (the ORB level)
Stop Loss Line (red) - Where to exit if trade goes against you
TP1, TP2, TP3 Lines (same color as entry) - Profit targets at 1R, 2R, 3R
These lines extend forward as new bars form, making it easy to track your trade. When a target is hit, the line turns green and the label shows a checkmark.
Lines freeze (stop updating) when:
Stop loss is hit
The final enabled take-profit is hit
End of trading session (optional setting)
### 6. Position Sizing Dashboard
The dashboard (bottom-left corner by default) shows real-time information:
Current ORB stage and range size
Breakout status (Inside Range / Break Up / Break Down)
Volume confirmation (if filter enabled)
Trend alignment (if filter enabled)
Entry and Stop Loss prices
All enabled Take Profit levels with percentages
Risk/Reward ratio
Position sizing: Max shares to buy and total risk amount
Position Sizing Example:
If your account is $25,000 and you risk 1% per trade ($250), and the distance from entry to stop loss is $0.50, the calculator shows you can buy 500 shares (250 / 0.50 = 500).
### 7. FVG Filter (Fair Value Gap)
Fair Value Gaps are price inefficiencies - gaps left by strong momentum where one candle's high doesn't overlap with a previous candle's low (or vice versa).
When enabled, this filter:
Detects bullish and bearish FVGs
Draws semi-transparent boxes around these gaps
Only allows breakout signals if there's an FVG near the breakout level
Why this helps: FVGs indicate institutional activity. Breakouts through FVGs tend to be stronger and more reliable.
Proximity setting: Controls how close the FVG must be to the ORB level. 2.0x means the breakout can be within 2 times the FVG size - a reasonable default.
### 8. Volume & Trend Filters
Volume Filter:
Requires current volume to be above average (customizable multiplier). High volume breakouts are more likely to sustain.
Set minimum multiplier (e.g., 1.5x = 50% above average)
Set "strong volume" multiplier (e.g., 2.5x) that bypasses other filters
Dashboard shows current volume ratio
Trend Filter:
Only shows breakouts aligned with a higher timeframe trend. Choose from:
VWAP - Price above/below volume-weighted average
EMA - Price above/below exponential moving average
SuperTrend - ATR-based trend indicator
Combined modes (VWAP+EMA, VWAP+SuperTrend) for stricter filtering
### 9. Pullback Filter (Advanced)
Purpose:
Waits for price to pull back slightly after initial breakout before confirming the signal.
This reduces false breakouts from immediate reversals.
How it works:
- After breakout is detected, indicator waits for a small pullback (default 2%)
- Once pullback occurs AND price breaks out again, signal is confirmed
- If no pullback within timeout period (5 bars), signal is issued anyway
Settings:
Enable Pullback Filter: Turn this filter on/off
Pullback %: How much price must pull back (2% is balanced)
Timeout (bars): Max bars to wait for pullback (5 is standard)
When to use:
- Choppy markets with many fake breakouts
- When you want higher quality signals
- Combine with Volume filter for maximum confirmation
Trade-off:
- Better signal quality
- May miss some valid fast moves
- Slight entry delay
How to Use This Indicator
### For Beginners - Simple Setup
Add the indicator to your chart (5-minute or 15-minute timeframe recommended)
Leave all default settings - they work well for most stocks
Watch for BREAK UP or BREAK DOWN labels to appear
Check the dashboard for entry, stop loss, and targets
Use the position sizing to determine how many shares to buy
Basic Trading Plan:
Wait for a clear breakout label
Enter at the ORB level (or next candle open if you're late)
Place stop loss where the red line indicates
Take profit at TP1 (50% of position) and TP2 (remaining 50%)
### For Advanced Traders - Customized Setup
Choose which ORB stages to track (you might only want ORB15 and ORB30)
Enable filters: Volume (stocks) or Trend (trending markets)
Enable FVG filter for institutional confirmation
Set "Track Cycles" mode to catch retests and re-breakouts
Customize stop loss method (ATR for volatile stocks, ORB% for stable ones)
Adjust risk per trade and account size for accurate position sizing
Advanced Strategy Example:
Enable ORB15 only (disable others for cleaner chart)
Turn on Volume filter at 1.5x with Strong at 2.5x
Enable Trend filter using VWAP
Set Signal Mode to "Track Cycles" with Max 3 cycles
Wait for aligned breakouts (Volume + Trend + Direction)
Enter on retest if you missed the initial break
### Timeframe Recommendations
5-minute chart: Scalping, very active trading, crypto
15-minute chart: Day trading, balanced approach (most popular)
30-minute chart: Swing entries, less screen time
60-minute chart: Position trading, longer holds
The indicator works on any intraday timeframe, but ORB is fundamentally a day trading strategy. Daily charts don't make sense for ORB.
DEFAULT CONFIGURATION
ON by Default:
• All 4 ORB stages (5/15/30/60)
• Breakout Detection
• Retest Labels
• All TP levels (1/1.5/2/3)
• TP/SL Lines (Detailed mode)
• Dashboard (Bottom Left, Dark theme)
• Position Size Calculator
OFF by Default (Optional Filters):
• FVG Filter
• Pullback Filter
• Volume Filter
• Trend Filter
• HTF Bias Check
• Alerts
Recommended for Beginners:
• Leave all defaults
• Session Mode: Auto-Detect
• Signal Mode: Track Cycles
• Stop Method: ATR
• Add Volume Filter if trading stocks
Recommended for Advanced:
• Enable ORB15 + ORB30 only (disable 5 & 60)
• Enable: Volume + Trend + FVG
• Signal Mode: Track Cycles, Max 3
• Stop Method: ATR or Safer
• Enable HTF Daily bias check
## Settings Guide
The settings are organized into logical groups. Here's what each section controls:
### ORB COLORS Section
Show Edge Labels: Display "ORB 5", "ORB 15" labels at the right edge of the levels
Background: Fill the area between ORB high/low with color
Transparency: How see-through the background is (95% is nearly invisible)
Enable ORB 5/15/30/60: Turn each stage on or off individually
Colors: Assign colors to each ORB stage for easy identification
### SESSION SETTINGS Section
Session Mode: Choose trading session (Auto-Detect works for most instruments)
Custom Session Hours: Define your own hours if needed (format: HHMM-HHMM)
Auto-Detect uses the instrument's natural hours (stocks use exchange hours, crypto uses 24/7).
### BREAKOUT DETECTION Section
Enable Breakout Detection: Master switch for signals
Show Retest Labels: Display retest signals
Label Size: Visual size for all labels (Small recommended)
Enable FVG Filter: Require Fair Value Gap confirmation
Show FVG Boxes: Display the gap boxes on chart
Signal Mode: "First Only" = one signal per direction per day, "Track Cycles" = multiple signals
Max Cycles: How many breakout-retest cycles to track (6 is balanced)
Breakout Buffer: Extra distance required beyond ORB level (0.1-0.2% recommended)
Min Distance for Retest: How far price must move away before retest is valid (2% recommended)
Min Bars Outside ORB: Bars price must stay outside for committed breakout (2 is balanced)
### TARGETS & RISK Section
Enable Targets & Stop-Loss: Calculate and show trade management
TP1/TP2/TP3 checkboxes: Select which profit targets to display
Stop Method: How to calculate stop loss placement
- ATR: Based on volatility (best for most cases)
- ORB %: Fixed % of ORB range
- Swing: Recent swing high/low
- Safer: Widest of all methods
ATR Length & Multiplier: Controls ATR stop distance (14 period, 1.5x is standard)
ORB Stop %: Percentage beyond ORB for stop (20% is balanced)
Swing Bars: Lookback period for swing high/low (3 is recent)
### TP/SL LINES Section
Show TP/SL Lines: Display horizontal lines on chart
Label Format: "Short" = minimal text, "Detailed" = shows prices
Freeze Lines at EOD: Stop extending lines at session close
### DASHBOARD Section
Show Info Panel: Display the metrics dashboard
Theme: Dark or Light colors
Position: Where to place dashboard on chart
Toggle rows: Show/hide specific information rows
Calculate Position Size: Enable the position sizing calculator
Risk Mode: Risk fixed $ amount or % of account
Account Size: Your total trading capital
Risk %: Percentage to risk per trade (0.5-1% recommended)
### VOLUME FILTER Section
Enable Volume Filter: Require volume confirmation
MA Length: Average period (20 is standard)
Min Volume: Required multiplier (1.5x = 50% above average)
Strong Volume: Multiplier that bypasses other filters (2.5x)
### TREND FILTER Section
Enable Trend Filter: Require trend alignment
Trend Mode: Method to determine trend (VWAP is simple and effective)
Custom EMA Length: If using EMA mode (50 for swing, 20 for day trading)
SuperTrend settings: Period and Multiplier if using SuperTrend mode
### HIGHER TIMEFRAME Section
Check Daily Trend: Display higher timeframe bias in dashboard
Timeframe: What TF to check (D = daily, recommended)
Method: Price vs MA (stable) or Candle Direction (reactive)
MA Period: EMA length for Price vs MA method (20 is balanced)
Min Strength %: Minimum strength threshold for HTF bias to be considered
- For "Price vs MA": Minimum distance (%) from moving average
- For "Candle Direction": Minimum candle body size (%)
- 0.5% is balanced - increase for stricter filtering
- Lower values = more signals, higher values = only strong trends
### ALERTS Section
Enable Alerts: Master switch (must be ON to use any alerts)
Breakout Alerts: Notify on ORB breakouts
Retest Alerts: Notify when price retests after breakout
Failed Break Alerts: Notify on failed breakouts
Stage Complete Alerts: Notify when each ORB stage finishes forming
After enabling desired alert types, click "Create Alert" button, select this indicator, choose "Any alert() function call".
## Tips & Best Practices
### General Trading Tips
ORB works best on liquid instruments (stocks with good volume, major crypto pairs)
First hour of the session is most important - that's when ORB is forming
Breakouts WITH the trend have higher success rates - use the trend filter
Failed breakouts are common - use the "Min Bars Outside" setting to filter weak moves
Not every day produces good ORB setups - be patient and selective
### Position Sizing Best Practices
Never risk more than 1-2% of your account on a single trade
Use the built-in calculator - don't guess your position size
Update your account size monthly as it grows
Smaller accounts: use $ Amount mode for simplicity
Larger accounts: use % of Account mode for scaling
### Take Profit Strategy
Most traders use: 50% at TP1, 50% at TP2
Aggressive: Hold through TP1 for TP2 or TP3
Conservative: Full exit at TP1 (1:1 risk/reward)
After TP1 hits, consider moving stop to breakeven
TP3 rarely hits - only on strong trending days
### Filter Combinations
Maximum Quality: Volume + Trend + FVG (fewest signals, highest quality)
Balanced: Volume + Trend (good quality, reasonable frequency)
Active Trading: No filters or Volume only (many signals, lower quality)
Trending Markets: Trend filter essential (indices, crypto)
Range-Bound: Volume + FVG (avoid trend filter)
### Common Mistakes to Avoid
Chasing breakouts - wait for the bar to close, don't FOMO into wicks
Ignoring the stop loss - always use it, move it manually if needed
Over-leveraging - the calculator shows MAX shares, you can buy less
Trading every signal - quality > quantity, use filters
Not tracking results - keep a journal to see what works for YOU
## Pros and Cons
### Advantages
Complete all-in-one solution - from signal to position sizing
Multiple timeframes tracked simultaneously
Visual clarity - easy to see what's happening
Cycle tracking catches opportunities others miss
Built-in risk management eliminates guesswork
Customizable filters for different trading styles
No repainting - what you see is locked in
Works across multiple markets (stocks, forex, crypto)
### Limitations
Intraday strategy only - doesn't work on daily charts
Requires active monitoring during first 1-2 hours of session
Not suitable for after-hours or extended sessions by default
Can produce many signals in choppy markets (use filters)
Dashboard can be overwhelming for complete beginners
Performance depends on market conditions (trends vs ranges)
Requires understanding of risk management concepts
### Best For
Day traders who can watch the first 1-2 hours of market open
Traders who want systematic entry/exit rules
Those learning proper position sizing and risk management
Active traders comfortable with multiple signals per day
Anyone trading liquid instruments with clear sessions
### Not Ideal For
Swing traders holding multi-day positions
Set-and-forget / passive investors
Traders who can't watch market open
Complete beginners unfamiliar with trading concepts
Low volume / illiquid instruments
## Frequently Asked Questions
Q: Why are no signals appearing?
A: Check that you're on an intraday timeframe (5min, 15min, etc.) and that the current time is within your session hours. Also verify that "Enable Breakout Detection" is ON and at least one ORB stage is enabled. If using filters, they might be blocking signals - try disabling them temporarily.
Q: What's the best ORB stage to use?
A: ORB15 (15 minutes) is most popular and balanced. ORB5 gives faster signals but more noise. ORB30 and ORB60 are slower but more reliable. Many traders use ORB15 + ORB30 together.
Q: Should I enable all the filters?
A: Start with no filters to see all signals. If too many false signals, add Volume filter first (stocks) or Trend filter (trending markets). FVG filter is most restrictive - use for maximum quality but fewer signals.
Q: How do I know which stop loss method to use?
A: ATR works for most cases - it adapts to volatility. Use ORB% if you want predictable stop placement. Swing is for respecting chart structure. Safer gives you the most room but largest risk.
Q: Can I use this for swing trading?
A: Not really - ORB is fundamentally an intraday strategy. The ranges reset each day. For swing trading, look at weekly support/resistance or moving averages instead.
Q: Why do TP/SL lines disappear sometimes?
A: Lines freeze (stop extending) when: stop loss is hit, the last enabled take-profit is hit, or end of session arrives (if "Freeze at EOD" is enabled). This is intentional - the trade is complete.
Q: What's the difference between "First Only" and "Track Cycles"?
A: "First Only" shows one breakout UP and one DOWN per day maximum - clean but might miss opportunities. "Track Cycles" shows breakout-retest-rebreak sequences - more signals but busier chart.
Q: Is position sizing accurate for options/forex?
A: The calculator is designed for shares (stocks). For options, ignore the share count and use the risk amount. For forex, you'll need to adapt the lot size calculation manually.
Q: How much capital do I need to use this?
A: The indicator works for any account size, but practical day trading typically requires $25,000 in the US due to Pattern Day Trader rules. Adjust the "Account Size" setting to match your capital.
Q: Can I backtest this strategy?
A: This is an indicator, not a strategy script, so it doesn't have built-in backtesting. You can visually review historical signals or code a strategy script using similar logic.
Q: Why does the dashboard show different entry price than the breakout label?
A: If you're looking at an old breakout, the ORB levels may have changed when the next stage completed. The dashboard always shows the CURRENT active range and trade setup.
Q: What's a good win rate to expect?
A: ORB strategies typically see 40-60% win rate depending on market conditions and filters used. The strategy relies on positive risk/reward ratios (2:1 or better) to be profitable even with moderate win rates.
Q: Does this work on crypto?
A: Yes, but crypto trades 24/7 so you need to define what "session start" means. Use Session Mode = Custom and set your preferred daily reset time (e.g., 0000-2359 UTC).
## Credits & Transparency
### Development
This indicator was developed with the assistance of AI technology to implement complex ORB trading logic.
The strategy concept, feature specifications, and trading logic were designed by the publisher. The implementation leverages modern development tools to ensure:
Clean, efficient, and maintainable code
Comprehensive error handling and input validation
Detailed documentation and user guidance
Performance optimization
### Trading Concepts
This indicator implements several public domain trading concepts:
Opening Range Breakout (ORB): Trading strategy popularized by Toby Crabel, Mark Fisher and many more talanted traders.
Fair Value Gap (FVG): Price imbalance concept from ICT methodology
SuperTrend: ATR-based trend indicator using public formula
Risk/Reward Ratio: Standard risk management principle
All mathematical formulas and technical concepts used are in the public domain.
### Pine Script
Uses standard TradingView built-in functions:
ta.ema(), ta.atr(), ta.vwap(), ta.highest(), ta.lowest(), request.security()
No external libraries or proprietary code from other authors.
## Disclaimer
This indicator is provided for educational and informational purposes only. It is not financial advice.
Trading involves substantial risk of loss and is not suitable for every investor. Past performance shown in examples is not indicative of future results.
The indicator provides signals and calculations, but trading decisions are solely your responsibility. Always:
Test strategies on paper before using real money
Never risk more than you can afford to lose
Understand that all trading involves risk
Consider seeking advice from a licensed financial advisor
The publisher makes no guarantees regarding accuracy, profitability, or performance. Use at your own risk.
---
Version: 3.0
Pine Script Version: v6
Last Updated: October 2024
For support, questions, or suggestions, please comment below or send a private message.
---
Happy trading, and remember: consistent risk management beats perfect entry timing every time.

BORB 5m 15m IB5m and 15m OR indicator with 100% extensions for each.
Also has Initial Balance with 50% extensions.
NY session.


Opening Range + Daily LevelsA comprehensive multi-timeframe indicator designed for intraday traders who need critical support/resistance levels and EMAs all in one clean display.
Features:
📊 EMAs
9 EMA (default: white)
21 EMA (default: orange)
📅 Previous Day Levels
Yesterday's High, Low, Open, and Close
Lines extend progressively through the current session
Clean visual separation between trading days
📈 Previous Week Levels
Last Week's High, Low, Open, and Close
Dotted lines that extend through the current week
Perfect for identifying major support/resistance zones
🌙 Pre-Market Session (12:00 AM - 7:30 AM)
Pre-Market High and Low
Tracks overnight price action
Extends through the trading day
⏰ 15-Minute Opening Range (7:30 AM - 7:45 AM)
Opening Range High and Low with shaded box
Fibonacci retracement levels (0.382, 0.5, 0.618)
Golden ratio levels (0.382 & 0.618) in gold, midpoint (0.5) in dotted gray
Customization:
Adjustable timezone settings
Fully customizable colors for all levels
Adjustable line widths
Toggle Fibonacci levels on/off
Perfect For:
Day traders who need key levels at a glance
Price action traders using previous session data
Opening range breakout strategies
Multi-timeframe analysis
All levels update automatically and extend progressively as the day progresses, with labels staying visible at the current bar edge.

The Wave Levels (ORB Indicator)This Indicator is made for the ORB trader. It's purpose is to help make your charting faster by providing some basic key levels to reference at a glance. This was optimized to be used on the 5m timeframe.
Key features:
1. Green and Red ORB rays to indicate the 15 minute Opening Range. These ranges will only extend as long as its respective session's length.
2. Previous sessions zones for historical easily identification of historical data (best used in UTC-4 timezone)
3. White Liquidity Rays. These rays are used to mark a previous session's high or low which hasn't been swept yet. This makes for a good TP area or identifying a potential reversal area.
Once a previous session high or low has been taken, the ray will automatically remove.
I am not a professional coder. This indicator was created by continuously prompting AI commands over the course of 3 days.

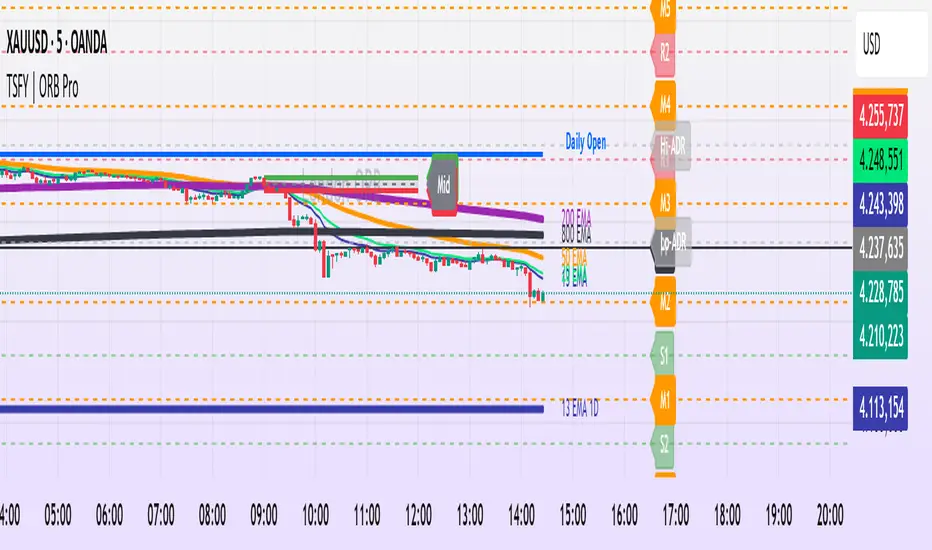
Tradisfy | TSFY | ORB Pro**TSFY | ORB Pro**
Introduction
TSFY | ORB Pro combines the classic Opening Range Breakout (ORB) logic with professional market structure tools such as EMAs, the Daily Open, ADR, and Pivot Points.
The goal: A clean and logically structured intraday visualization of volatility, trend, and key price zones — without visual clutter.
Timezone: Europe/Berlin
---
Core Features
Multi-Session ORB: Separate Opening Ranges for London, Gold, and New York sessions with ORH, ORL, and Mid levels, optionally extendable to the end of the trading day.
EMAs (Intraday & Daily): Adaptive trend filters from 4 to 800 periods plus Daily 13/50/200 EMAs for higher-timeframe structure context.
Classic Pivots: Automatic calculation of daily PP, R, S, and Mid levels with fully customizable colors, styles, and extensions.
Daily Open: Marks the daily opening price as a bias reference point.
ADR (Average Daily Range): Calculates the average true range of the last X days, optionally anchored to the Daily Open with an optional 50% midpoint.
---
Interpretation
Break above ORH → bullish momentum; break below ORL → bearish weakness.
Combine ORB zones with EMAs, Pivots, or ADR for higher confluence.
Daily Open provides intraday bias, ADR defines realistic target zones.
Reactions around R/S levels or OR Mid often indicate short-term turning points.
---
Usage
Use the ORB zone as the basis for breakout, retest, or mean-reversion setups.
Plan realistic take-profit zones using ADR and Pivot levels.
Daily EMAs define the overall market bias.
All components can be toggled on or off individually.
---
Notes
Optimized for intraday ORB trading.
No alerts integrated (yet).
All colors, line widths, and transparency levels are fully customizable.
Non-repainting — lines are extended forward, not redrawn.
Performance-friendly despite multiple visual components (max. 500 lines/labels).
---
TSFY | ORB Pro is a complete framework for modern intraday traders who want to combine session logic, trend filters, and market structure into one clean and efficient tool.
ORBs, EMAs, SMAs, AVWAPThis is an update to a previously published script. In short the difference is the added capability to adjust the length of EMAs. Also added 3 customizable SMAs. Enjoy! Let me know what you think of the script please. This is only second one I have ever done. Through practice and people like @LuxAlgo and other Pinescripters this isn't possible. Tedious hrs with ChatGPT to correct nuances, who doesnt seem to learn from (insert pronoun) mistakes
This all-in-one indicator combines key institutional tools into a unified framework for intraday and swing trading. Designed for traders who use multi-session analysis and dynamic levels, it automatically maps out global session breakouts, moving averages, and volume-weighted anchors with high clarity.
Features include:
🕓 Tokyo, London, and New York ORBs (Opening Range Breakouts) — 30-minute configurable range boxes that persist until the next New York open.
📈 Anchored VWAP with Standard Deviation Bands — dynamically anchorable to session, week, or month for institutional-grade price tracking.
📊 Exponential Moving Averages (9, 20, 113, 200) — for short-, mid-, and long-term momentum structure.
📉 Simple Moving Averages (20, 50, 100) — fully customizable lengths, colors, and visibility toggles for trend confirmation.
🏁 Prior High/Low Levels (PDH/PDL, PWH/PWL, PMH/PML) — automatically plotted from previous day, week, and month, with labels placed at each session’s midpoint.
🎛️ Session-Aligned Time Logic — all time calculations use New York session anchors with DST awareness.
💡 Clean Visualization Options — every component can be toggled on/off, recolored, or customized for your workflow.
Best used for:
ORB break-and-retest setups
VWAP and EMA rejections
Confluence-based trading around key session levels
Multi-session momentum tracking

ORBs, EMAs, AVWAPThis Pine Script (version 6) is a multi-session trading indicator that combines Opening Range Breakouts (ORBs), Exponential Moving Averages (EMAs), and an Anchored VWAP (AVWAP) system — all in one overlay script for TradingView.
Here’s a clear breakdown of its structure and functionality:
🕒 1. Session Logic and ORB Calculation
Purpose: Identify and plot the high and low of the first 30 minutes (default) for the Tokyo, London, and New York trading sessions.
Session Anchors (NY time):
Tokyo → 20:00
London → 03:00
New York → 09:30
(All configurable in inputs.)
ORB Duration: Default is 30 minutes (orbDurationMin), also user-configurable.
Resets:
London and NY ORBs reset at the start of each new New York trading day (17:00 NY time).
Tokyo ORB resets independently using a stored timestamp.
Process:
For each session:
While the time is within the ORB window, the script captures the session’s high and low.
Once the window closes, those levels remain plotted until reset.
Plot Colors:
Tokyo → Yellow (#fecc02)
London → Gray (#8c9a9c)
New York → Magenta (#ff00c8)
These form visible horizontal lines marking the prior session ranges — useful for breakout or retest trading setups.
📈 2. EMA System
Purpose: Provide trend and dynamic support/resistance guidance.
It calculates and plots four EMAs:
EMA Period Color Purpose
EMA 9 Short-term Green Fast signal
EMA 20 Short-term Red Confirms direction
EMA 113 Medium Aqua Trend filter
EMA 200 Long-term Orange Macro trend baseline
Each EMA is plotted directly on the price chart for visual confluence with ORB and VWAP levels.
⚖️ 3. Anchored VWAP (AVWAP)
Purpose: Display a volume-weighted average price anchored to specific timeframes or events, optionally with dynamic deviation or percentage bands.
Features:
Anchor Options:
Time-based: Session, Week, Month, Quarter, Year, Decade, Century
Event-based: Earnings, Dividends, Splits
VWAP resets when the chosen anchor condition is met (e.g., new month, new earnings event, etc.).
Bands:
Up to three levels of symmetric upper/lower bands.
Choose between Standard Deviation or Percentage-based widths.
Display Toggles:
Each band’s visibility is optional.
VWAP can be hidden on 1D+ timeframes (hideonDWM option).
Color Scheme:
VWAP: Fuchsia (magenta-pink) line
Bands: Green / Olive / Teal with light-filled zones
⚙️ 4. Technical Highlights
Uses ta.vwap() with built-in band calculations.
Handles instruments with or without volume (errors if missing volume).
Uses time-zone aware timestamps (timestamp(NY_TZ, …)).
Uses timeframe.change() to detect new anchors for the VWAP.
Employs persistent variables (var) to maintain session state across bars.
💡 In Practice
This indicator is designed for multi-session intraday traders who:
Trade Tokyo, London, or NY open breakouts or retests.
Use EMA stacking and crossovers for trend confirmation.
Use Anchored VWAP as a fair-value or mean-reversion reference.
Need clear visual structure across different market sessions.
It provides strong session separation, trend context, and volume-weighted price reference — making it ideal for discretionary or semi-systematic trading strategies focused on liquidity zones and session momentum.

BTS_ORB_V1.0Description
This indicator displays Opening Range Breakouts (ORB) based on a fully customizable time window — for example, 15, 30, or 60 minutes after the market open.
All parameters can be adjusted: start time, end time, range display, and chart visualization.
Additionally, alerts can be triggered on closed candles, both for breakouts above and below the defined range.
Perfect for traders who rely on precise breakout signals after the opening phase and want to automate their strategies with smart alerts.
With this ORB indicator you can:
• Customize the opening range window
• Set automatic breakout alerts on candle close
• Test different timeframes (e.g. 15 min / 60 min / custom)
• Visualize clean long and short breakout zones
ADR% / CDR% Range Analyzer - PajameinThe "ADR%/CDR% Range Analyzer" is a versatile TradingView indicator designed for traders who want to monitor and compare the "Average Daily Range (ADR%)" and "Current Daily Range (CDR%)" in real-time. ADR% represents the average percentage range (high-low relative to low) over a user-defined number of daily bars, helping you gauge a stock's typical volatility. CDR% shows the current session's range as a percentage, either intraday (customizable from start to end price) or full daily, allowing you to assess how the current bar's movement stacks up against historical norms.
Key features include:
- "Visual Comparison": Displays both values as clean labels on the chart with customizable positions (separate or combined).
- "Dynamic Background Coloring": CDR% label background changes color based on its relation to ADR%—light green for low volatility (< low threshold), light blue for neutral (between thresholds), and light red for high volatility (> high threshold). This helps quickly spot expansion or contraction in daily moves.
- "Flexibility": Works on any timeframe, with options for intraday customization and anti-clipping adjustments for multi-pane layouts.
This indicator is ideal for day traders, swing traders, or anyone tracking volatility breakouts, range-bound setups, or risk management based on expected daily moves.
Input Settings Guide
Here's a breakdown of each setting and how it enhances your trading workflow:
- "Show ADR%" (Boolean, default: true)
Toggle to display/hide the ADR% label. Use this to declutter your chart when focusing solely on current range.
- "Show CDR%" (Boolean, default: true)
Toggle to display/hide the CDR% label. Ideal for charts where you only need historical average or current metrics.
- "ADR% Length" (Integer, default: 20, min: 1)
Number of daily bars for averaging the range percentage. Shorter lengths (e.g., 10) for recent volatility; longer (e.g., 50) for broader trends.
- "CDR%: Start" (Source, default: low)
Starting price for intraday CDR% (e.g., open, previous close). Customize for specific range measurements like gap fills.
- "CDR%: End" (Source, default: high)
Ending price for intraday CDR% (e.g., low, close). Pair with Start for targeted ranges, like open-to-low for downside capture.
- "Intraday Display" (String dropdown: "Intraday CDR%", "Daily CDR%", default: "Daily CDR%")
Switch between real-time intraday calculation (dynamic updates) or fixed daily value (stable, non-repainting).
- "Low Threshold %" (Float, default: 40.0, range: 0-100)
Percentage of ADR% below which CDR% gets the low (green) background. Lower it (e.g., 30%) for stricter low-volatility alerts.
- "High Threshold %" (Float, default: 60.0, range: 0-100)
Percentage of ADR% above which CDR% gets the high (red) background. Raise it (e.g., 70%) to highlight only extreme expansions.
- "ADR% Text Color" (Color picker, default: black)
Foreground color for ADR% text. Choose contrasting colors for dark/light themes.
- "CDR% Text Color" (Color picker, default: black)
Foreground color for CDR% text. Ensures readability over dynamic backgrounds.
- "Low CDR% Background (below low threshold)" (Color picker, default: light green with 70% transparency)
Background for subdued ranges. Adjust opacity for subtlety.
- "Mid CDR% Background (between thresholds)" (Color picker, default: light blue with 70% transparency)
Neutral background for typical moves.
- "High CDR% Background (above high threshold)" (Color picker, default: light red with 70% transparency)
Alert-style background for breakouts.
- "Cell Height %" (Integer, default: 8, range: 1-20)
Vertical padding for labels as a percentage of chart height. Increase (e.g., 12) in multi-pane layouts to prevent text clipping; decrease for compact views.
- "ADR% Position" (String dropdown: Top/Bottom/Middle Left/Right/Center, default: Bottom Right)
Placement of ADR% label. Use separate positions for side-by-side comparison.
- "CDR% Position" (String dropdown: Top/Bottom/Middle Left/Right/Center, default: Bottom Right)
Placement of CDR% label. Matching positions auto-stacks them vertically.
- "Text Size" (String dropdown: Tiny/Small/Normal/Large, default: Normal)
Font size for labels. "Small" for dense charts; "Normal" for clarity.
Usage Tips
- "Volatility Trading": Set thresholds to 50%/80% for spotting range expansions during news events.
- "Multi-Timeframe": Apply on 5-min charts with daily ADR for intraday targets (e.g., aim for 80% of ADR).
- "Customization": For forex/crypto, tweak Start/End to session opens. Test in replay mode to verify non-repainting.
- "Limitations": Intraday mode updates live but may not repaint until bar close; daily mode is fixed.

ORB + Prev Close — [GlutenFreeCrypto]Draws a red line at the high of the first 5 min candle, draws a green line at the bottom of the first 5 min candle, draws a grey line at midpoint. Lines extend until market close (4pm) or after-hours 98pm) or extend the next day pre-market (until 9:30am). Closing blue dotted line is drawn at closing price, and extends in after-hours and pre-market.
Dizzy HOLO🚀 Dizzy HOLO is an all-in-one professional trading suite designed for serious traders.
It combines Pivot Points, Opening Range Breakout (ORB), HOLO (High of Low / Low of High), Weekly Levels, SMA Thresholds, and Real-Time Alerts into a single lightweight indicator.
🔑 Key Features:
✅ Pivot Points (Fibonacci & Camarilla) – Automatic support & resistance with labels.
✅ Opening Range Breakout (ORB) – Custom session ORB with historical data and breakout alerts.
✅ HOLO Strategy – Daily High/Low, Highest H1 Open, Lowest H1 Close with dynamic buy/sell zones.
✅ Weekly Levels – Previous Week High/Low/Open/Close with extended dotted projections.
✅ SMA Threshold Zones – Dynamic SMA with gray zone filter and trend-based candle coloring.
✅ Multi-Timeframe Analysis – Auto-switching pivots & real-time confirmation.
✅ Smart Alerts – Pivot breakouts, ORB levels, HOLO crosses, and Weekly breaks.
🎯 Why Use Dizzy HOLO?
This indicator is built for breakout, reversal, and trend traders. It provides clear market structure, liquidity zones, and actionable alerts so you never miss important setups.
🛠️ Best Suited For:
Intraday scalpers
Swing traders
Breakout traders
HOLO strategy followers
Multi-timeframe traders

ORB + Session VWAP Pro (London & NY) — fixedORB + Session VWAP Pro (London & NY) — Listing copy (EN)
What it is
A clean, non-repainting intraday tool that fuses the classic Opening Range Breakout (ORB) with a session-anchored VWAP filter for London and New York. It highlights only the higher-quality breakouts (above/below session VWAP), adds an optional retest confirmation, and scores each signal with an intuitive Confidence metric (0–100).
Why it works
• ORB provides the day’s first actionable structure (range high/low).
• Session VWAP filters “cheap” breaks and favors flows aligned with session value.
• Optional retest reduces first-tick whipsaws.
• Confidence blends breakout depth (vs ATR), VWAP slope and band distance.
Key visuals
• LDN/NY OR High/Low (line break style) + optional OR boxes.
• Active Session VWAP (resets per signal window; falls back to daily VWAP outside).
• Optional VWAP bands (stdev or %).
• Session shading (London/NY windows).
• Signal markers (LDN BUY/SELL, NY BUY/SELL) fired with cooldown.
Signals
• London Long / Short: Break of LDN OR High/Low ± ATR buffer, aligned with VWAP side.
• NY Long / Short: Same logic during NY window.
• Retest (optional): Requires a tag back to the OR level ± tolerance before confirmation.
• Confidence: 0–100; gate via Min Confidence (default 55).
Inputs that matter
• Open Range Length (min): Default 15.
• London/NY times & timezones.
• ATR buffer & retest tolerance.
• Bands mode: Stdev (with lookback) or % (e.g., 1%).
• Signal cooldown: Avoids clutter on fast moves.
Non-repaint policy
• OR lines build within fixed time windows using the current bar’s timestamp.
• VWAP is cumulative within the session window; no lookahead.
• All ta.crossover/ta.crossunder are precomputed every bar (no conditional execution).
• Signals are based on live bar values, not future bars.
⸻
Quick start (examples)
1) EURUSD, London momentum
• Chart: 5m or 15m.
• OR: 15 min starting 08:00 Europe/London.
• Signals: Use defaults; keep ATR buffer = 0.2 and Retest = ON, Min Confidence ≥ 55.
• Play:
• BUY when price breaks LDN OR High + buffer and stays above VWAP; retest confirms.
• Trail behind VWAP or band #1; partials into band #2.
2) NAS100, New York breakout & run
• Chart: 5m.
• NY window: 09:30 America/New_York, OR = 15 min.
• Retest OFF on high momentum days; Min Confidence ≥ 60.
• Use band mode Stdev, bandLen=50, show ±1/±2.
• Momentum continuation: add on pullbacks that hold above VWAP after the breakout.
3) XAUUSD, London fake & VWAP fade
• Chart: 5m.
• Keep Retest ON; accept only shorts that break OR Low but retest fails back under VWAP.
• Confidence gate ≥ 50 to allow more mean-reversion setups.
⸻
Pro tips
• Adjust ATR buffer to the instrument: FX 0.15–0.25, indices 0.20–0.35, metals 0.20–0.30.
• Retest ON for choppy conditions; OFF for news momentum.
• Use VWAP bands: take partials at ±1; stretch targets at ±2/±3.
• Session timezones are explicit (London/New York). Ensure they match your instrument’s behavior.
• Pair with a higher-TF bias (e.g., 1H/4H trend) for directional filtering.
⸻
Alerts (ready to use)
• ORB+SVWAP — LDN Long, LDN Short, NY Long, NY Short
(Respect your cooldown; alerts fire only after confirmation and confidence gate.)
⸻
Known limits & notes
• Designed for intraday. On 1D+ charts, session windows compress.
• If your broker session differs from London/NY clocks on a holiday, adjust input times.
• Session-anchored VWAP uses the script’s signal window, not exchange sessions, by design.

ORB + Volume FilterI created this for testing purposes only. If this script works as expected I will add a better description.

eORB - Day EditionThe eORB – Day Edition (Enhanced Opening Range Breakout) is a powerful intraday trading indicator designed for Algo Trading, Scalpers, Day Traders, and ORB-based strategies. It combines classic ORB logic with advanced filters, multiple exit strategies, and smart risk management tools. The default setup is optimised for a 3-minute ETHUSD chart.
Key Features:-
# Opening Range Breakout (ORB)
- Defines intraday high/low for the first X minutes.
- Automatically updates breakout levels.
- Optional buffer (%) for precision entries.
# Day & Session Filters
- Enable/disable trading on specific weekdays.
- Flexible session time configuration.
# EMA Crossover
- Option to trade based on EMA crossover with ORB levels.
# Breakout Candle Logic
- Detects breakout candle high/low for secondary confirmation.
# RSI Filter
- Confirms signals using RSI thresholds (customisable).
# Exit Strategies
- ORB High/Low Exit
- Buffer Exit
- Trailing Stop Loss (TSL) with activation, lock, and increments
- Target & Stoploss (fixed points)
- Universal Exit (UTC time-based) with background highlight
# Trade Sync Logic
- Prevents consecutive Buy → Buy or Sell → Sell without the opposite signal in between.
# Alerts Ready
- Buy, Sell, and Exit conditions are available for alerts.
- Compatible with TradingView alert system (popup, email, SMS, webhook).
How to Use:-
1. Add indicator to the chart.
2. Set ORB Time & Session (e.g., 3 min ORB at market open).
3. Enable/disable filters (EMA, RSI, Breakout candle).
4. Configure exits (TSL, Target, Stoploss, Universal Exit).
5. Add alerts for automation or notifications.
- This indicator is ideal for Crypto, Nifty, BankNifty, Index Futures, and Stocks, but it can be applied to any asset.
- The default settings are optimised for ETHUSD.
How it Works – eORB Day Edition:-
Step 1 – Define the Range
- At market open, the indicator records the Opening Range High & Low for the first X minutes (configurable by the user).
- This creates a price boundary (box) that acts as support and resistance for the rest of the session.
- Optional buffers can be added to make signals more reliable.
Step 2 – Generate the Signal
- When price (or EMA, if enabled) crosses above the Opening Range High, a Buy signal is generated.
- When price (or EMA) crosses below the Opening Range Low, a Sell signal is generated.
- Extra filters like RSI and Breakout Candle confirmation can be turned on to reduce false breakouts.
- Built-in sync logic ensures signals alternate properly (no double Buy or double Sell without the opposite in between).
Step 3 – Manage the Exit
- Trades can exit using multiple methods:
- Target (fixed profit in points)
- Stoploss (fixed risk in points)
- Trailing Stop-loss (TSL) that locks profit and trails as price moves further in your favour
- ORB/Buffer exit when price re-enters the range
- Universal Exit at a fixed UTC time to close all positions for the day
- Exits are visualised on the chart with shapes, labels, and optional background highlights.
In simple terms:-
Step 1: DEFINE
- Opening Range (first X minutes) → Marks High & Low → Creates breakout zone
Step 2: SIGNAL
- Price / EMA crosses High (+ Buffer) → BUY
- Price / EMA crosses Low (- Buffer) → SELL
- + Optional filters: RSI, Breakout Candle
Step 3: EXIT
- Target | Stoploss | Trailing Stoploss | Universal Exit
Important Note on Alert Setup
- When using the RSI filter, signals may fluctuate in some edge cases where RSI hovers near the Buy or Sell level.
- To avoid this, it is recommended to use “Once Per Bar Close” as the alert trigger, since signals confirm only after the bar closes (especially helpful when Breakout Candle High/Low Crossover is enabled).
- If you choose not to use RSI, you can safely use “Once Per Bar” alerts, even when the Breakout Candle High/Low Crossover option is enabled.
Disclaimer:-
- This tool is for educational and research purposes only.
- It does not guarantee profits. Always backtest and use proper risk management before live trading. The author is not responsible for financial losses.
Developer: @ikunalsingh
Built using AI + the best of human logic.
TradeX ORB SniperTradeX ORB Sniper — Multi-Range Opening Breakout Framework
This invite-only script is a structured Opening Range Breakout (ORB) tool designed to map price interaction with multiple predefined ranges. It is not a collection of generic settings — all versions and filters are coded in-house and connected through a shared logic engine.
Purpose & Core Design
The ORB Sniper provides four internally coded modes, each referencing a distinct opening range. Depending on market context, ranges may include:
Pre-market session range
5-minute opening range
15-minute opening range
Volume-adaptive range variations
Each mode ensures consistent logic across timeframes, allowing traders to analyze breakout dynamics in a rule-based framework.
Breakout Highlighting
When price closes above or below the active range, the script highlights that candle in gold/yellow (“Get Ready Candle”). This highlight is informational only, serving as a visual marker of when price has left the defined range.
Zone Projection & Box Mapping
To help visualize breakout dynamics, the script plots risk and reward boxes:
Risk Box — initial region mapped from the selected range
Reward Box — projected continuation area based on range displacement
These elements are configurable, giving traders flexibility in how the breakout context is displayed.
Custom Visual Inputs
Users can adjust all visual components directly from the settings panel:
ORB Mode — toggle between V1–V4 range types
Risk Box Color — customize the risk region’s display
Reward Box Color — adjust continuation box visuals
Get Ready Candle Color — select the breakout candle highlight color
Inputs in Status Line — optional summary display at the top of the chart
This ensures the framework is adaptable to any chart theme or personal preference.
Development Process
The ORB Sniper was first modeled in Python, where volume, volatility, and technical variations were looped through to refine range definitions. The most effective rules were then coded into Pine Script, creating a streamlined, repeatable breakout framework.
Disclaimer
This is an original, closed-source TradeX Labs tool. It references known concepts (opening ranges, volume dynamics) within a proprietary rule-based framework. It is intended for visual analysis only and does not provide trade signals or guarantee results. Default settings are for illustration; traders should adjust configuration to their instrument and timeframe.

ORB Breakouts with alerts"ORB Breakouts with Alerts" is a utility indicator that highlights an Opening Range Breakout (ORB) setup during a user-defined intraday time window. It allows traders to visualize price consolidation ranges and receive alerts when price breaks above or below the session high/low.
🔧 Features:
*Customizable session time (start and end), adjustable to local time using a timezone offset.
*Automatically plots:
*A shaded box around the session's high and low.
*Horizontal lines at session high and low levels.
*Optional "BUY"/"SELL" labels to mark breakout directions.
*Visual breakout signals when price crosses above or below the session range.
*Built-in alerts to notify when breakouts occur.
*Configurable styling options including box color, highlight color, and label placement.
⚙️ How It Works:
*During the defined time range, the script tracks the highest high and lowest low.
*After the session ends:
*A box is drawn to represent the opening range.
*Breakouts above the high or below the low trigger visual markers and optional alerts.
*Alerts are limited to one per direction per day to reduce noise.
⚠️ This indicator is a technical analysis tool only and does not provide financial advice or trade recommendations. Always use with proper risk management and in conjunction with your trading plan.

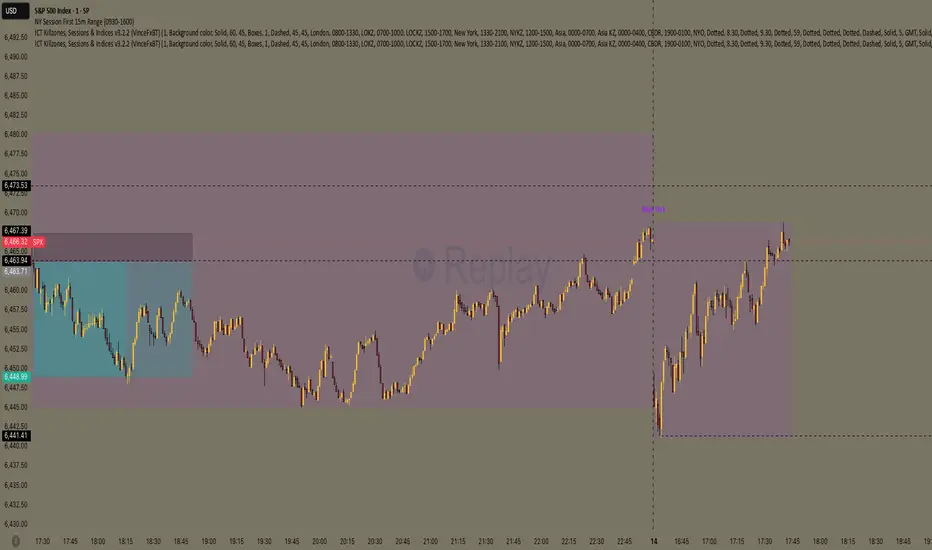
NY Session First 15m Range ORB Strategy first 15m high&low NY session
let you know the high and low of first 15m and the first candle is sitck out of the line you can ride on the wave to make moeny no bul OANDA:XAUUSD SP:SPX