Support & Resistance Zone Hunter [BOSWaves]Support & Resistance Zone Hunter - Dynamic Structural Zones with Real-Time Breakout Intelligence
Overview
The Support & Resistance Zone Hunter is a professional-grade structural mapping framework designed to automatically detect high-probability support and resistance areas in real time. Unlike traditional static levels or manually drawn zones, this system leverages pivot detection, range thresholds, and optional volume validation to create dynamic zones that reflect the true structural architecture of the market.
Zones evolve as price interacts with their boundaries. The first touch of a zone determines its bias - bullish, bearish, or neutral - and the system tracks the full lifecycle of each zone from formation, testing, and bias establishment to potential breakout events. Diamond-shaped breakout signals highlight structurally significant price expansions while filtering noise using a configurable cooldown period.
By visualizing market structure in this way, traders gain a deeper understanding of price behavior, trend momentum, and areas where liquidity and reactive forces are concentrated.
Theoretical Foundation
The Support & Resistance Zone Hunter is built on the premise that meaningful structural zones arise from two core principles:
Pivot-Based Turning Points : Only significant highs and lows that represent actual swings in price are considered.
Contextual Validation : Zones must pass minimum range criteria and optional volume thresholds to ensure their relevance.
Markets naturally generate numerous micro-pivots that do not carry predictive significance. By filtering out minor swings and validating zones against volume and range, the system isolates levels that are more likely to attract future price interaction or act as catalysts for breakout moves.
This framework captures not only where price is likely to react but also the direction of potential pressure, providing a statistically grounded, visually intuitive representation of market structure.
How It Works
The Support & Resistance Zone Hunter constructs zones through a multi-layered process that blends pivot logic, range validation, and real-time bias determination:
1. Pivot Detection Core
The indicator identifies pivot highs and pivot lows using a configurable lookback period. Zones are only considered valid when both a top and bottom pivot are present.
2. Zone Qualification Engine
Prospective zones must satisfy two conditions:
Range Threshold : The distance between pivot high and low must exceed the minimum percentage set by the user.
Volume Requirement : If enabled, the current volume must exceed the 50-period moving average.
Only zones meeting these criteria are drawn, reducing noise and emphasizing high-probability structural levels.
3. Zone Lifecycle
Once a valid top and bottom pivot exist:
The zone is created starting from the pivot formation bar.
Zones remain active until both boundaries have been touched by price.
The first boundary touched establishes bias: resistance first → bullish bias ,support first → bearish bias, neither → neutral.
Inactive zones stop expanding but remain visible historically to maintain a clear structural context.
4. Visual Rendering
Active zones are displayed as filled boxes with color corresponding to their bias. Top, bottom, and midpoint lines are drawn for reference. Once a zone becomes inactive, its lines are removed while the filled box remains as a historical footprint.
5. Breakout Detection
Breakout signals occur when price closes above the top boundary or below the bottom boundary of an active zone. The system applies a cooldown period and requires price to return to the zone since the previous breakout to prevent signal spam. Bullish and bearish breakouts are visually represented by diamond-shaped markers with configurable colors.
Interpretation
The Support & Resistance Zone Hunter provides a structural view of market balance:
Bullish Zones : Form when resistance is tested first, indicating upward pressure and potential continuation.
Bearish Zones : Form when support is tested first, reflecting downward pressure and continuation risk.
Neutral Zones : Fresh zones that have not yet been interacted with, representing undiscovered liquidity.
Breakout Diamonds : Highlight significant structural price expansions, helping traders identify confirmed continuation moves while filtering noise.
Zones do not simply indicate past levels; they dynamically reflect the evolving battle between buyers and sellers, providing actionable context for both trend continuation and reversion strategies.
Strategy Integration
The Support & Resistance Zone Hunter is versatile and can be applied across multiple trading approaches:
Trend Continuation : Use bullish and bearish zones to confirm directional bias. Breakout diamonds indicate structural continuation opportunities.
Reversion Entries : Neutral zones often act as magnets in ranging markets, allowing for high-probability mean-reversion setups.
Breakout Trading : Diamonds mark true structural expansions, reducing false breakout risk and guiding stop placement or momentum entries.
Liquidity Zone Alignment : Combining the indicator with order block, breaker, or volume-based tools helps validate zones against broader market participation.
Technical Implementation Details
Pivot Engine : Two-sided pivot detection based on configurable lookback.
Zone Qualification : Minimum range requirement and optional volume filter.
Bias Logic : Determined by the first boundary touched.
Zone Lifecycle : Active until both boundaries are touched, historical visibility retained.
Breakout Signals : Diamond markers with cooldown filtering and price-return validation.
Visuals : Transparent filled zones with live top, bottom, and midpoint lines.
Suggested Optimal Parameters
Pivot Lookback : 10 - 30 for intraday, 20 - 50 for swing trading.
Minimum Range % : 0.5 - 2% for crypto or indices, 1 - 3% for metals or forex.
Volume Filter : Enable for assets with inconsistent liquidity; disable for consistently liquid markets.
Breakout Cooldown : 5 - 20 bars depending on volatility.
These suggested parameters should be used as a baseline; their effectiveness depends on the asset and timeframe, so fine-tuning is expected for optimal performance.
Performance Characteristics
High Effectiveness:
Markets with clear pivot structure and reliable volume.
Trending symbols with consistent retests.
Assets where zones attract repeated price interaction.
Reduced Effectiveness:
Random walk markets lacking structural pivots.
Low-volatility periods with minimal price reaction.
Assets with irregular volume distribution or erratic price action.
Integration Guidelines
Use zone color as contextual bias rather than a standalone signal.
Combine with structural tools, order blocks, or volume-based indicators for confluence.
Validate zones on higher timeframes to refine lower timeframe entries.
Treat breakout diamonds as confirmation of continuation rather than independent triggers.
Disclaimer
The Support & Resistance Zone Hunter provides structural zone mapping and breakout analytics. It does not predict price movement or guarantee profitability. Success requires disciplined risk management, proper parameter calibration, and integration into a comprehensive trading strategy.
Pivotpointbreak

Reward-Risk Visual Zones (RRZ)Reward–Risk Visual Zones (RRZ) – Structure-Driven Risk Mapping Engine
Most indicators tell you when to trade.
RRZ is designed to answer a different question:
“Is this setup worth the risk before I take the trade?”
RRZ is not a mashup of unrelated indicators.
It is a 3-stage risk engine that builds a complete trade “story” around each swing:
1. Market structure pivot → defines the trade idea
2. ATR volatility unit → defines the risk size
3. Projected reward → compares reward vs that risk and filters bad setups
The output is a visual trade map : entry, target, stop, and R:R, printed directly on chart at each qualified swing.
1. Market Structure Layer – Where trades are anchored
RRZ doesn’t fire signals from MA/RSI crossovers.
It begins with s wing structure :
• Uses ta.pivotlow() and ta.pivothigh() with user-controlled left/right sensitivity:
• Pivot Sensitivity (L) controls how wide a swing must be to qualify as a structural pivot.
• Pivot Confirmation (R) controls how fast/slow a pivot is confirmed (1 = almost real-time, larger values = safer but later).
• A confirmed swing low becomes the candidate anchor for a long R:R zone.
• A confirmed swing high becomes the candidate anchor for a short R:R zone.
Each pivot is stored with its exact price and bar index , so the rest of the logic is always anchored to a real swing instead of a random candle.
2. Volatility Layer – Turning ATR into a “risk unit”
Once a pivot is confirmed, RRZ measures local volatility using ATR:
• ATR length is configurable via ATR Length.
• ATR is not used as a trailing stop or overlay.
In RRZ it plays one specific role:
“One ATR = one unit of structural risk from this swing.”
From that:
Long scenario:
• Entry = pivot low
• Stop = Entry − 1 × ATR
Short scenario:
• Entry = pivot high
• Stop = Entry + 1 × ATR
This standardizes risk across different volatility regimes:
a 2R move in a quiet market and a 2R move in a volatile market are both “2 × ATR” from the structure.
3. Reward Projection Layer – Evaluating if the trade is worth it
RRZ then estimates how far price can realistically travel away from the pivot, given recent behaviour:
For longs (from swing low):
• Projects reward using the highest high in a rolling lookahead window (e.g., last 20 bars).
• Reward = HighestHigh – PivotLow
• Risk = ATR
• R:R = Reward / ATR
For shorts (from swing high):
• Projects reward using the lowest low in the window.
• Reward = PivotHigh – LowestLow
• Risk = ATR
• R:R = Reward / ATR
The user can set a minimum R:R filter via Min R:R Threshold.
• If R:R ≥ threshold → zone is tagged as “ GOOD R:R ” and highlighted in green (long) or red (short).
• If R:R < threshold → optionally still shown as “ LOW R:R ” in orange (so you can visually see “tempting but not worth it” trades).
This transforms a raw pivot + ATR into a quantified decision:
“From this swing, volatility says my stop is 1× ATR. Do I even have 2× ATR of room in my favour?”
4. Execution Map – How components work together on chart
Instead of just printing numbers, RRZ builds a full execution template for every qualifying swing:
• Entry line at the pivot price
• Target line at the reward projection price
• Stop line at pivot ± ATR
• A structured label including:
• LONG / SHORT direction
• “GOOD R:R” or “LOW R:R”
• Numerical R:R (e.g., 2.3 : 1)
• Entry, Target, Stop, current Close
A Cooldown Bars parameter prevents overlapping spam:
• After an R:R zone is created (long or short), the script waits X bars before considering another zone in the same direction.
• This keeps charts readable and focuses attention on the most recent high-quality swings.
RRZ also includes line style controls (solid/dashed/dotted) and separate colours for entry, target, and stop, so traders can quickly read the chart even without opening settings.
5. How to Use RRZ in a Trading Plan
RRZ is not a magic “buy/sell” button.
It is designed to sit on top of your existing strategy as a risk filter.
Typical workflows:
SMC / price-action traders:
• Use your own logic for BOS/CHoCH, order blocks, or liquidity sweeps.
• Use RRZ only where structure aligns and the zone shows GOOD R:R ≥ 2.0.
• Avoid setups where RRZ marks LOW R:R even if the pattern looks good.
System traders / swing traders:
• Use RRZ to standardize risk across assets and timeframes.
• Filter out trades where potential reward does not justify the stop, based on current ATR.
Beginners:
• Learn to stop taking trades where the target is too close and the stop is too wide.
• Visually understand how structural swings and volatility interact.
RRZ works across Forex, Crypto, Indices, and Stocks on intraday and higher timeframes.
Once a pivot is confirmed and a zone is plotted, its lines and labels do not repaint.
⸻
6. Why this invite-only script is more than a basic mashup
RRZ does use classic building blocks (pivots, ATR), but the value is in the way they are stitched into a single risk framework:
• It doesn’t run multiple separate indicators on chart.
Everything is computed inside one engine with a single purpose: structure-based R:R evaluation.
• ATR is not just “slapped on” as a stop line; it is treated as the core risk unit in the R:R calculation pipeline.
• Every zone is a coherent trade idea: from swing, to risk unit, to projected reward, to filtered label, to execution lines.
• The script is designed specifically to help traders do the one thing that almost no free indicator prioritizes:
“Say NO to low R:R trades automatically.”
This is what distinguishes RRZ from generic ATR-stop scripts or simple pivot overlays.
⸻
Important
• No performance promises.
• No marketing claims (“guaranteed”, “high win rate”, etc.).
• Purely a risk mapping & visualization tool.

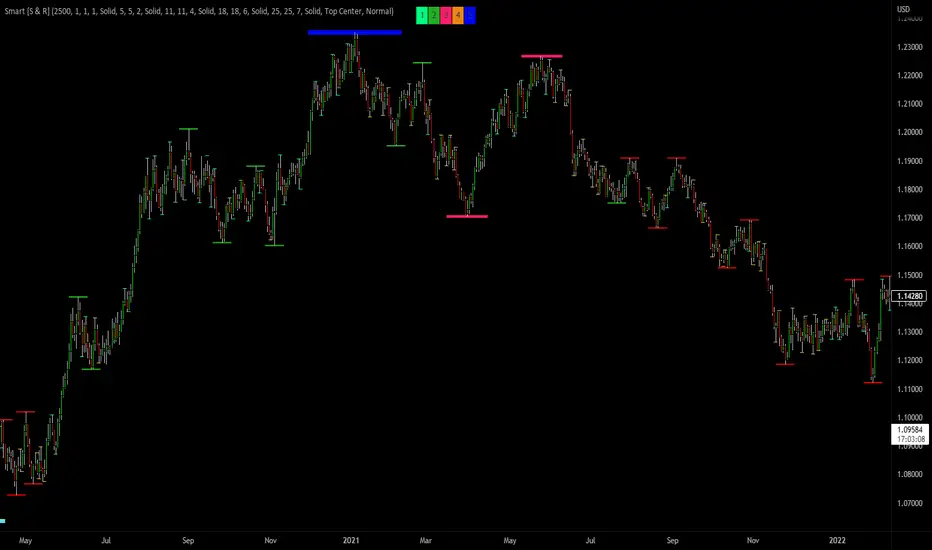
Smart Support & Resistance(My goal creating this indicator): Provide a way to categorize and label key structures on multiple different levels so I can create a plan based on those observable facts.
The Underlying Concept / What is Momentum?
Momentum indicates transaction pressure. If the algorithm detects price is going up, that would be considered positive momentum. If the algorithm detects price is going down negative momentum would be detected.
The Momentum shown is derived from a price action pattern. Unlike my previous Support & Resistance indicator that used Super Trend, this indicator uses a unique pattern I created. On the first bar bearish momentum is detected a resistance Level is made at the highest point of the previous bullish condition. On the first bar bullish momentum is detected a support Level is made at the lowest point of the previous bearish condition. This happens on 5 different Momentum Levels, (short-term to long-term). I currently use this pattern to trade so the source code is protected.
What is Severity?
Severity is How we differentiate the importance of different Highs and Lows. If Momentum is detected on a higher level the Supply or Demand Level is updated. The Color and Size representing that Level will be shown. Demand and Supply Levels made by higher levels are more SEVERE than a demand level made by a lower level.
Technical Inputs
- to ensure the correct calculation of Support and Resistance levels change BAR_INDEX. BAR_INDEX creates a buffer at the start of the chart. For example: If you set BAR_INDEX to 300. The script will wait for 300 bars to elapse on the current chart before running. This allows the script more time to gather data. Which is needed in order for our dynamic lookback length to never return an error (Dynamic lookback length can't be negative or zero). The lower the timeframe the greater the number of bars need. For Example, if I open up a 1min chart I would enter 5000 as my BAR_INDEX since that will provide enough data to ensure the correct calculation of Support and Resistance levels. If I was on a daily chart, I would enter a lower number such as 800. Don't be afraid to play around with this.
- Toggle options (Close) or (High & Low) creates Support and Resistance Levels using the Lowest close and Highest close or using the Lowest low and Highest high.
Level Inputs
- The indicator has 5 Different Levels indicating SEVEREITY of a Supply and Demand Levels. The higher the Level the more SEVERE the Level.
Display Inputs
- You have the option to customize the Length, Width, Line Style, and Colors of all 5 different
- This indicator includes a Trend Chart. To Easily verify the current trend of any displayed by this indicator toggle on Chart On/Off. You also get the option to change the Chart Position and the size of the Trend Chart
How Trend Is being Determined?
(Close > Current Supply Level) if this statement is true technically price made a HH, so the trend is bullish.
(Close < Current Demand Level) if this statement is true technically price made a LL, so the trend is bearish.
- Fully customize how you display Market Structure on different levels. Line Length, Line Width, Line Style, and Line color can all be customized.
How it can be used?
(Examples of Different ways you can use this indicator): Easily categorize the severity of each and every Supply or Demand Level in the market (The higher Level the stronger the level)
: Quickly Determine the trend of any Level.
: Get a consistent view of a market and how different Levels are behaving but just use one chart.
: Take the discretion from hand drawing support and resistance lines out of your trading.
: Find and categorize strong levels for potential breakouts.
: Trend Analysis, use Levels to create a narrative based on observable facts from these Levels.
: Different Targets to take money off the table.
: Use Severity to differentiate between different trend line setups.
: Find Great places to move your stop loss too.
Pivot Average [Misu]█ This Indicator is based on Pivot Points.
It aggregates closed Pivot Points to determine a " Pivot Average " line.
Pivot Points here refer to highs and lows.
█ Usages:
Pivot Average can be used as resistance or breakout area.
It is also very usefull to find battle zones.
It can also be used as a trend indicator: when the price is below, trend is down, when price is above, trend is up.
Mixed with momentum/volatility indicator it is very powerfull.
█ Parameters:
Deviation: Parameter used to calculate pivots.
Depth: Parameter used to calculate pivots.
Length: History Lenght used to determine Pivot Average.
Smoothing MA Lenght: MA lenght used to smooth Pivot Average.
Close Range %: Define price percentage change required to determine close pivots.
Color: Color of the Pivot Average.
