Hash Pivot DetectorHash Pivot Detector
Professional Support & Resistance Detection with Multi-Timeframe Zone Analysis
Developed by Hash Capital Research, the Hash Pivot Detector is a sophisticated indicator designed for identifying key support and resistance levels using pivot-based detection with institutional-grade zone analysis.
Key Features
Zone-Based Detection
Unlike traditional single-line S/R indicators, Hash Pivot Detector uses configurable zones around pivot levels to represent realistic institutional order areas. Adjustable zone width accommodates different asset volatilities.
Multi-Timeframe Analysis
Displays higher timeframe support/resistance levels alongside current timeframe pivots, providing crucial context for institutional positioning and stronger price barriers.
Clean Visual Design
Features Hash Capital's signature fluorescent color scheme (pink resistance, cyan support) optimized for dark charts with high contrast and instant visual recognition. Semi-transparent zones keep your chart clean and readable.
How It Works
The indicator uses pivot high/low detection with configurable left and right bar parameters. When a pivot is confirmed, it plots:
Primary support/resistance lines at pivot levels
Semi-transparent zones representing realistic order areas
Higher timeframe S/R levels as crosses for additional context
Recommended Settings
For Swing Trading:
Pivot Bars: 10-20 left/right
Zone Width: 0.5-1.0%
HTF: Daily (on 1H-4H charts)
For Intraday Trading:
Pivot Bars: 5-10 left/right
Zone Width: 0.3-0.5%
HTF: 1H or 4H (on 5min-15min charts)
Asset-Specific Zone Width:
Forex/Crypto: 0.3-0.5%
Stocks: 0.5-1.0%
Volatile Assets: 1.0-2.0%
What Makes It Different
✓ Zone-based approach (more realistic than lines)
✓ Multi-timeframe confluence detection
✓ Minimal visual clutter with maximum information
✓ Professional institutional aesthetic
✓ Comprehensive tooltips for easy optimization
✓ No repainting - all pivots are confirmed
Best Used For
Identifying high-probability entry/exit zones
Setting stop-loss and take-profit levels
Recognizing breakout/breakdown areas
Multi-timeframe confluence analysis
Swing trading and position trading
Intraday scalping with adjusted parameters
Notes
Works on all timeframes and markets
Fully customizable colors and parameters
All settings include detailed optimization guidance
Clean code, efficient performance
No alerts or notifications (visual analysis only)
Pivot points and levels

Wick Size Percentage (%) IndicatorA lightweight utility script that measures the wick size of every bar in percentages. It helps identify significant rejection blocks and volatility spikes by displaying the exact % value above and below each candle. Perfect for ICT concepts and precise risk management.
This indicator is designed for price action traders who need precise measurements of market volatility and rejection. It automatically calculates and displays the size of both the upper and lower wicks of a candle as a percentage relative to the open price.
Key Features:
Dual Measurement: Separately calculates the upper wick (high to body) and lower wick (body to low).
Percentage Based: Values are shown in percentages (%) rather than price points, making it easier to compare volatility across different assets (Crypto, Forex, Stocks).
Dynamic Labels: Visual labels appear above and below the candles for quick reading.
Fully Customizable: Users can adjust the decimal precision (e.g., for low timeframe scalping), change text size, and toggle visibility to keep the chart clean.
Data Window Support: Values are also visible in the side Data Window for detailed analysis without clutter.

Flow Dynamics Pro [ChartNation]Flow Dynamics Pro - Institutional Order Flow Zones
Detect high-probability institutional rejection zones with advanced volume analysis and confluence scoring.
Flow Dynamics Pro identifies institutional order flow zones where smart money enters and defends positions. Unlike traditional order blocks or supply/demand indicators, this tool combines multiple confirmation factors into a single confluence score, helping you focus on the highest-quality setups.
🎯 KEY FEATURES
Institutional Zone Detection
Volume spike analysis (customizable threshold)
Rejection wick detection (upper/lower wick ratios)
Market structure validation (swing high/low alignment)
Multi-factor confluence scoring (0-100 scale)
Visual Volume Distribution
Bull/bear volume split displayed inside each zone
See the exact buying vs selling pressure at institutional levels
Percentage breakdowns for quick analysis
Toggle on/off based on preference
Smart Zone Management
Automatic zone invalidation when broken with volume
Zone test tracking (shows how many times zones held)
Visual strengthening (borders thicken after successful tests)
Overlap prevention (maintains minimum spacing between zones)
Maximum zone limit (keeps chart clean)
Confluence Scoring System
Zones are scored 0-100 based on:
Volume Strength (30 points) - How significant was the volume spike
Market Structure (25 points) - Alignment with swing points
Zone Quality (25 points) - Wick ratio and pressure imbalance
Size Quality (20 points) - Optimal zone size relative to ATR
Zones are categorized as:
⚡ PREMIUM (80+) - Highest quality setups
🔥 STRONG (60-79) - Solid institutional zones
✓ MODERATE (40-59) - Valid but lower confluence
Timeframe Adaptive
Automatically adjusts detection sensitivity based on timeframe:
On 1H and lower: Stricter requirements (reduces noise)
On 4H and higher: Standard sensitivity (catches major zones)
Works on all timeframes from 1-minute to Monthly
Multi-Timeframe Context
Display higher timeframe zones for broader market context
Customizable HTF timeframe selection
Dashed visualization to distinguish from current timeframe zones
Comprehensive Alerts
Premium zone created (score 80+)
Price entering zone
Price exiting zone
Zone tested successfully
Zone invalidated
⚙️ SETTINGS OVERVIEW
Detection Settings
Volume Spike Threshold (default: 1.2x)
Minimum Wick Ratio (default: 0.3)
Structure Validation toggle
Detection Lookback period
Invalidation Settings
Require volume for invalidation (toggle)
Invalidation volume threshold (default: 1.2x)
Customizable to match your trading style
Display Settings
Maximum zones to display (default: 8)
Show/hide labels
Show/hide volume data
Volume distribution toggle
Label size adjustment (Small/Normal/Large)
Minimum zone spacing % (prevents overlaps)
Minimum confluence score filter (default: 55)
Visual Customization
Bullish zone color and opacity
Bearish zone color and opacity
Border colors
Multi-timeframe zone colors
📊 HOW TO USE
For Swing Traders (4H, Daily)
Focus on PREMIUM zones (score 80+)
Look for zones with multiple successful tests
Enter on retests with confirmation
Use HTF zones for broader context
For Intraday Traders (1H, 15m)
Use higher confluence minimum (60-65)
Increase zone spacing to reduce clutter
Focus on zones with clear volume distribution
Combine with price action for entries
Zone Test Interpretation
Tested 0x: Fresh zone, untested
Tested 1-2x: Gaining strength
Tested 3+x: Highly defended level (thicker borders)
Volume Distribution Guide
80%+ on one side: Strong directional bias
60-70% dominance: Moderate bias
50-50 split: Contested area, use caution
🔧 BEST PRACTICES
Combine with trend: Trade zones in direction of higher timeframe trend
Wait for confirmation: Don't enter blindly at zone touch
Respect invalidation: When zones break with volume, they're done
Use confluence scores: Prioritize scores 70+ for highest win rate
Manage spacing: Adjust spacing % if chart feels cluttered
Check timeframe: Lower timeframes may need stricter settings
🎓 UNDERSTANDING THE INDICATOR
What are Institutional Zones?
Areas where large players (institutions, market makers, smart money) have entered positions and actively defend them. These show up as:
High volume rejection wicks
Multiple tests that hold
Clear buying/selling pressure imbalance
Why Confluence Scoring?
Not all zones are equal. The 0-100 scoring system helps you quickly identify which zones have the most confirmation factors aligned, saving time and improving trade selection.
Why Zone Spacing Matters
Too many overlapping zones create analysis paralysis. The spacing filter ensures you see only distinct, meaningful levels.
📈 TECHNICAL DETAILS
Indicator Type: Overlay
Max Boxes: 500
Max Labels: 500
Pine Script Version: 6
Real-time Updates: Yes
Alerts: 5 types available
Repainting: Zones finalize on bar close
🚀 GET STARTED
Add indicator to chart
Adjust confluence minimum (55-65 recommended)
Set volume threshold for your instrument (1.2-1.5)
Customize colors to match your theme
Enable alerts for your preferred signals
Trade with proper risk management
💡 TIPS
Start with default settings and adjust based on results
Higher timeframes = more reliable zones
Premium zones (80+) have best risk/reward
Tested zones (3+) show strong institutional defense
Use zone invalidation as stop-loss reference
Flow Dynamics Pro is part of the ChartNation indicator suite - delivering institutional-grade tools for serious traders.

Swing Trading System v5 - Dynamic SL/Targets with LabelsThe Swing Trading System v5 is a fully-automated swing-trend framework designed to identify high-confidence breakout entries, generate dynamic stop-loss and target levels, and visually label actionable trade zones on the chart.
It adapts to market conditions using structure breaks, EMA trend filters, candle confirmation, and volume expansion signals.
Core Features
1. Swing Breakout Engine (Structure-Based)
The system detects short-term swing highs/lows and evaluates whether price has broken out above resistance or broken down below support.
A directional bias is established using a structure-based confirmation variable and automatically updated trailing stop logic.
2. Trend Filter (EMA 20/50/200)
To avoid counter-trend trades, the engine uses:
EMA-200 for primary trend direction
EMA-20 and EMA-50 for near-term momentum
Signals align only when structure breaks AND the major trend confirm each other.
3. Candle Confirmation
Entry signals require classical reversal momentum patterns:
Bullish Engulfing for long trades
Bearish Engulfing for short trades
This filters out weak structure breaks and ensures institutional momentum.
4. Volume Confirmation
Volume must exceed a configurable SMA-based threshold.
This prevents false signals during low-liquidity or consolidation phases.
Signal Logic
Long Signal Triggers
A Buy signal is printed when:
Price crosses above the dynamic trailing stop (swing resistance)
Price is above EMA-200 (bull trend)
Candle forms a bullish engulfing confirmation
Volume > SMA(10) × Multiplier
Short Signal Triggers
A Sell signal occurs when:
Price crosses below the dynamic trailing stop (swing support)
Price is below EMA-200 (bear trend)
Candle forms a bearish engulfing confirmation
Volume expansion confirms downside momentum
Dynamic Stop-Loss & Profit Targets
When a signal triggers, the system automatically calculates:
Stop-Loss (SL):
Long trades: last swing low
Short trades: last swing high
Target 1 (TP1): 1.5R relative to swing distance
Target 2 (TP2): 3.0R for trend continuation moves
SL, TP1, and TP2 are displayed on-chart using extended line plots and right-side labels for clean visualization.
Labels for old signals are automatically deleted to keep the chart uncluttered.
Visual Components
The indicator provides:
BUY/SELL signal labels
Dynamic SL, TP1, TP2 lines with color coding
SL/TP labels positioned at the end of each new trade
Clean breakout detection based on structural pivots
All elements update automatically as new swings form.
Intended Use
This system is built for:
Swing Traders
Systematic Discretionary Traders
Trend Followers
Breakout/Momentum Traders
Works well on:
Stocks
Crypto
Forex
Indices
Commodities
Optimal timeframes: 1H, 4H, Daily, Weekly
Summary
The Swing Trading System v5 provides:
High-quality breakout entries
Trend-aligned signals
Volume-filtered confirmation
Automated risk-reward generation
Clean and dynamic chart labels
A complete, self-contained swing-trading solution for systematic execution and disciplined risk management.

LiquidityPulse Multi-Timeframe Volume Zones/ LevelsLiquidityPulse Multi-Timeframe Volume Zones/ Levels
Non-repainting: levels appear on bar close and do not change.
What This Indicator Does
This indicator scans lower-timeframe price action to identify bars where volume and candle behaviour suggest that a notable price interaction occurred. When all conditions align, the script extracts a precise price level from that bar, plots it on your higher-timeframe chart, and extends it forward so you can observe whether the market interacts with it again later.
Each selected timeframe is processed independently. For every timeframe you enable, the script looks for the following criteria:
1. A shift in candle direction between the previous bar and the current bar
2. A close-to-open body alignment , helping filter out irregular or noisy movement
3. A volume increase relative to the recent average , based on a user-selected multiplier
If these conditions are met, the script marks the corresponding price level on the chart. You can enable up to seven lower timeframes at once, each with its own independent settings, colours, strength filters, and display capacity. This allows you to build a layered, multi-timeframe view of the levels/ zones.
How It Works
1. Candle Behaviour Shift
The script checks whether the previous bar and the current bar show opposing directional behaviour. This helps highlight moments that may reflect a shift in directional behaviour or a change in price movement characteristics.
2. Body Alignment
The previous bar’s close must closely align with the current bar’s open. This requirement reduces random noise and focuses detection on areas where structure between candles is unusually clean.
3. Volume Requirement
The combined volume of the current bar and the previous bar must exceed the recent average by a multiplier you choose.
Lower multiplier - more levels
Higher multiplier - only the most significant activity spikes qualify
This filters for bars with above-average participation (volume).
4. Price Level Identification
If all conditions are met, a price edge is defined:
Bearish pressure: upper edge
Bullish pressure: lower edge
This edge marks the price level where the qualifying candle behaviour occurred.
5. Zone Drawing
Each qualifying event produces:
A horizontal line marking the level
A (optional) shaded box around the level
A label showing the timeframe and the exact volume multiplier amount detected
The level then extends forward so you can monitor future interactions.
Key Settings
Zone Strength (Volume Multiplier)
Determines how selective the volume filter is.
Lower settings show more frequent activity
Higher settings restrict detection to only the strongest activity (volume) increases
Multi-Timeframe Framework
Enable/disable per timeframe
Custom source timeframe (e.g., 1m, 5m, 15m, etc.)
Strength threshold per timeframe
How many recent levels to display per timeframe (Show Last N Zones.)
You can display a single timeframe or stack several to highlight clustering.
How traders can use this indicator
This script is not a buy/sell signal generator. It is best used as a structural overlay that helps you identify:
Where candle behaviour abruptly shifted with increased volume
Whether multiple timeframes highlight similar levels
Comparing how frequently these conditions appear across different timeframes
How price behaves when revisiting areas of prior activity (levels)
Why this type of detection can be informative
Higher-timeframe charts compress a large amount of lower-timeframe activity. By identifying where the script found notable changes in direction, structure, and relative volume on a lower timeframe, it provides a way to reference points in the price history where behaviour differed from nearby bars. Displaying these levels on a higher timeframe allows traders to see how these conditions align with their broader analysis.
Disclaimer
This indicator does not measure true liquidity or order flow. It uses candle structure and relative-volume comparisons as interpretive tools, and the plotted levels do not represent signals or predictions. All analysis is user-interpreted, and past behaviour does not imply future behaviour.

SVE Pivot PointsSVE Pivot Points are a modified variation of traditional pivot points created by Sylvain Vervoort (SVE). They are designed to adapt more dynamically to price volatility and short-term market structure, giving traders more responsive support and resistance levels.
Unlike standard floor pivots that rely only on the previous period’s high/low/close, SVE Pivot Points incorporate volatility-based smoothing, making the levels more stable during choppy markets and more reactive when volatility expands.
1. Volatility-Adaptive Formulas
SVE uses smoothing techniques (often EMA-based or Vervoort’s proprietary volatility filters) that adjust to current market noise.
This reduces false levels and gives clearer reaction zones.
2. Dynamic Support & Resistance
You still get:
• Pivot (P)
• Support levels (S1, S2, S3)
• Resistance levels (R1, R2, R3)
But they update based on volatility-weighted highs/lows instead of raw numbers.
3. More Reliable in Intraday Trading
SVE pivot points were designed to:
• Improve accuracy
• Reduce whipsaw
• Give better intraday turning points
This is why they’re popular among futures, forex, and index traders.

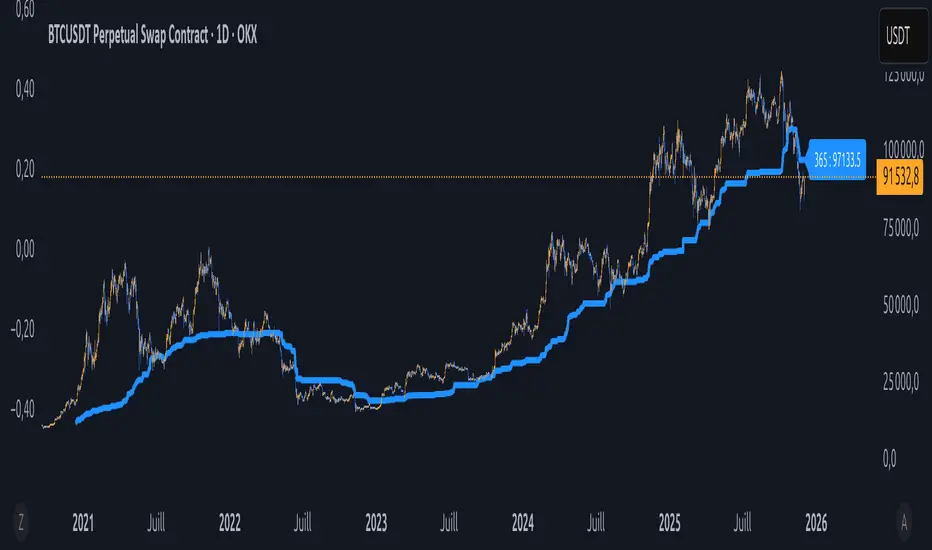
Équilibre du Sentiment – Multi-Périodes (v6)
English
A unique and advanced sentiment indicator based on the harmonic mean of highs and lows over nested rolling windows.
How it works:
The neutral sentiment point is reached when positive sentiment equals negative sentiment, which corresponds to the situation where the percentage between the price and the minimum is equal to the percentage between the maximum and the price.
For each chosen period N, the script calculates N different "neutral feeling" values:
- One using the last 1 bar
- One using the last 2 bars
- …
- One using the last N bars
It then extracts the exact median of these N values using a sorted insertion method (no approximation).
This produces an extremely smooth, non-repainting equilibrium line that represents the true "central sentiment" of the market over the selected lookback.
Features:
- Up to 3 independent periods (365, 52, 26 by default – fully customizable)
- Optional background coloring (green/red) when price is above/below the main curve
- Clean labels on the last bar showing the current value for each active period
- Zero repainting – fully compatible with strategies and alerts
- Highly responsive even with very long periods (up to 3500 bars)
Great for:
- Identifying long-term fair value / equilibrium zones
- Building mean-reversion or breakout systems
Pure Pine Script® v6 – no external libraries, no security calls, no repainting-free.
BADSHAHI TRADINGTradingView indicator that posts buy and sell signals along with support and resistance levels, you need to develop a Pine Script that identifies key support and resistance levels and then displays buy and sell signals based on certain conditions. Here's a breakdown of how to approach this:
1. Support and Resistance Basics
Support and resistance are critical concepts in technical analysis:
Support: This is a price level where an asset tends to find buying interest, preventing the price from dropping further.
Resistance: This is a price level where selling pressure tends to increase, preventing the price from rising further.
To detect support and resistance, we typically use methods like pivot points, recent swing highs/lows, or price levels that have repeatedly reversed direction in the past.
2. Buy and Sell Signals
Buy and sell signals are often generated based on certain criteria like:
Price crossing above or below a moving average
Candlestick patterns (like Doji, engulfing)
Breakouts from support/resistance levels
In this example, we’ll consider a simple strategy where:
Buy signal is generated when the price breaks above resistance.
Sell signal is generated when the price breaks below support.
________________________________________
Warning:
• While this indicator aids in decision-making and risk management, no indicator is 100% accurate.
• Always consider broader market conditions and apply sound risk management techniques.

High-Res VP + Macro Auto Fib DJVolume profiling plus Fibonacci for the descrationary trader.
Volume profile: The most important tool that I know.
Fib: Gives you an idea of the moves.

HTF OHLC Candle + 50% @MaxMaserati 3.0HTF OHLC Candle + 50% MaxMaserati 3.0
This powerful, all-in-one indicator allows traders to visualize the Open, High, Low, Close (OHLC) structure and the critical 50% Midpoint (Equilibrium) of up to four different Higher Timeframes (HTFs) directly overlaid onto the current chart. Stop switching timeframes and start seeing the complete market structure at a glance!
✨ Core Features & Trader Benefits
1. 🌐 Comprehensive Multi-Timeframe Context
Visualize the past and present candle structure of four independently configurable timeframes (TF1, TF2, TF3, TF4). This eliminates manual charting and provides an immediate understanding of macro market ranges and directional bias.
TF1 OHLC LIVE: Focuses on the current, forming candle of a major timeframe (e.g., the current Daily candle) to show where price is trending relative to its open and range.
TF2-TF4 OHLC Boxes:Display both the closed historical candles (up to 10 previous boxes) and the current, forming candle for deep structural reference.
2. 🎯 Critical Level Projection (OHLC & 50%)
The indicator automatically projects and extends key price levels from each higher timeframe candle across your current chart, making them highly visible reference points.
|High (H) / Low (L): Marks the full structural range (wick to wick).
Open (O) / Close (C): Defines the body and the direction of the candle. Price magnet targets and momentum entry/retests.
50% Midpoint: The Equilibrium of the candle's range. Optimal Trade Entry (OTE) zones, potential support/resistance, and fair value flip points.
3. 🎨 Advanced Customization & Aesthetics
Every element of the indicator is highly customizable to match your preferred trading style and chart theme:
Custom Color Schemes: Independently set Bullish and Bearish body/wick colors for each of the four timeframes.
Aesthetic Clarity: Configure the size and placement of Timeframe Labels (e.g., "H4 50%") on the extended lines to maintain visual organization.
Line Styling: Adjust the color, transparency, and thickness for every individual level (Open, High, Low, 50%) across all four timeframes.
4. 🧹 Chart Management
With controls for `Max Boxes` and separate toggles for showing the current vs. closed OHLC lines, you can prevent chart clutter and focus only on the structural context relevant to your strategy.

SPY SRX S&R Levels - Premium EditionSRX SPY Predictive Support & Resistance Levels
SRX is not a typical TradingView support/resistance indicator.
These levels are not calculated on TradingView at all . Instead, every morning after market open, nearly 20,000 data points are analyzed externally to determine where SPY is statistically most likely to react.
This produces support and resistance levels that are hyper-accurate, mathematically derived, and consistently respected intraday , not hand-drawn guesses or generic indicator outputs.
On top of that, SRX plots dynamic volatility-based zones around each major level so you can catch moves that don’t hit the level penny-perfect.
SRX also generates Buy/Sell Arrows during trending conditions and Buy/Sell Circles during non-trending or early-trend conditions.
Arrows = higher-probability trend-aligned setups.
Circles = lower-confidence ideas that can often be scalped on 1m–3m charts.
This tool is built for traders who want clarity, precision, and the ability to anticipate key reactions on SPY with confidence.
Features:
Externally Calculated SRX Levels: Nearly 20,000 data points analyzed daily to produce statistically significant support & resistance levels.
Dynamic Volatility Zones: Capture moves that don’t hit levels perfectly with automatically adjusting upper/lower zones.
Expected Daily Range: Session high/low projections based on historical and current volatility.
Support Levels (S1–S4): Up to four graduated support zones for precision planning.
Resistance Levels (R1–R4): Up to four graduated resistance zones built from the same predictive model.
Premarket High/Low (PMH/PML): Toggleable levels from premarket session.
Previous Day High/Low (PDH/PDL): Quickly mark the prior day’s key reaction points.
Previous Day Open/Close (PDO/PDC): Additional contextual levels (toggle on/off).
Buy/Sell Arrows: Trigger when price interacts with both the EMA and an SRX level/zone in trending conditions.
Buy/Sell Circles: Trigger in non-trending environments — lower confidence but often scalp-friendly.
EMA Overlay: Adjustable EMA used for signal confirmation (default length 8).
Runway Filter: Optional filter that improves signal quality by measuring available “runway” before the next SRX level.
Near EMA Touch Logic: Helps detect momentum shifts and avoid false signals.
Bias Filter: Determines whether the market is trending up, trending down, or neutral — off by default but extremely powerful.
Historical Data Section: View previous SRX levels for backtesting and strategy review.
Customizable Appearance: Colors, transparency, labels, arrows, zone styling and more.
Built-In Alerts:
Zone/Level Touch or Cross
PMH/PML Touch or Cross
PDH/PDL Touch or Cross
PDO/PDC Touch or Cross
Max-Range High/Low Reached
Buy/Sell Arrow Signals
How to Use:
Copy the daily SRX data string from the official Discord channel.
Paste it into the “SRX Levels Input” field inside the indicator settings.
Customize colors, zones, EMA, signals, and filters to match your trading style.
Use SRX support/resistance levels as the foundation for intraday setups.
Use Arrows when the market is trending and the bias is clear.
Use Circles cautiously during choppy or unconfirmed conditions (often great for scalp entries on 1m/3m).
Optionally enable alerts for level reactions or signal prints.
Ideal For:
Intraday traders who rely on precise support/resistance
SPY scalpers seeking high-probability reaction zones
Momentum traders catching breakouts or bounces
Traders who want statistical structure, not subjective drawings
Important Notes:
SRX levels are calculated externally using proprietary models.
This indicator requires a paid subscription to access the daily SRX support/resistance data.
Daily levels are delivered through our private Discord.
Without the SRX daily data string, the indicator will not display levels.
You can join here to get access to the SRX Levels feed:
stockalertsreviewed.clickfunnels.com
SRX currently works exclusively with SPY (as of Dec 2025). We plan to expand to additional tickers in 2026.
Buy/Sell signals are trade ideas — always confirm with market context.

new alertable spacemanhope these alerts work. open to fixes
slight modification to Key Levels SpacemanBTC IDWM script
credit: spacemanbtc
Forex indicator By petran Elevate your market analysis with this powerful, all-in-one visual toolkit designed for discretionary traders across Forex, indices, and commodities (metals).
Core Features:
Trading Sessions Overlay: Clear visual bands highlighting the Asian, London, and New York trading sessions directly on your chart. Never miss a market open or a session overlap again.
Smart Daily Levels: Automatically plots the most essential reference points from the previous day:
PDH / PDL (Previous Day High/Low) – Key support and resistance.
PWH / PWL (Previous Week High/Low) – Higher timeframe context.
DO (Day Open) – A crucial intraday pivot level.
Motivational Watermark: A unique and customizable text overlay at the top of your screen. Display your favorite trading quote, rule, or reminder to maintain the right mindset during the trading day.
Clean & Customizable: Designed for clarity. Adjust colors, session times, and watermark text to fit your personal trading style and chart aesthetics.
Why Traders Choose This Indicator:
Saves Time: No more manually drawing sessions or calculating yesterday's levels.
Improves Discipline: The visual sessions and watermark help you trade only during your planned times and follow your rules.
Universal Application: Works seamlessly on any liquid market where session activity and daily ranges matter.
Perfect for traders who rely on price action, session-based strategies, and need a clean, informative chart environment.

DWM HLOC, Mid & WicksSimple, yet effective.
1. Automatically calculate and projects key price levels from a previous period (Yesterday, OR Last Week / Month) onto the current trading session. It acts as an immediate Support & Resistance map based on historical price action.
2. Multi-Timeframe Logic
Modes --
Daily Mode: Projects yesterday's data onto today.
Weekly Mode: Projects last week's data onto the current week.
3. Key Levels Visualized The script calculates seven distinct price levels:
OHLC: Previous Open, High, Low, and Close.
Equilibrium (Mid): The exact 50% mark between the previous High and Low.
Wick Midpoints (New):
Upper Wick 50%: The midpoint between the High and the top of the body.
Lower Wick 50%: The midpoint between the Low and the bottom of the body.
4. Smart "Gap" Visualization The script uses unique starting points to help traders visualize market gaps:
Standard Levels (High, Low, Open, Mids): These lines originate from the Previous Period's Open, showing the full context of the level relative to time.
Close Level: This line originates from the Current Period's Open. This visually highlights the "Gap" (the jump in price between where the market closed previously and where it opened today).
5. Full Customization
Aesthetics: Every line can be individually toggled on/off.
Styling: Users can independently change the color, line style (Solid, Dotted, Dashed), and thickness for every specific level.

Key Levels + 15M ORBWhat this gives you? (“Key Levels”)
15m ORB High/Low
Clean horizontal lines across full RTH session, only drawn after first 15 minutes complete.
Premarket High/Low (PMH/PML)
Dashed lines; optional labels if you want them.
Previous Day Zones (PDH/PDL)
Wick→body zones for prior RTH session.
Optional zone fill to visualize where prior day got rejected/accepted.
Optional PDH/PDL labels.

SPY Daily Expected Move • Manual VIXSPY Daily Expected Move • Manual VIX — Description 📈🔥
This indicator calculates the daily expected move (EM) for SPY using a manual VIX input, then draws the projected high and low boundaries for the trading session.
It automatically retrieves the previous day’s closing price (or today’s open if you choose), then applies a volatility-based formula to estimate the range SPY is statistically likely to remain within. 📊
How the Expected Move Is Calculated 🧮
This indicator uses a simplified institutional volatility model:
\text{Expected % Move} = \frac{\text{VIX}}{\sqrt{252}}
This daily percentage is multiplied by your chosen baseline price:
📘 Previous Close (recommended — most accurate)
🌅 Today’s Open
✏️ Custom Price
And the script automatically plots:
🔼 Expected High
🔽 Expected Low
🏷️ Optional labels + info panel
Choosing the Correct Baseline 🎯
The baseline is one of the most important components of the expected move calculation.
Previous Day’s Close (Strongly Recommended) ✔️
Used by:
🏦 Market makers
🎛️ Options market makers
📐 Institutional volatility models
Expected move represents full-day implied volatility, making the previous close the mathematically correct anchor for SPY.
Using the VIX Input 🌡️
Enter the current VIX, taken from /VX futures or the ^VIX index.
⬆️ Higher VIX = larger expected move
⬇️ Lower VIX = tighter expected move
This lets you align SPY’s session range with real-time volatility conditions.
Recommended VIX-Based Multiplier Adjustments 🔧
The multiplier input allows you to fine-tune the expected move in different volatility regimes.
VIX Level Market Condition Recommended Multiplier
🟦 < 13 Very low volatility 0.9 — tight EM
🟩 13–18 Normal conditions 1.0 (default)
🟨 18–25 Elevated volatility 1.05 – 1.1
🟧 25–35 High volatility 1.2 – 1.3
🟥 > 35 Extreme volatility 1.4 – 1.6
These adjustments reflect how SPY’s actual intraday range stretches during higher volatility periods.
Why This Indicator Matters for SPY Traders 🚀
SPY is the most heavily traded ETF in the world, and market makers heavily rely on expected move to price options.
Because of that:
🧲 EM levels often act as dynamic support/resistance
📛 Breaks above/below EM can trigger gamma-driven trend days
🔄 Sweeps around EM frequently produce high-probability reversal zones
This indicator provides a statistically grounded framework that helps traders anticipate where SPY is most likely to:
move
stall
reverse
expand beyond expected range
All with clean, auto-updating levels that adjust daily based on your input of previous close price and the current VIX opening price.⚡📘

QQQ Daily Expected Move • Manual VIXQQQ Daily Expected Move • Manual VIX — Description 📈⚡
This indicator calculates the daily expected move (EM) for QQQ using a manual VIX input, then draws the projected high and low boundaries for the session.
It automatically pulls the previous day’s closing price (or today’s open if selected) and applies a volatility-based formula to estimate the range QQQ is statistically likely to stay within. 📊
How the Expected Move Is Calculated 🧮
The formula uses a simplified volatility model:
\text{Expected % Move} = \frac{\text{VIX}}{\sqrt{252}}
This percentage is then applied to your selected baseline price:
📘 Previous Close (recommended — most accurate)
🌅 Today’s Open
✏️ Custom Price
The indicator automatically plots:
🔼 Expected High
🔽 Expected Low
🏷️ Optional labels + info panel for quick reference
Choosing the Correct Baseline 🎯
The baseline matters — a lot. Using the correct anchor improves accuracy dramatically.
Previous Day’s Close (Best Practice) ✔️
This is the institutional standard used by:
🏦 Market makers
📉 Options desks
📚 Professional volatility models
Because EM reflects full-day volatility, the prior close is mathematically the most accurate anchor.
Using the VIX Input 🌡️
Enter the current VIX manually (from /VX or ^VIX).
⬆️ When VIX rises → EM widens
⬇️ When VIX falls → EM tightens
Suggested VIX-Based Adjustments 🔧
Use the multiplier to fine-tune the expected move.
VIX Level Market Condition Recommended Multiplier
🟦 < 13 Very low volatility 0.9 – slightly tighter EM
🟩 13–18 Normal conditions 1.0 (default)
🟨 18–25 Elevated volatility 1.05 – 1.1
🟧 25–35 High volatility 1.2 – 1.3
🟥 > 35 Extreme volatility 1.4 – 1.6
Multipliers help the EM adapt to different volatility regimes so the ranges remain realistic.
Why This Indicator Matters 🚀
Market makers price daily options around the expected move.
Because of this:
🧲 EM boundaries often behave like dynamic support & resistance
📛 Breaks of EM commonly trigger gamma-driven trend days
🔄 Sweeps around EM often create high-probability reversals
This tool gives traders a statistically grounded framework to anticipate where QQQ is most likely to move, stall, reverse, or expand, with clean auto-updating levels every trading day.
Adjusting the previous day’s close, opening price, and VIX input lets you model the market like a volatility desk — but in a simple, transparent format. 📘✨

The Morning Map Out- V1.0The Morning Map Out (MMO) delivers the complete blueprint to your chart, automatically.
Every level is generated by our proprietary engine and then meticulously reviewed and curated by our team of professional traders each morning. This unique fusion of automation and expert oversight is our secret sauce.
Now, you have an on-demand map for every asset that matters. If TSLA is moving, you have its levels. If SPY is at a critical juncture, you have the blueprint. You will never fly blind again.
Core Coverage: SPY, QQQ, ES, NQ, NVDA, TSLA, AAPL, MSFT, AMZN & more.
This is your new daily edge.

Auto Golden Pockets + Extensions (Clean Labels)This indicator automatically detects the latest confirmed swing high and swing low, determines the current trend direction, and plots the most important Fibonacci retracement and extension levels. Once a new swing forms, the script instantly redraws clean 0.382, 0.500, and 0.618 “Golden Pocket” retracements, along with 1.382, 1.618, and 2.0 extensions. Negative-side Fibonacci projections are also included for deeper pullbacks or overextensions.
Using Fibonacci levels is powerful because markets often move in proportional waves. These ratios—especially the golden pocket (0.618–0.5)—tend to align with areas where algorithms, institutions, and repeatable market psychology create high-probability reaction zones. Whether price is retracing or breaking out, these levels help traders anticipate where reversals, continuations, or strong inflection points are most likely to occur.
This tool keeps your chart clean, automatic, and always aligned with the most recent market structure.

HL/LH Confirmation Strategy (Clean Market Structure)🚦 HL/LH Confirmation Strategy (Clean Market Structure)
This indicator is specifically designed to help traders identify a clean market structure by tracking the formation of Higher Lows (HL) and Lower Highs (LH). Rather than chasing new price extremes (new Highs or new Lows), the focus is on waiting for trend strength confirmation before considering an entry.
Key Strategy: Waiting for Trend Confirmation 💡
The core advantage of this indicator lies in its confirmation strategy:
For Uptrends (Bullish): The indicator doesn't signal just any low, but only when it detects a Higher Low (HL)—a low that is higher than the previous low. This is a crucial sign that the market has defended a level and is ready to continue moving up. This approach helps avoid chasing new lows and encourages entering trades after confirmation.
For Downtrends (Bearish): Similarly, the indicator looks for the formation of a Lower High (LH)—a high that is lower than the previous high. This suggests that buyers failed to breach the last resistance, signaling a potential continuation of the downside movement.
The indicator alternates between looking for an HL, then an LH, then an HL, visually mapping the Pivot swings and highlighting the moment of trend confirmation for potential trade entries.
Indicator Features ✨
Clear Structure Display: By drawing connecting lines between valid HL and LH points, the indicator visually maps the current market structure.
Pivot Detection: It uses an effective method for Pivot detection, with the sensitivity adjustable via the "Pivot Left" and "Pivot Right" parameters.
Custom Label Placement (Crucial Detail):
HL Label: Placed below the candle for better visual clarity of the bullish support area.
LH Label: Placed above the candle for better visual clarity of the bearish resistance area.
Customizable Colors: Full control over the background and text colors for HL and LH signals, as well as the thickness and color of the connecting lines between Pivot points.
⚙️ Input Parameters
Pivot Settings
Pivot Left / Pivot Right: Determine the number of bars to the left and right that must have lower/higher prices for a point to be declared a valid Pivot (Pivot High or Pivot Low). Increase these values to detect more significant, longer-term swings.
Signal Colors
HL Background/Text Color: Colors for the background and text of the Higher Low (HL) labels.
LH Background/Text Color: Colors for the background and text of the Lower High (LH) labels.
Line Settings
Line Color / Line Width: Allows customization of the appearance of the line connecting the detected HL and LH points.
Recommended Use
This indicator is ideal for traders practicing Price Action and strategies based on Market Structure. Use the HL signals as potential zones for long entries (buying) in an uptrend, and LH signals as zones for short entries (selling) in a downtrend, always after the point formation is confirmed.

JFX Smart ORBJFX Smart ORB is a complete visual trading framework built around the classic
Opening Range Breakout (ORB) concept, enhanced with:
Fixed position sizing (lots)
Automatic Martingale-style size increase after full SL only
A full, event-based alert system for entries, targets, stops, and break-even exits
All of that, plus a clean dual-language HUD (AR/EN) directly on your chart.
What JFX Smart ORB Does
🔹 Smart Opening Range (ORB)
Automatically defines the opening range via:
Fixed timeframe (e.g., 30 minutes), or
Custom session window (e.g., 09:30–09:45) with configurable time zone (UTC-5, etc.).
Plots ORH / ORL and the midline, and shades the OR building zone for visual clarity.
🔹 Regime Detection (Context)
Background shading tells you where price is trading:
📈 Green: Above ORH (bullish regime)
📉 Red: Below ORL (bearish regime)
🔵 Neutral: Inside the OR range
This gives you an instant read on context before you even think about entries.
🔹 Trade Logic & Multi-Target Management
Automatic entry when:
Price breaks ORH for long trades
Price breaks ORL for short trades
Stop loss on the opposite side of the range.
Targets calculated in R-multiples:
TP1 = 0.5R
TP2 = 1R
TP3 = 2R
Position is split across TP1 / TP2 / TP3 according to user-defined percentages, normalized automatically.
💰 Fixed Size + Martingale After Loss Only
Inputs:
Capital ($) – for display/analysis
Base Position Size (lots) – your standard trade size
Contract per 1.00 lot – to convert price movement to P/L in dollars
If a trade hits a full stop loss before TP1, the indicator:
Doubles the position size for the next trade (Martingale factor).
If the trade hits any profit (TP1, TP2, TP3) or closes at Break-Even, the:
Martingale factor resets back to 1× (base size).
Everything is tracked and shown on the chart: current trade size, P/L per trade, and net P/L.
🧠 Session Protection & Inner-Range Logic
Optional session block:
After a strong winning trade (e.g., TP2 or TP3), you can block any further trades for the rest of the ORB session to avoid overtrading.
Inner-range logic after TP1:
Prevents immediate re-entry in the same direction after a BE exit from TP1.
Waits for price to return into a defined inner range around the OR midline, filtering out random noise.
📊 On-Chart HUD / Stats (AR & EN)
The built-in info panel shows in real time:
Session status:
✅ Trading enabled
🚫 Trading disabled until a new ORB
⏳ Waiting for two bars back inside the range
Current price regime (Above ORH / Below ORL / Inside OR).
Entry price, stop loss, TP1, TP2.
Total trades, losing trades, and win rate.
Counts of TP1 / TP2 / TP3 hits.
Reported capital, current position size (lots).
Current trade P/L and total net P/L in dollars.
🔔 Full Alert System (Ready for Webhooks/Bots)
The indicator generates per-bar event flags that feed into alertcondition() so you can build any alert setup you want (pop-up, email, SMS, webhook, bot, EA, etc.).
Available alerts:
Buy Entry: JFX_ORB_BUY_ENTRY
Sell Entry: JFX_ORB_SELL_ENTRY
Stop Loss Hit: JFX_ORB_SL_HIT
TP1 Hit: JFX_ORB_TP1
TP2 Hit: JFX_ORB_TP2
TP3 Hit: JFX_ORB_TP3
Break-Even Exit: JFX_ORB_BE_EXIT
Simply create alerts in TradingView based on these conditions and messages, or plug them into your automation via webhooks.
Who Is JFX Smart ORB For?
Day traders and scalpers who like structured ORB strategies instead of random entries.
Traders who want clear, rule-based entries, well-defined stops and multi-target exits.
Anyone looking to combine ORB + position management + Martingale logic + Alerts in a single, professional tool.
Disclaimer:
This indicator is a professional analysis and trade-management tool, not a guarantee of profit.
Always test on demo first and adapt the position sizing and Martingale behavior to your own risk management and trading plan.

RKY MAGIC Levels (Daily Fixed)This Pine Script indicator generates one fixed Buy Pivot Point and one fixed Sell Pivot Point every day, exclusively for intraday trading. These pivot points remain unchanged throughout the session and act as key decision zones for traders.
Traders can set their Stop Loss and Targets based on their individual risk capacity, and once the trade moves into profit, they can trail the Stop Loss to protect gains.
A powerful feature of this indicator is its built-in trend continuation logic:
👉 If the Buy Pivot Point or Sell Pivot Point is broken and the price sustains above or below that level for 30 minutes, it signals a high-probability trend continuation.
This makes the indicator highly effective for identifying breakout strength and avoiding false signals. It is suitable for all types of intraday trading styles—scalping, momentum, and trend-following.

Hidden Volume Profile[52Signal Recipe]─────────────────────────────────────
52SIGNAL RECIPE Hidden Volume Profile
◆ Overview
52SIGNAL RECIPE Smart Volume Profile is an advanced volume distribution indicator that visualizes buying and selling strength across different price levels. Unlike traditional volume profiles that only display total volume, this enhanced version separates buy volume and sell volume at each price level, revealing the hidden balance of market forces at specific prices.
Built on the same sophisticated calculation methodology as our Hidden Volume Detector, this indicator applies enhanced volume analysis to the Volume Profile framework. By displaying horizontal volume bars (green for buying, red for selling) at each price level in a separate panel, it provides clear insight into where market participants accumulated or distributed their positions.
Furthermore, when used alongside the Hidden Volume Detector that shows individual candle analysis, it enables traders to understand both micro-level (candle-by-candle) and macro-level (price-level) market dynamics comprehensively, supporting more effective trading strategies.
─────────────────────────────────────
◆ Key Features
Price-Level Volume Distribution: Displays horizontal volume bars at each price level, showing where the most trading activity occurred
Buy/Sell Volume Separation: Green bars represent buying volume (bullish pressure), red bars represent selling volume (bearish pressure) at each price level
POC (Point of Control) Identification: Automatically marks the price level with the highest total volume, acting as a strong support/resistance level
Enhanced Buy/Sell Calculation: Analyzes candle structure, position, and momentum to distinguish genuine buying pressure from selling pressure, using the same algorithm as Hidden Volume Detector
Customizable Display: Adjustable number of price levels (rows), analysis period (lookback bars), color customization, and POC line toggle
Magnet Effect Visualization: Shows how price gravitates toward high-volume areas, particularly the POC
─────────────────────────────────────
◆ Trading Application Points
Identify strong support zones where large green bars indicate buyer accumulation
Identify strong resistance zones where large red bars indicate seller distribution
Use POC as a key pivot point for support/resistance trading
Detect volume imbalances at specific price levels to find bullish or bearish zones
Combine with Hidden Volume Detector for complete analysis: individual candle timing (Hidden Volume) + price level zones (Volume Profile)
─────────────────────────────────────
◆ Synergy With Other Indicators
Use with Hidden Volume Detector for multi-dimensional volume analysis: candle-level detail + price-level overview
Combine with trend indicators (Moving Averages, MACD) to validate support/resistance levels in trending markets
Use with price action patterns to confirm breakout or reversal signals at key volume levels
─────────────────────────────────────
◆ Conclusion
52SIGNAL RECIPE Smart Volume Profile is a powerful and intuitive tool that reveals the distribution of buying and selling forces across price levels. By visualizing buy and sell volumes separately at each price level and identifying the POC, it allows traders to understand where market participants made their decisions and where key support/resistance levels exist.
Especially when used together with the Hidden Volume Detector, it provides a complete volume analysis system: Hidden Volume shows real-time buying/selling pressure in individual candles for precise entry/exit timing, while Smart Volume Profile shows accumulated buying/selling zones across price levels for strategic planning. This combination enables traders to interpret market dynamics from both micro and macro perspectives, ultimately supporting more informed and effective trading decisions.
─────────────────────────────────────
※ Disclaimer: This indicator is provided as a supplementary analysis tool and should not be used as the sole basis for trading decisions. Past data does not guarantee future results. Volume Profile is most effective in ranging markets and may be less reliable in strong trending conditions. Always apply proper risk management.
─────────────────────────────────────
─────────────────────────────────────
52SIGNAL RECIPE Hidden Volume Profile
◆ 개요
52SIGNAL RECIPE Smart Volume Profile은 가격대별 매수와 매도의 거래량 분포를 시각화하는 고급 볼륨 분석 지표입니다. 단순히 전체 거래량만 표시하는 기존 볼륨 프로파일과 달리, 각 가격대에서의 매수 볼륨과 매도 볼륨을 분리하여 보여줌으로써 특정 가격에서의 시장 세력 간 숨겨진 균형을 드러냅니다.
Hidden Volume Detector와 동일한 정교한 계산 방식을 기반으로, Volume Profile 프레임워크에 강화된 볼륨 분석을 적용했습니다. 각 가격대에 수평 거래량 막대(초록색 매수, 빨간색 매도)를 별도 패널에 표시하여, 시장 참여자들이 어느 가격에서 포지션을 축적하거나 분산했는지 명확하게 파악할 수 있도록 지원합니다.
또한, 개별 캔들 분석을 보여주는 Hidden Volume Detector와 함께 병행해 보면, 미시적 수준(캔들별)과 거시적 수준(가격대별) 시장 역학을 모두 종합적으로 이해할 수 있어, 훨씬 효과적인 매매 전략 수립이 가능합니다.
─────────────────────────────────────
◆ 주요 특징
가격대별 거래량 분포: 각 가격대에 수평 거래량 막대를 표시하여 가장 많은 거래가 일어난 곳을 시각화
매수·매도 볼륨 구분: 각 가격대에서 초록색 막대는 매수 볼륨(상승 압력), 빨간색 막대는 매도 볼륨(하락 압력) 표시
POC (Point of Control) 식별: 가장 많은 거래량이 발생한 가격대를 자동으로 표시하며, 강력한 지지/저항선 역할 수행
향상된 매수·매도 계산: 캔들의 구조, 위치, 모멘텀을 분석하여 진정한 매수 압력과 매도 압력을 구분하며, Hidden Volume Detector와 동일한 알고리즘 사용
커스터마이징 가능한 디스플레이: 가격 레벨 수(행), 분석 기간(룩백 바), 색상 커스터마이징, POC 라인 토글 조정 가능
자석 효과 시각화: 가격이 고거래량 구간, 특히 POC로 회귀하려는 경향을 보여줌
─────────────────────────────────────
◆ 트레이딩 활용 포인트
큰 초록 막대가 있는 곳을 강한 지지 구간으로 활용(매수 세력 축적)
큰 빨간 막대가 있는 곳을 강한 저항 구간으로 활용(매도 세력 분산)
POC를 핵심 피봇 포인트로 활용하여 지지/저항 매매 전략 수립
특정 가격대의 거래량 불균형을 감지하여 강세 또는 약세 구간 파악
Hidden Volume Detector와 결합하여 완전한 분석: 개별 캔들 타이밍(Hidden Volume) + 가격대 구간(Volume Profile)
─────────────────────────────────────
◆ 다른 지표와 조합 가능성
Hidden Volume Detector와 함께 사용하여 다차원적 볼륨 분석: 캔들 레벨 디테일 + 가격 레벨 전체 조망
추세 지표(이동평균선, MACD)와 결합하여 추세장에서 지지/저항 레벨 검증
가격 패턴과 함께 활용하여 주요 거래량 레벨에서의 돌파 또는 반전 신호 확인
─────────────────────────────────────
◆ 결론
52SIGNAL RECIPE Smart Volume Profile은 가격대별 매수와 매도 세력의 분포를 드러내는 강력하고 직관적인 지표입니다. 각 가격대에서 매수 볼륨과 매도 볼륨을 분리하여 시각화하고 POC를 식별함으로써, 시장 참여자들이 어디서 의사결정을 내렸는지, 어디에 주요 지지/저항 레벨이 존재하는지 이해할 수 있도록 돕습니다.
특히 Hidden Volume Detector와 함께 사용하면 완전한 볼륨 분석 시스템을 구축할 수 있습니다. Hidden Volume은 개별 캔들에서의 실시간 매수/매도 압력을 보여줘 정확한 진입/청산 타이밍을 제공하고, Smart Volume Profile은 가격대별 누적된 매수/매도 구간을 보여줘 전략적 계획 수립을 지원합니다. 이러한 조합은 트레이더들이 미시적·거시적 관점 모두에서 시장 역학을 해석할 수 있게 하여, 궁극적으로 더 정보에 기반한 효과적인 매매 의사결정을 가능하게 합니다.
─────────────────────────────────────
※ 면책 조항: 본 지표는 투자 판단을 위한 보조 도구로 제공되며, 단독 의존해서는 안 됩니다. 과거 데이터에 기반한 분석이므로 미래 결과를 보장하지 않습니다. Volume Profile은 횡보장에서 가장 효과적이며 강한 추세 상황에서는 신뢰도가 낮을 수 있습니다. 적절한 리스크 관리와 함께 사용하시기 바랍니다.
