Custom Gold Pivot LevelsThis indicator plots custom resistance and support levels based on a central Ziro Pivot Level. The levels are adjusted dynamically based on whether you're preparing for a Buy or Sell trade. The script allows you to set percentage-based levels for both resistance and support, making it a versatile tool for traders.
Features:
Pivot Level: Set the central pivot level (Ziro Pivot) around which resistance and support levels are calculated.
Dynamic Resistance & Support Levels: Input your preferred percentages for Resistance 1, Resistance 2, Support 1 , and Support 2 .
For Buy: Resistance levels are higher, and support levels are lower.
For Sell: Resistance levels are adjusted lower, and support levels are adjusted higher.
Label Display: The indicator will display a Buy label in green above the pivot level or a Sell label in red below the pivot level, depending on the trade type you select.
Adjustable Parameters:
Ziro Pivot Level: Set the central pivot level.
Resistance & Support Levels: Adjust resistance and support levels using percentages.
Trade Type: Choose between "Buy" and "Sell" to dynamically adjust resistance and support levels.
Inputs:
1- Trade Type: Select between Buy or Sell to set the relevant resistance and support levels.
Ziro Pivot Level: Set the main pivot level around which all other levels are calculated.
Resistance Level 1 & 2: Input percentages for Resistance 1 and Resistance 2.
Support Level 1 & 2: Input percentages for Support 1 and Support 2.
How to Use:
1- Select "Buy" or "Sell" from the input options.
For Buy: The indicator will plot higher resistance levels and lower support levels.
For Sell: The indicator will plot lower resistance levels and higher support levels.
2- Adjust the Pivot Level: Set the central pivot level for the levels to be calculated around.
3- Adjust the Resistance & Support Percentages: Modify the resistance and support levels to fit your trading strategy.
4- Visual Feedback: The indicator will show a Buy label in green above the pivot level or a Sell label in red below the pivot level, making it easy to identify the trade direction at a glance.
Use Cases:
Gold & Commodity Trading: This tool is particularly useful for traders working with commodities like gold, where pivot levels can help determine potential price action points.
Swing & Day Trading: The dynamic nature of this indicator makes it great for both swing and day traders who want to monitor short-term market movements.
Support and Resistance Strategy: Traders who rely on support and resistance levels to make buy/sell decisions can use this indicator to automate and visualize these levels more effectively.
Pivot points and levels

Pivot S/R with Volatility Filter## *📌 Indicator Purpose*
This indicator identifies *key support/resistance levels* using pivot points while also:
✅ Detecting *high-volume liquidity traps* (stop hunts)
✅ Filtering insignificant pivots via *ATR (Average True Range) volatility*
✅ Tracking *test counts and breakouts* to measure level strength
---
## *⚙ SETTINGS – Detailed Breakdown*
### *1️⃣ ◆ General Settings*
#### *🔹 Pivot Length*
- *Purpose:* Determines how many bars to analyze when identifying pivots.
- *Usage:*
- *Low values (5-20):* More pivots, better for scalping.
- *High values (50-200):* Fewer but stronger levels for swing trading.
- *Example:*
- Pivot Length = 50 → Only the most significant highs/lows over 50 bars are marked.
#### *🔹 Test Threshold (Max Test Count)*
- *Purpose:* Sets how many times a level can be tested before being invalidated.
- *Example:*
- Test Threshold = 3 → After 3 tests, the level is ignored (likely to break).
#### *🔹 Zone Range*
- *Purpose:* Creates a price buffer around pivots (±0.001 by default).
- *Why?* Markets often respect "zones" rather than exact prices.
---
### *2️⃣ ◆ Volatility Filter (ATR)*
#### *🔹 ATR Period*
- *Purpose:* Smoothing period for Average True Range calculation.
- *Default:* 14 (standard for volatility measurement).
#### *🔹 ATR Multiplier (Min Move)*
- *Purpose:* Requires pivots to show *meaningful price movement*.
- *Formula:* Min Move = ATR × Multiplier
- *Example:*
- ATR = 10 pips, Multiplier = 1.5 → Only pivots with *15+ pip swings* are valid.
#### *🔹 Show ATR Filter Info*
- Displays current ATR and minimum move requirements on the chart.
---
### *3️⃣ ◆ Volume Analysis*
#### *🔹 Volume Change Threshold (%)*
- *Purpose:* Filters for *unusual volume spikes* (institutional activity).
- *Example:*
- Threshold = 1.2 → Requires *120% of average volume* to confirm signals.
#### *🔹 Volume MA Period*
- *Purpose:* Lookback period for "normal" volume calculation.
---
### *4️⃣ ◆ Wick Analysis*
#### *🔹 Wick Length Threshold (Ratio)*
- *Purpose:* Ensures rejection candles have *long wicks* (strong reversals).
- *Formula:* Wick Ratio = (Upper Wick + Lower Wick) / Candle Range
- *Example:*
- Threshold = 0.6 → 60% of the candle must be wicks.
#### *🔹 Min Wick Size (ATR %)*
- *Purpose:* Filters out small wicks in volatile markets.
- *Example:*
- ATR = 20 pips, MinWickSize = 1% → Wicks under *0.2 pips* are ignored.
---
### *5️⃣ ◆ Display Settings*
- *Show Zones:* Toggles support/resistance shaded areas.
- *Show Traps:* Highlights liquidity traps (▲/▼ symbols).
- *Show Tests:* Displays how many times levels were tested.
- *Zone Transparency:* Adjusts opacity of zones.
---
## *🎯 Practical Use Cases*
### *1️⃣ Liquidity Trap Detection*
- *Scenario:* Price spikes *above resistance* then reverses sharply.
- *Requirements:*
- Long wick (Wick Ratio > 0.6)
- High volume (Volume > Threshold)
- *Outcome:* *Short Trap* signal (▼) appears.
### *2️⃣ Strong Support Level*
- *Scenario:* Price bounces *3 times* from the same level.
- *Indicator Action:*
- Labels the level with test count (3/5 = 3 tests out of max 5).
- Turns *red* if broken (Break Count > 0).
Deep Dive: How This Indicator Works*
This indicator combines *four professional trading concepts* into one powerful tool:
1. *Classic Pivot Point Theory*
- Identifies swing highs/lows where price previously reversed
- Unlike basic pivot indicators, ours uses *confirmed pivots only* (filtered by ATR)
2. *Volume-Weighted Validation*
- Requires unusual trading volume to confirm levels
- Filters out "phantom" levels with low participation
3. *ATR Volatility Filtering*
- Eliminates insignificant price swings in choppy markets
- Ensures only meaningful levels are plotted
4. *Liquidity Trap Detection*
- Spots institutional stop hunts where markets fake out traders
- Uses wick analysis + volume spikes for high-probability signals
---
## *📊 Parameter Encyclopedia (Expanded)*
### *1️⃣ Pivot Engine Settings*
#### *Pivot Length (50)*
- *What It Does:*
Determines how many bars to analyze when searching for swing highs/lows.
- *Professional Adjustment Guide:*
| Trading Style | Recommended Value | Why? |
|--------------|------------------|------|
| Scalping | 10-20 | Captures short-term levels |
| Day Trading | 30-50 | Balanced approach |
| Swing Trading| 50-200 | Focuses on major levels |
- *Real Market Example:*
On NASDAQ 5-minute chart:
- Length=20: Identifies levels holding for ~2 hours
- Length=50: Finds levels respected for entire trading day
#### *Test Threshold (5)*
- *Advanced Insight:*
Institutions often test levels 3-5 times before breaking them. This setting mimics the "probe and push" strategy used by smart money.
- *Psychology Behind It:*
Retail traders typically give up after 2-3 tests, while institutions keep testing until stops are run.
---
### *2️⃣ Volatility Filter System*
#### *ATR Multiplier (1.0)*
- *Professional Formula:*
Minimum Valid Swing = ATR(14) × Multiplier
- *Market-Specific Recommendations:*
| Market Type | Optimal Multiplier |
|------------------|--------------------|
| Forex Majors | 0.8-1.2 |
| Crypto (BTC/ETH) | 1.5-2.5 |
| SP500 Stocks | 1.0-1.5 |
- *Why It Matters:*
In EUR/USD (ATR=10 pips):
- Multiplier=1.0 → Requires 10 pip swings
- Multiplier=1.5 → Requires 15 pip swings (fewer but higher quality levels)
---
### *3️⃣ Volume Confirmation System*
#### *Volume Threshold (1.2)*
- *Institutional Benchmark:*
- 1.2x = Moderate institutional interest
- 1.5x+ = Strong smart money activity
- *Volume Spike Case Study:*
*Before Apple Earnings:*
- Normal volume: 2M shares
- Spike threshold (1.2): 2.4M shares
- Actual volume: 3.1M shares → STRONG confirmation
---
### *4️⃣ Liquidity Trap Detection*
#### *Wick Analysis System*
- *Two-Filter Verification:*
1. *Wick Ratio (0.6):*
- Ensures majority of candle shows rejection
- Formula: (UpperWick + LowerWick) / Total Range > 0.6
2. *Min Wick Size (1% ATR):*
- Prevents false signals in flat markets
- Example: ATR=20 pips → Min wick=0.2 pips
- *Trap Identification Flowchart:*
Price Enters Zone →
Spikes Beyond Level →
Shows Long Wick →
Volume > Threshold →
TRAP CONFIRMED
---
## *💡 Master-Level Usage Techniques*
### *Institutional Order Flow Analysis*
1. *Step 1:* Identify pivot levels with ≥3 tests
2. *Step 2:* Watch for volume contraction near levels
3. *Step 3:* Enter when trap signal appears with:
- Wick > 2×ATR
- Volume > 1.5× average
### *Multi-Timeframe Confirmation*
1. *Higher TF:* Find weekly/monthly pivots
2. *Lower TF:* Use this indicator for precise entries
3. *Example:*
- Weekly pivot at $180
- 4H shows liquidity trap → High-probability reversal
---
## *⚠ Critical Mistakes to Avoid*
1. *Using Default Settings Everywhere*
- Crude oil needs higher ATR multiplier than bonds
2. *Ignoring Trap Context*
- Traps work best at:
- All-time highs/lows
- Major psychological numbers (00/50 levels)
3. *Overlooking Cumulative Volume*
- Check if volume is building over multiple tests

ZRK 30m This TradingView indicator draws alternating 30-minute boxes aligned precisely to real clock times (e.g., 10:00, 10:30, 11:00), helping traders visually segment intraday price action. It highlights every other 30-minute block with customizable colors, line styles, and opacity, allowing users to clearly differentiate between trading intervals. The boxes automatically adjust based on the chart’s timeframe, maintaining accuracy on 1-minute to 60-minute charts. Optional time labels can also be displayed for additional context. This tool is useful for identifying patterns, measuring volatility, or applying breakout strategies based on defined, consistent time windows across global trading sessions.

StatPivot- Dynamic Range Analyzer - indicator [PresentTrading]Hello everyone! In the following few open scripts, I would like to share various statistical tools that benefit trading. For this time, it is a powerful indicator called StatPivot- Dynamic Range Analyzer that brings a whole new dimension to your technical analysis toolkit.
This tool goes beyond traditional pivot point analysis by providing comprehensive statistical insights about price movements, helping you identify high-probability trading opportunities based on historical data patterns rather than subjective interpretations. Whether you're a day trader, swing trader, or position trader, StatPivot's real-time percentile rankings give you a statistical edge in understanding exactly where current price action stands within historical contexts.
Welcome to share your opinions! Looking forward to sharing the next tool soon!
█ Introduction and How it is Different
StatPivot is an advanced technical analysis tool that revolutionizes retracement analysis. Unlike traditional pivot indicators that only show static support/resistance levels, StatPivot delivers dynamic statistical insights based on historical pivot patterns.
Its key innovation is real-time percentile calculation - while conventional tools require new pivot formations before updating (often too late for trading decisions), StatPivot continuously analyzes where current price stands within historical retracement distributions.
Furthermore, StatPivot provides comprehensive statistical metrics including mean, median, standard deviation, and percentile distributions of price movements, giving traders a probabilistic edge by revealing which price levels represent statistically significant zones for potential reversals or continuations. By transforming raw price data into statistical insights, StatPivot helps traders move beyond subjective price analysis to evidence-based decision making.
█ Strategy, How it Works: Detailed Explanation
🔶 Pivot Point Detection and Analysis
The core of StatPivot's functionality begins with identifying significant pivot points in the price structure. Using the parameters left and right, the indicator locates pivot highs and lows by examining a specified number of bars to the left and right of each potential pivot point:
Copyp_low = ta.pivotlow(low, left, right)
p_high = ta.pivothigh(high, left, right)
For a point to qualify as a pivot low, it must have left higher lows to its left and right higher lows to its right. Similarly, a pivot high must have left lower highs to its left and right lower highs to its right. This approach ensures that only significant turning points are recognized.
🔶 Percentage Change Calculation
Once pivot points are identified, StatPivot calculates the percentage changes between consecutive pivot points:
For drops (when a pivot low is lower than the previous pivot low):
CopydropPercent = (previous_pivot_low - current_pivot_low) / previous_pivot_low * 100
For rises (when a pivot high is higher than the previous pivot high):
CopyrisePercent = (current_pivot_high - previous_pivot_high) / previous_pivot_high * 100
These calculations quantify the magnitude of each market swing, allowing for statistical analysis of historical price movements.
🔶 Statistical Distribution Analysis
StatPivot computes comprehensive statistics on the historical distribution of drops and rises:
Average (Mean): The arithmetic mean of all recorded percentage changes
CopyavgDrop = array.avg(dropValues)
Median: The middle value when all percentage changes are arranged in order
CopymedianDrop = array.median(dropValues)
Standard Deviation: Measures the dispersion of percentage changes from the average
CopystdDevDrop = array.stdev(dropValues)
Percentiles (25th, 75th): Values below which 25% and 75% of observations fall
Copyq1 = array.get(sorted, math.floor(cnt * 0.25))
q3 = array.get(sorted, math.floor(cnt * 0.75))
VaR95: The maximum expected percentage drop with 95% confidence
Copyvar95D = array.get(sortedD, math.floor(nD * 0.95))
Coefficient of Variation (CV): Measures relative variability
CopycvD = stdDevDrop / avgDrop
These statistics provide a comprehensive view of market behavior, enabling traders to understand the typical ranges and extreme moves.
🔶 Real-time Percentile Ranking
StatPivot's most innovative feature is its real-time percentile calculation. For each current price, it calculates:
The percentage drop from the latest pivot high:
CopycurrentDropPct = (latestPivotHigh - close) / latestPivotHigh * 100
The percentage rise from the latest pivot low:
CopycurrentRisePct = (close - latestPivotLow) / latestPivotLow * 100
The percentile ranks of these values within the historical distribution:
CopyrealtimeDropRank = (count of historical drops <= currentDropPct) / total drops * 100
This calculation reveals exactly where the current price movement stands in relation to all historical movements, providing crucial context for decision-making.
🔶 Cluster Analysis
To identify the most common retracement zones, StatPivot performs a cluster analysis by dividing the range of historical drops into five equal intervals:
CopyrangeSize = maxVal - minVal
For each interval boundary:
Copyboundaries = minVal + rangeSize * i / 5
By counting the number of observations in each interval, the indicator identifies the most frequently occurring retracement zones, which often serve as significant support or resistance areas.
🔶 Expected Price Targets
Using the statistical data, StatPivot calculates expected price targets:
CopytargetBuyPrice = close * (1 - avgDrop / 100)
targetSellPrice = close * (1 + avgRise / 100)
These targets represent statistically probable price levels for potential entries and exits based on the average historical behavior of the market.
█ Trade Direction
StatPivot functions as an analytical tool rather than a direct trading signal generator, providing statistical insights that can be applied to various trading strategies. However, the data it generates can be interpreted for different trade directions:
For Long Trades:
Entry considerations: Look for price drops that reach the 70-80th percentile range in the historical distribution, suggesting a statistically significant retracement
Target setting: Use the Expected Sell price or consider the average rise percentage as a reasonable target
Risk management: Set stop losses below recent pivot lows or at a distance related to the statistical volatility (standard deviation)
For Short Trades:
Entry considerations: Look for price rises that reach the 70-80th percentile range, indicating an unusual extension
Target setting: Use the Expected Buy price or average drop percentage as a target
Risk management: Set stop losses above recent pivot highs or based on statistical measures of volatility
For Range Trading:
Use the most common drop and rise clusters to identify probable reversal zones
Trade bounces between these statistically significant levels
For Trend Following:
Confirm trend strength by analyzing consecutive higher pivot lows (uptrend) or lower pivot highs (downtrend)
Use lower percentile retracements (20-30th percentile) as entry opportunities in established trends
█ Usage
StatPivot offers multiple ways to integrate its statistical insights into your trading workflow:
Statistical Table Analysis: Review the comprehensive statistics displayed in the data table to understand the market's behavior. Pay particular attention to:
Average drop and rise percentages to set reasonable expectations
Standard deviation to gauge volatility
VaR95 for risk assessment
Real-time Percentile Monitoring: Watch the real-time percentile display to see where the current price movement stands within the historical distribution. This can help identify:
Extreme movements (90th+ percentile) that might indicate reversal opportunities
Typical retracements (40-60th percentile) that might continue further
Shallow pullbacks (10-30th percentile) that might represent continuation opportunities in trends
Support and Resistance Identification: Utilize the plotted pivot points as key support and resistance levels, especially when they align with statistically significant percentile ranges.
Target Price Setting: Use the expected buy and sell prices calculated from historical averages as initial targets for your trades.
Risk Management: Apply the statistical measurements like standard deviation and VaR95 to set appropriate stop loss levels that account for the market's historical volatility.
Pattern Recognition: Over time, learn to recognize when certain percentile levels consistently lead to reversals or continuations in your specific market, and develop personalized strategies based on these observations.
█ Default Settings
The default settings of StatPivot have been carefully calibrated to provide reliable statistical analysis across a variety of markets and timeframes, but understanding their effects allows for optimal customization:
Left Bars (30) and Right Bars (30): These parameters determine how pivot points are identified. With both set to 30 by default:
A pivot low must be the lowest point among 30 bars to its left and 30 bars to its right
A pivot high must be the highest point among 30 bars to its left and 30 bars to its right
Effect on performance: Larger values create fewer but more significant pivot points, reducing noise but potentially missing important market structures. Smaller values generate more pivot points, capturing more nuanced movements but potentially including noise.
Table Position (Top Right): Determines where the statistical data table appears on the chart.
Effect on performance: No impact on analytical performance, purely a visual preference.
Show Distribution Histogram (False): Controls whether the distribution histogram of drop percentages is displayed.
Effect on performance: Enabling this provides visual insight into the distribution of retracements but can clutter the chart.
Show Real-time Percentile (True): Toggles the display of real-time percentile rankings.
Effect on performance: A critical setting that enables the dynamic analysis of current price movements. Disabling this removes one of the key advantages of the indicator.
Real-time Percentile Display Mode (Label): Chooses between label display or indicator line for percentile rankings.
Effect on performance: Labels provide precise information at the current price point, while indicator lines show the evolution of percentile rankings over time.
Advanced Considerations for Settings Optimization:
Timeframe Adjustment: Higher timeframes generally benefit from larger Left/Right values to identify truly significant pivots, while lower timeframes may require smaller values to capture shorter-term swings.
Volatility-Based Tuning: In highly volatile markets, consider increasing the Left/Right values to filter out noise. In less volatile conditions, lower values can help identify more potential entry and exit points.
Market-Specific Optimization: Different markets (forex, stocks, commodities) display different retracement patterns. Monitor the statistics table to see if your market typically shows larger or smaller retracements than the current settings are optimized for.
Trading Style Alignment: Adjust the settings to match your trading timeframe. Day traders might prefer settings that identify shorter-term pivots (smaller Left/Right values), while swing traders benefit from more significant pivots (larger Left/Right values).
By understanding how these settings affect the analysis and customizing them to your specific market and trading style, you can maximize the effectiveness of StatPivot as a powerful statistical tool for identifying high-probability trading opportunities.

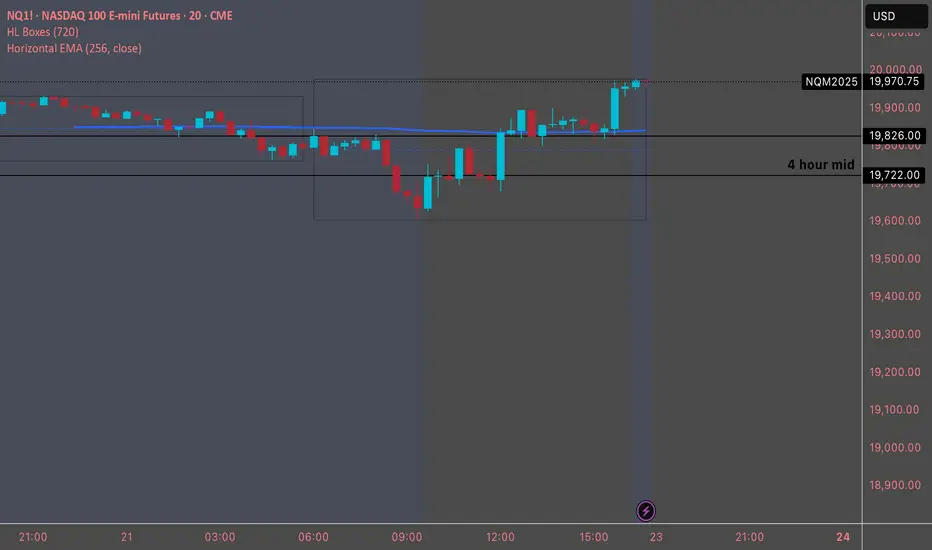
Horizontal EMADesigned to plot a horizontal Exponential Moving Average (EMA) line on a TradingView chart. The script allows users to specify the period and source for the EMA calculation. The line remains fixed at the calculated EMA value, providing a visual reference for the trend over the specified period. The script uses version 5 of Pine Script and draws a blue horizontal line at the EMA value on the chart, updating as new data is available.
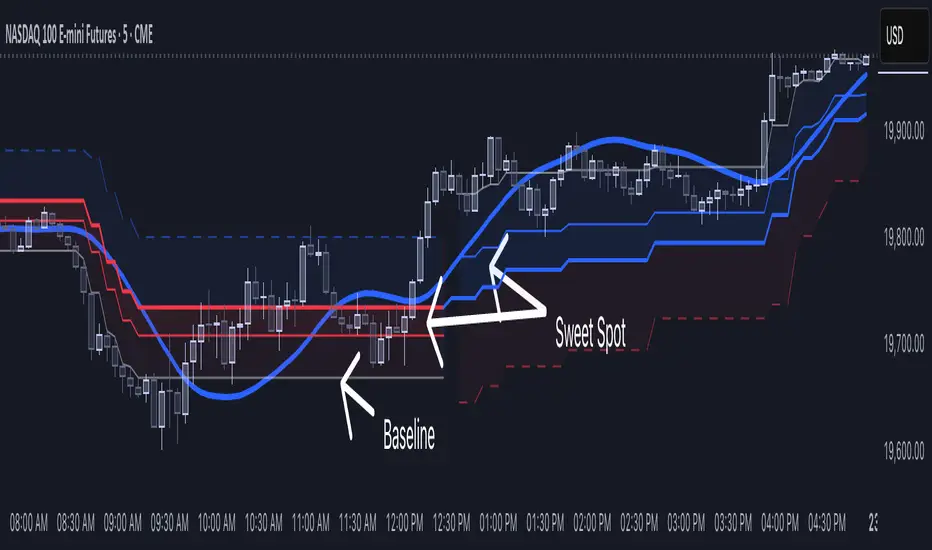
[NLR] - SweetSpot ZonesThe Sweet Spot Zone helps you find the best spots to enter a trade, inspired by the " Follow Line Indicator " by Dreadblitz (big thanks to him!). It draws a colored zone on your chart to show ideal entry points, with a Base Point to keep you on track.
What It Does
Blue Zone: Uptrend—buy when the price dips into the zone.
Red Zone: Downtrend—sell or short when the price climbs into the zone.
Base Point: A gray line showing the key level the zone is built on.
How to Use It
Look for the colored zone:
- Blue: Buy if the price dips into the zone but stays above the Base Point.
- Red: Sell/short if the price climbs into the zone but stays below the Base Point.
Important: Avoid entering trade beyond base point - you might see low returns and face big drawdowns.
Confirm with other signals (like RSI/MACD) before entering.
Settings
ATR Length (10): How far back it looks to calculate price movement.
ATR Multiplier (2.5): How wide the zone is.
Error Margin (5.0): Keeps the zone steady during small price wiggles.
Uptrend/Downtrend Colors: Change the zone colors if you’d like!
Credits
Inspired by the "Follow Line Indicator" by Dreadblitz—check out his work for more great ideas!
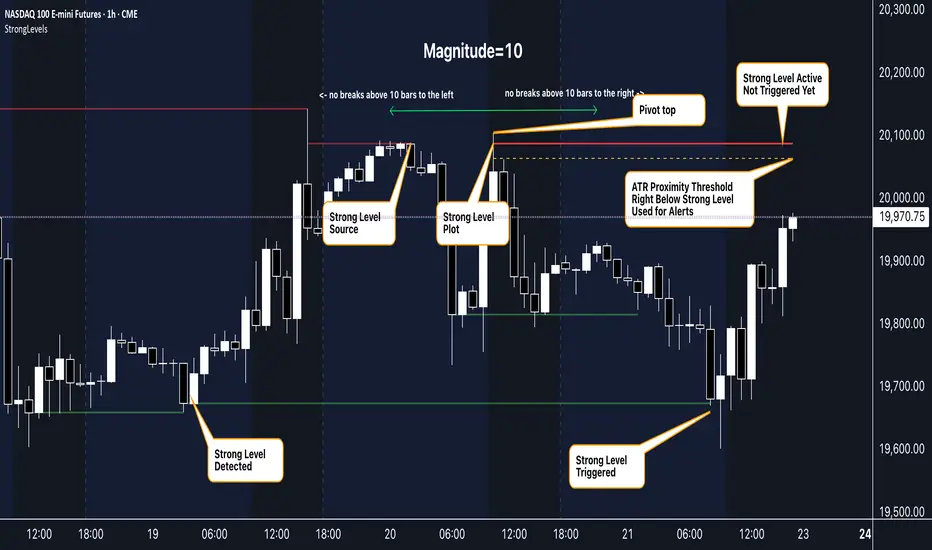
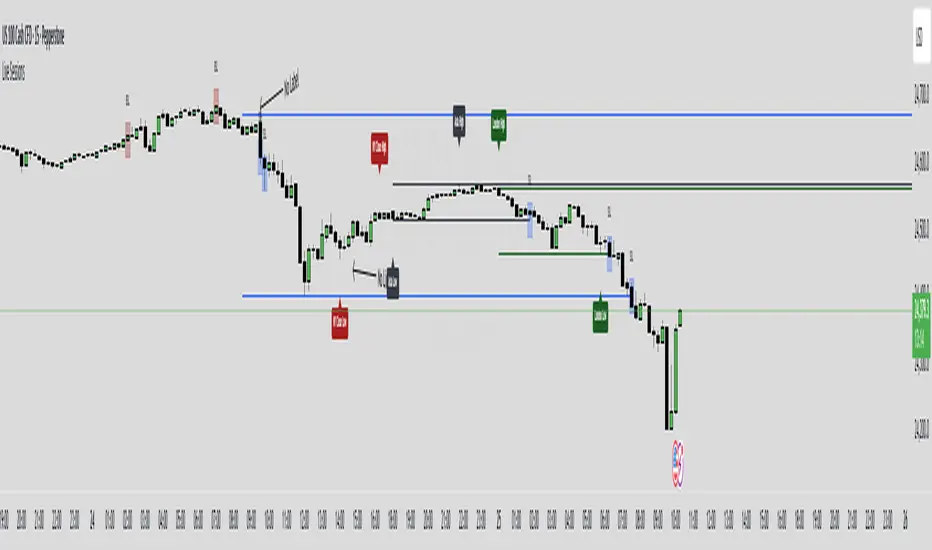
Strong Levels (with Proximity Alerts)█ OVERVIEW
The "Strong Levels (with Proximity Alerts)" indicator offers a fresh approach to identifying support and resistance levels, inspired by the RexDog Trading System (RDTS). It pinpoints significant price reversals using a unique filtering method that reduces noise and enhances reliability. Paired with customizable ATR-based proximity alerts, this indicator empowers traders to track critical price zones with precision.
█ FEATURES
- Rooted in RDTS :
Inspired by the RexDog Trading System (RDTS), it highlights major pivot points where price executed sharp turnarounds, ensuring levels carry true market weight.
- Second-Highest/Lowest Open/Close Method :
Resistance levels use the *second-highest open/close* near pivot highs, while support levels use the *second-lowest open/close* near pivot lows—skipping extreme wicks for cleaner, more dependable lines.
- ATR-Driven Proximity Alerts :
Customizable proximity thresholds, calculated using the Average True Range (ATR), warn traders when price approaches key levels—a standout feature not found in most support/resistance indicators.
- Flexible Customization :
- Magnitude : Tweak pivot sensitivity (default: 10).
- Line Colors : Set resistance (red by default), support (green), and proximity (yellow) lines.
- Line Options : Adjust line origins, transparency for breached levels, and the maximum number of levels shown.
- ATR Settings : Fine-tune proximity sensitivity with ATR length and multiplier.
█ HOW TO USE
1. Add to Chart :
Find "Strong Levels (with Proximity Alerts)" in TradingView’s indicator library and apply it.
2. Read the Lines :
- Red Lines : Resistance, derived from the second-highest open/close near pivot highs.
- Green Lines : Support, based on the second-lowest open/close near pivot lows.
- Yellow Dashed Lines : Proximity thresholds (optional), signaling when price nears a level.
3. Customize :
- Raise `Magnitude` for stronger levels or lower it for more detail.
- Adjust colors, transparency, and max levels to fit your preferences.
- Toggle proximity thresholds on/off based on your trading style.
- Enabling *Plot Line from Actual Pivot Bar* offers a cleaner chart but may mislead as lines plot into the past.
4. Set Alerts :
- Open TradingView’s alert menu (the three dots ... dropdown menu next in indicator list has an option "Add alert on ...") and choose "Approaching Level" or "Level Touched.".
- Don't forget to choose the right Trigger condition, which by default is "Only Once". I usually set it to "Once Per Bar".
- Tailor alert conditions to your needs.
█ LIMITATIONS
- Past-Based Levels :
- Relying on historical pivots, it may not always forecast future moves, especially in rapid markets.
- The 'Plot Line from Actual Pivot Bar' option while visually appealing can imply historical significance that didn’t exist at the time. Be mindful of that.
- Volatility Sensitivity :
High volatility widens ATR-based thresholds, which might trigger alerts too soon.
- Display Management :
A cap on max levels avoids clutter, but tweaking `Max Levels` may be needed across timeframes.
█ ACCOMPANYING CHART
The chart showcases the indicator’s unique edge:
- A pivot high and low are flagged, with nearby bars highlighted.
- Resistance is plotted at the *second-highest open/close* around the pivot high, bypassing the highest wick.
- Support is set at the *second-lowest open/close* near the pivot low, ignoring the deepest wick.
- Yellow dashed proximity lines illustrate how the indicator warns traders as price nears these zones.
- Annotations clarify how skipping extreme wicks creates cleaner, more actionable levels.
█ HOW TO USE
1. Add to Chart :
Locate "Strong Levels (with Proximity Alerts)" in TradingView’s indicator library and apply it to your chart.
2. Read the Lines :
- Red Lines**: Resistance levels, calculated from the second-highest open/close near pivot highs.
- Green Lines : Support levels, derived from the second-lowest open/close near pivot lows.
- Yellow Dashed Lines : Optional proximity thresholds, alerting you when price nears a level.
3. Customize :
- Increase `Magnitude` for stronger, less frequent levels or decrease it for more granularity.
- Modify colors, transparency, or the maximum number of levels to suit your style.
- Enable or disable proximity thresholds as needed.
4. Set Alerts :
- Access TradingView’s alert menu and select "Approaching Level" or "Level Touched."
- Adjust conditions to match your trading preferences.
5. My Personal Approach :
I prefer using this indicator on higher timeframes, like hourly or daily charts. I adjust my `Magnitude`, so it doesn't trigger too often and set my alerts to trigger "Once Per Bar". When price nears a level, I get an alert and I anticipate a reaction but avoid placing limit orders blindly. Instead, I switch to smaller timeframes and combine it with other tools for confirmation before making a trade. This saves me a lot of screen time, and allows me to focus when it matters.
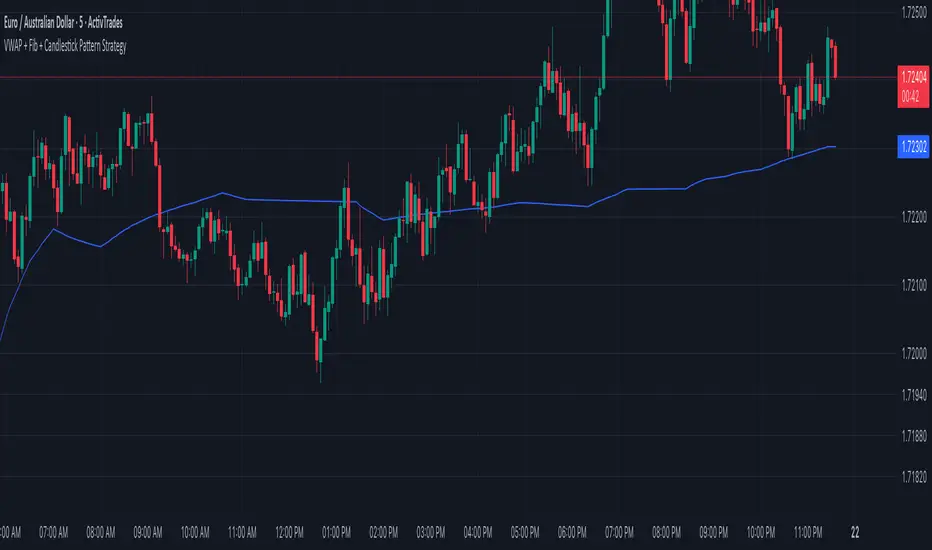
VWAP + Fib + Candlestick Pattern Strategy### **VWAP + Fibonacci + Candlestick Pattern Strategy (v6)**
This indicator is designed to identify high-quality trading setups using a combination of **Anchored VWAP, Fibonacci Retracement Levels, and Candlestick Patterns**. It helps traders find optimal entry points where multiple confluences align, enhancing trade accuracy.
### **Key Features:**
✅ **Anchored VWAP** – Starts from the last pivot low (bullish) or pivot high (bearish) to determine trend strength.
✅ **Fibonacci Levels** – Uses key retracement levels (0.382, 0.5, 0.618, 0.786) for added confluence.
✅ **Candlestick Patterns** – Detects Pin Bars, Engulfing Candles, and Hammer Candles for potential reversals.
✅ **High-Quality Setups** – Highlights strong signals where price aligns with VWAP & Fib zones.
✅ **Alerts** – Get notified when a bullish or bearish setup is detected.
✅ **Risk Management** – Includes Take Profit (TP1, TP2, Final TP) & Stop Loss based on ATR.
✅ **Position Sizing** – Calculates position size based on a fixed dollar risk per trade.
### **How to Use:**
1. Apply the indicator to your chart.
2. Look for signals near Fibonacci retracement levels and VWAP.
3. Use alerts for real-time trade notifications.
4. Manage risk with built-in TP/SL and position sizing.
Perfect for traders who use **Price Action & Smart Money Concepts** to refine their entries! 🚀
Volume Order Blocks [BigBeluga]Volume Order Blocks is a powerful indicator that identifies significant order blocks based on price structure, helping traders spot key supply and demand zones. The tool leverages EMA crossovers to determine the formation of bullish and bearish order blocks while visualizing their associated volume and relative strength.
🔵 Key Features:
Order Block Detection via EMA Crossovers:
Plots bullish order blocks at recent lows when the short EMA crosses above the long EMA.
Plots bearish order blocks at recent highs when the short EMA crosses below the long EMA.
Uses customizable sensitivity through the “Sensitivity Detection” setting to fine-tune block formation.
Volume Collection and Visualization:
Calculates the total volume between the EMA crossover bar and the corresponding high (bearish OB) or low (bullish OB).
Displays the absolute volume amount next to each order block for clear volume insights.
Percentage Volume Distribution:
Shows the percentage distribution of volume among bullish or bearish order blocks.
100% represents the cumulative volume of all OBs in the same category (bullish or bearish).
Order Block Removal Conditions:
Bullish order blocks are removed when the price closes below the bottom of the block.
Bearish order blocks are removed when the price closes above the top of the block.
Helps maintain chart clarity by only displaying relevant and active levels.
Midline Feature:
Dashed midline inside each order block indicates the midpoint between the upper and lower boundaries.
Traders can toggle the midline on or off through the settings.
Shadow Trend:
Shadow Trend dynamically visualizes trend strength and direction by adapting its color intensity based on price movement.
🔵 Usage:
Supply & Demand Zones: Use bullish and bearish order blocks to identify key market reversal or continuation points.
Volume Strength Analysis: Compare volume percentages to gauge which order blocks hold stronger market significance.
Breakout Confirmation: Monitor block removal conditions for potential breakout signals beyond support or resistance zones.
Trend Reversals: Combine EMA crossovers with order block formation for early trend reversal detection.
Risk Management: Use OB boundaries as potential stop-loss or entry points.
Volume Order Blocks is an essential tool for traders seeking to incorporate volume-based supply and demand analysis into their trading strategy. By combining price action, volume data, and EMA crossovers, it offers a comprehensive view of market structure and potential turning points.

Psych LevelWhat it shows:
This indicator will show a horizontal line at a psychological value which can be user defined. (Psychological values are round numbers, like 10,50,100,1000 and so on...)
At these Psychological value there are often limit orders placed for both buying and selling and can often act as support and resistances.
Therefore it is useful to pre-draw these levels beforehand and this indicator will speed up the process doing so by adjusting few different settings and draw them automatically.
How to use it:
At these Psychological value there are often limit orders placed for both buying and selling and can often act as support and resistances. This is often the case when you look at limit orders at such levels on bookmap or level 2 data.
At these psychological levels it can be set as a target of your trade or as risk levels when taking a trade in either of direction. Obviously this alone shouldn't dictate the trade you should take but can be a valuable info to supplement your trade.
On the chart it is clear to see these psychological level lines are acting as resistances/supports.
Key settings:
Interval: Interval levels will be drawn for, between the minimum and maximum values inputted by the user. Minimum value allowed is 1.
Min. value: Minimum value of Psychological level that will be drawn. Minimum value allowed is 1.
Max value: Maximum value of Psychological level that will be drawn. Minimum value allowed is 1.
Line colour: Colour of line drawn.
Line width: Width of line drawn.
Line style: Style of line drawn, either solid, dotted or dashed.
Label offset: Offset of where where label will be, measured from current bar. Offset of 0 will be drawn at current bar location, any positive number will move to the right by the set amount.
Text Colour: Colour of label text
Text size: Size of label text
Example: Chart here shows setting for minimum value as 100, maximum value as 140 and interval as 5. In this setting lines will be automatically drawn at: 100,105,110,115,120,125,130,145 and 140.
The flexibility of user defined max/min and interval values allows to be accommodated for price with different price tags, including stocks under $10.
----------------------------------------------------------------------
If anything is not clear please let me know!

MTF Fibonacci Pivots with Mandelbrot FractalsMTF Fibonacci Pivots with Mandelbrot Fractals: Advanced Market Structure Analysis
Overview
The MTF Fibonacci Pivots with Mandelbrot Fractals indicator represents a significant advancement in technical analysis by combining multi-timeframe Fibonacci pivot levels with sophisticated fractal pattern recognition. This powerful tool identifies key support and resistance zones while predicting potential price reversals with remarkable accuracy.
Key Capabilities
This indicator provides traders with three distinct layers of market structure analysis:
Automatic Timeframe Adaptation: The primary pivot set automatically adjusts to your chart's timeframe, ensuring relevant support and resistance levels for your specific trading horizon.
1-Year Fibonacci Pivots: The second layer displays yearly pivots that reveal long-term market cycles and institutional price levels that often act as significant reversal points.
3-Year Fibonacci Pivots: The third layer unveils major market structure zones that typically remain relevant for extended periods, offering strategic context for position trading and long-term investment decisions.
Predictive Technology
What truly distinguishes this indicator is its advanced predictive capability powered by:
Mandelbrot Fractal Pattern Recognition: The indicator implements a sophisticated fractal detection algorithm that identifies recurring price patterns across multiple timeframes. Unlike conventional fractal indicators, it incorporates noise filtering and adaptive sensitivity to market volatility.
Tesla's 3-6-9 Principle Integration: The system incorporates Nikola Tesla's mathematical principle through a cubic Mandelbrot equation (Z_{n+1} = Z_n^3 + C where Z_0 = 0), creating a unique approach to pattern recognition that aligns with natural market rhythms.
Historical Pattern Matching: When a current price pattern exhibits strong similarity to historical formations, the indicator generates predictive targets with confidence ratings. Each prediction undergoes rigorous validation against multiple parameters including trend alignment, volatility context, and mathematical coherence.
Visual Intelligence System
The indicator's visual presentation enhances trading decision-making through:
Confidence-Based Visualization: Predictions display with intuitive star ratings, percentage confidence scores, and contextual information including price movement magnitude and estimated time to target.
Adaptive Color Harmonization: The color system intelligently adjusts to provide optimal visibility while maintaining a professional appearance suitable for any chart setup.
Trend Alignment Indicators: Each prediction includes references to the broader trend context, helping traders avoid counter-trend trades unless the reversal signal carries exceptional strength.
Strategic Applications
This indicator excels in multiple trading scenarios:
Intraday Trading: Identify high-probability reversal zones with precise timing
Swing Trading: Anticipate significant market turns at key structural levels
Position Trading: Recognize major cycle shifts for strategic entry and exit
The automatic 1-year and 3-year Fibonacci pivots provide institutional-grade reference points that typically define major market movements. These longer timeframes reveal critical zones that might be invisible on shorter-term analysis, giving you a significant edge in understanding where price is likely to encounter substantial buying or selling pressure.
This innovative approach to market analysis combines classical Fibonacci mathematics with cutting-edge fractal theory to create a comprehensive market structure visualization system that illuminates both present support/resistance levels and future price targets with exceptional clarity.
Setting Up MTF Fibonacci Pivots with Mandelbrot Fractals
Initial Setup
Adding this indicator to your TradingView charts is straightforward:
Navigate to the "Indicators" button on your chart toolbar
Search for "MTF Fibonacci Pivots with Mandelbrot Fractals"
Select the indicator to add it to your chart
A configuration panel will appear with various setting categories
Recommended Settings
The indicator comes pre-configured with optimal default settings, but you may want to adjust them based on your trading style:
For Day Trading (Timeframes 1-minute to 1-hour)
Pivots Timeframe 1: Auto (automatically adapts to your chart)
Pivots Timeframe 2: Daily
Pivots Timeframe 3: Weekly
Fractal Sensitivity: 2-3
Fractal Lookback Period: 20
Prediction Strength: 2
Color Theme: High Contrast or Dark Mode
For Swing Trading (Timeframes 4-hour to Daily)
Pivots Timeframe 1: Daily
Pivots Timeframe 2: Weekly
Pivots Timeframe 3: Monthly
Fractal Sensitivity: 1-2
Fractal Lookback Period: 30
Prediction Strength: 2-3
Color Theme: Default or Dimmed
For Position Trading (Timeframes Daily to Weekly)
Pivots Timeframe 1: Weekly
Pivots Timeframe 2: Monthly
Pivots Timeframe 3: Quarterly
Fractal Sensitivity: 1
Fractal Lookback Period: 50
Prediction Strength: 1
Color Theme: Monochrome or Pastel
Restoring Default Settings
If you've adjusted settings and wish to return to the defaults:
Right-click on the indicator name on your chart
Select "Settings" from the context menu
In the settings dialog, look for the "Reset All" button at the bottom
Confirm the reset when prompted
Alternatively, you can remove the indicator and add it again for a fresh start with default settings.
Advanced Settings Guidance
Visual Appearance
Use Gradient Colors: Enable for better visual differentiation between pivot levels
Color Transparency: 15% provides an optimal balance between visibility and chart clutter
Line Width: 1-2 for cleaner charts, 3+ for enhanced visibility
Fractal Analysis
Enable Fractal Analysis: Keep enabled for prediction capabilities
Fractal Box Spacing: Higher values (5-10) for cleaner displays, lower values (1-3) for more signals
Maximum Forecast Bars: 20 is optimal for most timeframes, adjust higher for longer predictions
Performance Considerations
Enable Self-Optimization: Keep enabled to maintain smooth chart performance
Resource Priority: Use "Balanced" for most computers, "Performance" for older systems
Force Pivot Display: Enable only when checking specific historical periods
Common Setup Mistakes to Avoid
Setting all timeframes too close together (e.g., Daily, Daily, Weekly) reduces the multi-timeframe advantage
Using high fractal sensitivity (4+) on noisy markets creates excessive signals
Setting fractal box spacing too low causes cluttered prediction boxes
Disabling self-optimization may cause performance issues on complex charts
Using incompatible color themes for your chart background reduces visibility
The indicator's power comes from its default 1-year and 3-year Fibonacci pivot settings, which highlight institutional levels while the auto-timeframe setting adapts to your trading horizon. These carefully balanced defaults provide an excellent starting point for most traders.
For optimal results, I recommend making minimal adjustments at first, then gradually customizing settings as you become familiar with the indicator's behavior in your specific markets and timeframes.
Screenshots:

Live SessionsLive sessions plots the highs and lows of the previous for sessions.
It also marks when these are broken by price.
Default Time Frames are:
London Session = "0000-0600", "UTC-4"
New York Session = "0830-1230", "UTC-4"
Asia Session = "1800-0000", "UTC-4"
New York Close Session = "1330-1630", "UTC-4"
Useful for highlighting when price has gone through a previous session high or low and quickly seeing where liquidity still lies.
Fibonacci - DolphinTradeBot
OVERVIEW
The 'Fibonacci - DolphinTradeBot' indicator is a Pine Script-based tool for TradingView that dynamically identifies key Fibonacci retracement levels using ZigZag price movements. It aims to replicate the Fibonacci Retracement tool available in TradingView’s drawing tools. The indicator calculates Fibonacci levels based on directional price changes, marking critical retracement zones such as 0, 0.236, 0.382, 0.5, 0.618, 0.786, and 1.0 on the chart. These levels are visualized with lines and labels, providing traders with precise areas of potential price reversals or trend continuation.
HOW IT WORKS ?
The indicator follows a zigzag formation. After a large swing movement, when new swings are formed without breaking the upper and lower levels, it places Fibonacci levels at the beginning and end points of the major swing movement."
▪️(Bullish) Structure :High → HigherLow → LowerHigh
▪️(Bearish) Structure :Low → LowerHigh → HigherLow
▪️When Fibonacci retracement levels are determined, a "📌" mark appears on the chart.
▪️If the price closes outside of these levels, a "❌" mark will appear.
USAGE
This indicator is designed to plot Fibonacci levels within an accumulation zone following significant price movements, helping you identify potential support and resistance. You can adjust the pivot periods to customize the zigzag settings to your preference. While classic Fibonacci levels are used by default, you also have the option to input custom levels and assign your preferred colors.
Set the Fibonacci direction option to "upward" to detect only bullish structures, "downward" to detect only bearish structures, and "both" to see both at the same time.
"To view past levels, simply enable the ' Show Previous Levels ' option, and to display the zigzag lines, activate the ' Show Zigzag ' setting."
ALERTS
The indicator, by default, triggers an alarm when both a level is formed and when a level is broken. However, if you'd like, you can select the desired level from the " Select Level " section in the indicator settings and set the alarm based on one of the conditions below.
▪️ cross-up → If the price breaks the Fibonacci level to the upside.
▪️ cross-down → If the price breaks the Fibonacci level to the downside.
▪️ cross-any → If the price breaks the Fibonacci level in any direction.

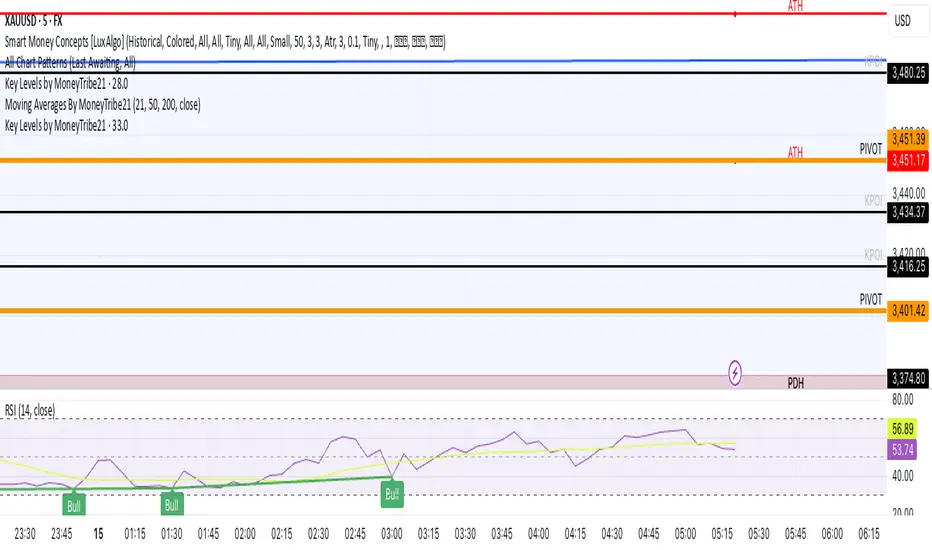
Key Levels by MoneyTribe21This custom script provides real-time tracking of key market price levels, helping traders identify critical support and resistance zones. It dynamically updates throughout the trading session, making it ideal for intraday trading, breakout strategies, and market structure analysis.
Features:
Real-Time Tracking of Key Price Levels:
ATH (All-Time High): Tracks the highest price ever reached for the asset.
PDH (Previous Day High): Marks the high of the last trading day,
PDL (Previous Day Low): Marks the low of the last trading day, serving as dynamic support.
Resistance Level: Based on the current day’s high, signaling potential price rejection points.
Support Level: Based on the current day’s low, indicating potential price bounces.
Daily Open Price: Tracks the exact market open price at the start of the trading session.
Works Across All Timeframes:
Designed for intraday, swing, and long-term trading.
Automatically adjusts levels for Forex, Stocks, Crypto, and Indices.
Fully Customizable Settings:
Modify line colors, thickness, and styles for better chart readability.
Enable/disable specific levels based on trading preference.
Works on all TradingView-compatible brokers and platforms.
How to Use This Indicator:
Breakout & Reversal Trading:
If price breaks above PDH, it may indicate bullish momentum.
If price breaks below PDL, it may signal a bearish continuation.
ATH levels can act as strong resistance zones—watch for breakouts or rejection.
Dynamic Support & Resistance:
Resistance Level (Current Day High): If price fails to break, it may signal a reversal.
Support Level (Current Day Low): If price bounces off, it may confirm a strong uptrend.
Daily Open for Trend Confirmation:
Above Daily Open: Market sentiment is bullish.
Below Daily Open: Market sentiment is bearish.
Customization Options:
Toggle individual price levels ON/OFF for a clutter-free chart.
Customize colors, line styles, and alerts for better visualization.
Set alerts for breakouts & retests of key levels.
Ideal for Traders Who:
Want high-probability support & resistance zones in real-time.
Trade breakouts, reversals, or trend continuations.
Use market structure analysis for informed decision-making.
Need automatic price tracking instead of drawing levels manually.
Compatible with all TradingView timeframes & assets (Forex, Stocks, Crypto, Indices).
Designed for both beginner and advanced traders.
Add this indicator to your chart and start tracking key levels instantly.
Liquidity Zones [ActiveQuants]The Liquidity Zones indicator detects price areas where high trading volume coincides with below-average volatility , critical zones where large players often accumulate or distribute positions. Ideal for spotting potential reversal points and strategic liquidity pools.
Core Detection Formula
Liquidity Zone = (Volume > SMA(Volume, Length) × Multiplier) AND (Short-Term Volatility < 0.5 × Average Volatility)
Volume Surge Detection
Compares current volume to its SMA (user-defined length).
Multiplies threshold with " Volume Threshold Multiplier " parameter.
Volatility Contraction Filter
Calculates 5-bar volatility (standard deviation of closes).
Compares to average volatility over " Price Std. Dev. Length " period.
Requires short-term volatility < 50% of average.
█ KEY FEATURES
Merging Consecutive Zones
If the " Merge Consecutive Zones " option is enabled, the indicator will:
Calculate the number of consecutive bars that meet the liquidity zone criteria.
Sum the volume of these consecutive bars.
Display only the most recent label for the merged zone (previous labels in the sequence are removed).
Displays volume in either
Raw units (" Units ").
Dollar-equivalent (" Currency Value ") using closing price.
Alerts
An alert condition is built into the script. Traders can selectively enable alerts via TradingView’s alert system. Whenever a liquidity zone is detected, an alert is triggered with the message: " High-volume and low-volatility zone detected! ".
█ USER INPUTS
- Liquidity Zones Color
Sets the background color for liquidity zones.
Default: Orange (with 70 transparency).
- Volume SMA Length
Determines the number of bars over which the volume simple moving average is calculated.
Default: 20 bars.
- Volume Threshold Multiplier
Multiplies the volume SMA to establish a threshold. A bar’s volume must exceed this product to be considered high volume.
Default: 2.0.
- Price Std. Dev. Length
The period used to calculate the standard deviation of the closing prices. This is the basis for measuring average volatility.
Default: 14 bars.
- Zone Volume
A toggle to display a label with the volume value on liquidity zones.
Allows you to choose how the volume is displayed: Units (shows raw volume) or Currency Value (multiplies volume by the current closing price).
Allows you to choose the font size of the volume label.
- Merge Consecutive Zones
When enabled, volumes from consecutive liquidity zones are summed into a single total, and only the most recent label is displayed (previous labels in the sequence are removed).
Default: Enabled.
- Show Last
Specifies the number of bars back that the indicator will evaluate and plot liquidity zones.
Default: 500 bars.
- Timeframe
Analysis period.
Default: Chart.
█ CONCLUSION
The Liquidity Zones indicator is a powerful tool for traders seeking to identify key areas on the chart where liquidity is concentrated, characterized by high volume and low volatility . With customizable settings for volume analysis and volatility measurement , this indicator can be integrated into a wide range of trading strategies. It not only highlights these zones visually but also provides volume data labels and alerts for timely decision-making.
█ IMPORTANT NOTES
⚠ Volume and Volatility Settings: Adjust the Volume SMA Length , Volume Threshold Multiplier , and Price Std. Dev. Length to suit the typical trading volume and volatility of the asset you are analyzing.
⚠ Confirmed Bars Only: Signals are generated only on confirmed bars. This minimizes false signals due to intra-bar noise and also prevents indicator repainting .
⚠ Risk Management: Liquidity zones may signal areas of potential accumulation or distribution, but they should be used in conjunction with other technical analysis tools (e.g., support/resistance levels, trendlines, or momentum indicators). Trading involves risk, and it is recommended to combine this indicator with proper risk management techniques.
█ RISK DISCLAIMER
Trading involves substantial risk of loss. Liquidity zones indicate potential interest areas but don't guarantee price reactions. Always confirm with additional analysis and proper risk management. Past performance is not indicative of future results.
📈 Happy trading! 🚀

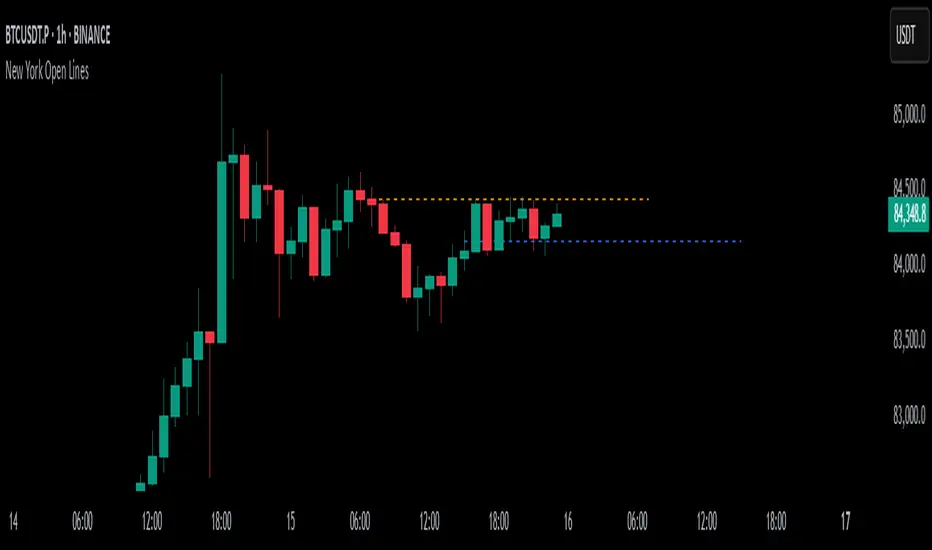
New York Open LinesThis indicator marks key New York trading session opens on the chart. It draws horizontal lines at the New York Midnight Open (00:00 NY time) and the New York Economic Open (08:30 NY time) prices.
Key Features:
1) Customizable Line Styles & Colors:
* Users can choose between solid, dotted, or dashed lines.
* Colors are customizable for each open level.
2) Timeframe-Based Logic:
* For timeframes above 30 minutes:
- It retrieves the midnight (NYMO) and 8:30 AM (ETO) open prices using request.security_lower_tf().
- The script ensures the price is stored only once per day.
* For 30-minute timeframes and below:
- The script draws lines at the exact open prices as bars appear.
3) Line Management:
* The lines extend for 24 hours from the open.
* The previous day's lines are removed to keep the chart clean.
4) Session Reset:
* At the start of a new trading day, the stored NYMO and ETO prices reset to na to prepare for the next session.
This helps traders quickly identify key New York session levels, often used for support, resistance, and breakout trading strategies.