Correlation HeatMap Matrix Data [TradingFinder]🔵 Introduction
Correlation is a statistical measure that shows the degree and direction of a linear relationship between two assets.
Its value ranges from -1 to +1 : +1 means perfect positive correlation, 0 means no linear relationship, and -1 means perfect negative correlation.
In financial markets, correlation is used for portfolio diversification, risk management, pairs trading, intermarket analysis, and identifying divergences.
Correlation HeatMap Matrix Data TradingFinder is a Pine Script v6 library that calculates and returns raw correlation matrix data between up to 20 symbols. It only provides the data – it does not draw or render the heatmap – making it ideal for use in other scripts that handle visualization or further analysis. The library uses ta.correlation for fast and accurate calculations.
It also includes two helper functions for visual styling :
CorrelationColor(corr) : takes the correlation value as input and generates a smooth gradient color, ranging from strong negative to strong positive correlation.
CorrelationTextColor(corr) : takes the correlation value as input and returns a text color that ensures optimal contrast over the background color.
Library
"Correlation_HeatMap_Matrix_Data_TradingFinder"
CorrelationColor(corr)
Parameters:
corr (float)
CorrelationTextColor(corr)
Parameters:
corr (float)
Data_Matrix(Corr_Period, Sym_1, Sym_2, Sym_3, Sym_4, Sym_5, Sym_6, Sym_7, Sym_8, Sym_9, Sym_10, Sym_11, Sym_12, Sym_13, Sym_14, Sym_15, Sym_16, Sym_17, Sym_18, Sym_19, Sym_20)
Parameters:
Corr_Period (int)
Sym_1 (string)
Sym_2 (string)
Sym_3 (string)
Sym_4 (string)
Sym_5 (string)
Sym_6 (string)
Sym_7 (string)
Sym_8 (string)
Sym_9 (string)
Sym_10 (string)
Sym_11 (string)
Sym_12 (string)
Sym_13 (string)
Sym_14 (string)
Sym_15 (string)
Sym_16 (string)
Sym_17 (string)
Sym_18 (string)
Sym_19 (string)
Sym_20 (string)
🔵 How to use
Import the library into your Pine Script using the import keyword and its full namespace.
Decide how many symbols you want to include in your correlation matrix (up to 20). Each symbol must be provided as a string, for example FX:EURUSD .
Choose the correlation period (Corr\_Period) in bars. This is the lookback window used for the calculation, such as 20, 50, or 100 bars.
Call Data_Matrix(Corr_Period, Sym_1, ..., Sym_20) with your selected parameters. The function will return an array containing the correlation values for every symbol pair (upper triangle of the matrix plus diagonal).
For example :
var string Sym_1 = '' , var string Sym_2 = '' , var string Sym_3 = '' , var string Sym_4 = '' , var string Sym_5 = '' , var string Sym_6 = '' , var string Sym_7 = '' , var string Sym_8 = '' , var string Sym_9 = '' , var string Sym_10 = ''
var string Sym_11 = '', var string Sym_12 = '', var string Sym_13 = '', var string Sym_14 = '', var string Sym_15 = '', var string Sym_16 = '', var string Sym_17 = '', var string Sym_18 = '', var string Sym_19 = '', var string Sym_20 = ''
switch Market
'Forex' => Sym_1 := 'EURUSD' , Sym_2 := 'GBPUSD' , Sym_3 := 'USDJPY' , Sym_4 := 'USDCHF' , Sym_5 := 'USDCAD' , Sym_6 := 'AUDUSD' , Sym_7 := 'NZDUSD' , Sym_8 := 'EURJPY' , Sym_9 := 'EURGBP' , Sym_10 := 'GBPJPY'
,Sym_11 := 'AUDJPY', Sym_12 := 'EURCHF', Sym_13 := 'EURCAD', Sym_14 := 'GBPCAD', Sym_15 := 'CADJPY', Sym_16 := 'CHFJPY', Sym_17 := 'NZDJPY', Sym_18 := 'AUDNZD', Sym_19 := 'USDSEK' , Sym_20 := 'USDNOK'
'Stock' => Sym_1 := 'NVDA' , Sym_2 := 'AAPL' , Sym_3 := 'GOOGL' , Sym_4 := 'GOOG' , Sym_5 := 'META' , Sym_6 := 'MSFT' , Sym_7 := 'AMZN' , Sym_8 := 'AVGO' , Sym_9 := 'TSLA' , Sym_10 := 'BRK.B'
,Sym_11 := 'UNH' , Sym_12 := 'V' , Sym_13 := 'JPM' , Sym_14 := 'WMT' , Sym_15 := 'LLY' , Sym_16 := 'ORCL', Sym_17 := 'HD' , Sym_18 := 'JNJ' , Sym_19 := 'MA' , Sym_20 := 'COST'
'Crypto' => Sym_1 := 'BTCUSD' , Sym_2 := 'ETHUSD' , Sym_3 := 'BNBUSD' , Sym_4 := 'XRPUSD' , Sym_5 := 'SOLUSD' , Sym_6 := 'ADAUSD' , Sym_7 := 'DOGEUSD' , Sym_8 := 'AVAXUSD' , Sym_9 := 'DOTUSD' , Sym_10 := 'TRXUSD'
,Sym_11 := 'LTCUSD' , Sym_12 := 'LINKUSD', Sym_13 := 'UNIUSD', Sym_14 := 'ATOMUSD', Sym_15 := 'ICPUSD', Sym_16 := 'ARBUSD', Sym_17 := 'APTUSD', Sym_18 := 'FILUSD', Sym_19 := 'OPUSD' , Sym_20 := 'USDT.D'
'Custom' => Sym_1 := Sym_1_C , Sym_2 := Sym_2_C , Sym_3 := Sym_3_C , Sym_4 := Sym_4_C , Sym_5 := Sym_5_C , Sym_6 := Sym_6_C , Sym_7 := Sym_7_C , Sym_8 := Sym_8_C , Sym_9 := Sym_9_C , Sym_10 := Sym_10_C
,Sym_11 := Sym_11_C, Sym_12 := Sym_12_C, Sym_13 := Sym_13_C, Sym_14 := Sym_14_C, Sym_15 := Sym_15_C, Sym_16 := Sym_16_C, Sym_17 := Sym_17_C, Sym_18 := Sym_18_C, Sym_19 := Sym_19_C , Sym_20 := Sym_20_C
= Corr.Data_Matrix(Corr_period, Sym_1 ,Sym_2 ,Sym_3 ,Sym_4 ,Sym_5 ,Sym_6 ,Sym_7 ,Sym_8 ,Sym_9 ,Sym_10,Sym_11,Sym_12,Sym_13,Sym_14,Sym_15,Sym_16,Sym_17,Sym_18,Sym_19,Sym_20)
Loop through or index into this array to retrieve each correlation value for your custom layout or logic.
Pass each correlation value to CorrelationColor() to get the corresponding gradient background color, which reflects the correlation’s strength and direction (negative to positive).
For example :
Corr.CorrelationColor(SYM_3_10)
Pass the same correlation value to CorrelationTextColor() to get the correct text color for readability against that background.
For example :
Corr.CorrelationTextColor(SYM_1_1)
Use these colors in a table or label to render your own heatmap or any other visualization you need.
Portfolio

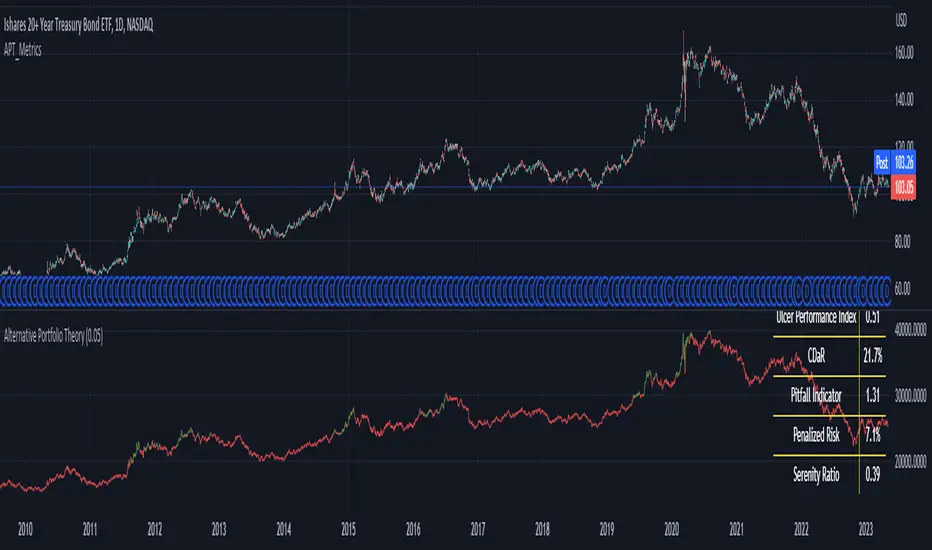
Metrics using Alternative Portfolio TheoryLibrary "APT_Metrics"
Portfolio metrics using alternative portfolio theory
metrics(init, cur, start, end, alpha)
Calculates APT metrics
Parameters:
init (float) : Starting Equity (strategy.initial)
cur (float)
start (int) : Start date (UNIX)
end (int) : End Date (UNIX)
alpha (float) : Confidence interval for DaR/CDaR. Defval = 0.05
Returns: Plots table with APT metrics
The metrics are shown in the bottom pane being applied to a buy-and-hold strategy.
PLEASE NOTE: This is the first draft of the library. Some calculations may be incorrect. If you spot any mistakes then please let me know and I will correct them as soon as possible. I am also open to suggestions on how to improve this.
At the moment this only works on the daily timeframe until I can find a way to universally calculate annualized volatility.
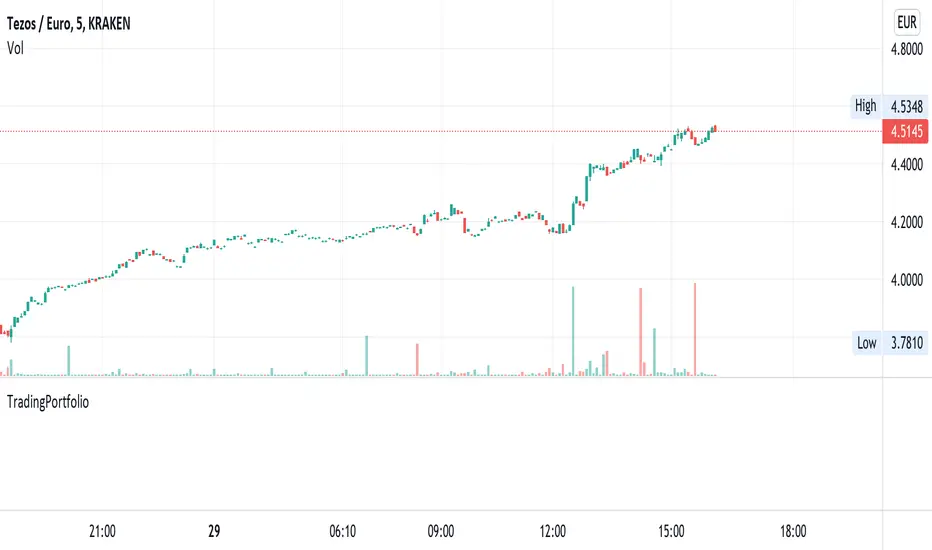
TradingPortfolioLibrary "TradingPortfolio"
Simple functions for portfolio management. A portfolio is essentially
a float array with 3 positions that gets passed around
into these functions that ensure it gets properly updated as trading ensues.
An example usage:
import hugodanielcom/TradingPortfolio/XXXX as portfolio
var float my_portfolio = portfolio.init(0.0, strategy.initial_capital) // Initialize the portfolio with the strategy capital
if close < 10.0
portfolio.buy(my_portfolio, 10.0, close) // Buy when the close is below 10.0
plot(portfolio.total(my_portfolio), title = "Total portfolio value")
get_balance(portfolio) Gets the number of tokens and fiat available in the supplied portfolio.
Parameters:
portfolio : A portfolio float array as created by the `init()` function.
Returns: The tokens and fiat in a tuple
set_balance(portfolio, new_crypto, new_fiat) Sets the portfolio number of tokens and fiat amounts. This function overrides the current values in the portfolio and sets the provided ones as the new portfolio.
Parameters:
portfolio : A portfolio float array as created by the `init()` function.
new_crypto : The new amount of tokens in the portfolio.
new_fiat : The new amount of fiat in the portfolio
Returns: The tokens and fiat in a tuple
init(crypto, fiat) This function returns a clean portfolio. Start by calling this function and pass its return value as an argument to the other functions in this library.
Parameters:
crypto : The initial amount of tokens in the portfolio (defaults to 0.0).
fiat : The initial amount of fiat in the portfolio (defaults to 0.0).
Returns: The portfolio (a float )
crypto(portfolio) Gets the number of tokens in the portfolio
Parameters:
portfolio : A portfolio float array as created by the `init()` function.
Returns: The amount of tokens in the portfolio
fiat(portfolio) Gets the fiat in the portfolio
Parameters:
portfolio : A portfolio float array as created by the `init()` function.
Returns: The amount of fiat in the portfolio
retained(portfolio) Gets the amount of reatined fiat in the portfolio. Retained fiat is not considered as part of the balance when buying/selling, but it is considered as part of the total of the portfolio.
Parameters:
portfolio : A portfolio float array as created by the `init()` function.
Returns: The amount of retained fiat in the portfolio
retain(portfolio, fiat_to_retain) Sets the amount of fiat to retain. It removes the amount from the current fiat in the portfolio and marks it as retained.
Parameters:
portfolio : A portfolio float array as created by the `init()` function.
fiat_to_retain : The amount of fiat to remove and mark as retained.
Returns: void
total(portfolio, token_value) Calculates the total fiat value of the portfolio. It multiplies the amount of tokens by the supplied value and adds to the result the current fiat and retained amount.
Parameters:
portfolio : A portfolio float array as created by the `init()` function.
token_value : The fiat value of a unit (1) of token
Returns: A float that corresponds to the total fiat value of the portfolio (retained amount included)
ratio(portfolio, token_value) Calculates the ratio of tokens / fiat. The retained amount of fiat is not considered, only the active fiat being considered for trading.
Parameters:
portfolio : A portfolio float array as created by the `init()` function.
token_value : The fiat value of a unit (1) of token
Returns: A float between 1.0 and 0.0 that corresponds to the portfolio ratio of token / fiat (i.e. 0.6 corresponds to a portfolio whose value is made by 60% tokens and 40% fiat)
can_buy(portfolio, amount, token_value) Asserts that there is enough balance to buy the requested amount of tokens.
Parameters:
portfolio : A portfolio float array as created by the `init()` function.
amount : The amount of tokens to assert that can be bought
token_value : The fiat value of a unit (1) of token
Returns: A boolean value, true if there is capacity to buy the amount of tokens provided.
can_sell(portfolio, amount) Asserts that there is enough token balance to sell the requested amount of tokens.
Parameters:
portfolio : A portfolio float array as created by the `init()` function.
amount : The amount of tokens to assert that can be sold
Returns: A boolean value, true if there is capacity to sold the amount of tokens provided.
buy(portfolio, amount, token_value) Adjusts the portfolio state to perform the equivalent of a buy operation (as in, buy the requested amount of tokens at the provided value and set the portfolio accordingly).
Parameters:
portfolio : A portfolio float array as created by the `init()` function.
amount : The amount of tokens to buy
token_value : The fiat value of a unit (1) of token
Returns: A boolean value, true the requested amount of tokens was "bought" and the portfolio updated. False if nothing was changed.
sell(portfolio, amount, token_value) Adjusts the portfolio state to perform the equivalent of a sell operation (as in, sell the requested amount of tokens at the provided value and set the portfolio accordingly).
Parameters:
portfolio : A portfolio float array as created by the `init()` function.
amount : The amount of tokens to sell
token_value : The fiat value of a unit (1) of token
Returns: A boolean value, true the requested amount of tokens was "sold" and the portfolio updated. False if nothing was changed.