D.Y Volume Swing Strategy📌 Summary of the Daniel.Yer Volume Strategy
This strategy is based on identifying the "opening volume peak" at the start of each trading day, using a user-defined sampling window.
After the sampling period ends, the strategy looks for breakouts above the daily high or below the daily low, provided they occur with a strong high-volume candle that meets the user-set threshold.
When a breakout appears in one direction, the strategy waits for an opposite-direction confirmation candle (Reversal Confirmation) and then enters a smart counter-breakout trade.
Each trade includes dynamic Stop-Loss and Take-Profit levels calculated from recent price structure, with the option to multiply stop distance according to user preference.
The strategy also gives full control over entering long only, short only, or both, as well as choosing whether trades occur exclusively from the high/low or without restrictions.
The strategy can be tested on any timeframe and evaluated across four trading directions:
✔ Buy from High
✔ Sell from High
✔ Buy from Low
✔ Sell from Low
Price/Earnings Ratio (P/E Ratio)

Simple Time-Based Strategy(Price Action Hypothesis)Core Theory: Trend Continuation Pattern Recognition**
1. **Price Action Hypothesis**
The strategy is built on the assumption that consecutive price movements (3-bar patterns) indicate momentum continuation:
- *Long Pattern*: Three consecutive higher closes combined with ascending highs
- *Short Pattern*: Three consecutive lower closes combined with descending lows
This reflects a belief that sustained directional price movement creates self-reinforcing trends that can be captured through simple pattern recognition.
2. **Time-Based Risk Management**
Implements a dynamic exit mechanism:
- *Training Phase*: 5-bar holding period (quick turnover)
- *Testing Phase*: 10-bar holding period (extended exposure)
This dual timeframe approach suggests the hypothesis that market conditions may require different holding durations in different market eras.
3. **Adaptive Market Hypothesis**
The structure incorporates two distinct phases:
- *Training Period (11 years)*: Pattern recognition without stop losses
- *Testing Period*: Pattern recognition with stop losses
This assumes markets may change character over time, requiring different risk parameters in different epochs.
4. **Asymmetric Risk Control**
Implements stop-losses only in the testing phase:
- Fixed 500-pip (point) stop distance
- Activated post-training period
This reflects a belief that historical patterns might need different risk constraints than real-time trading.
5. **Dual-Path Validation**
The split between training/testing phases suggests:
- Pattern validity should first be confirmed without protective stops
- Real-world implementation requires added risk constraints
6. **Market Efficiency Paradox**
The simultaneous use of both long/short entries assumes:
- Markets exhibit persistent inefficiencies
- These inefficiencies manifest differently in bullish/bearish conditions
- A symmetric approach can capture opportunities in both directions
7. **Behavioral Finance Elements**
The 3-bar pattern recognition potentially exploits:
- Herd mentality in trend formation
- Delayed reaction to price momentum
- Cognitive bias in trend confirmation
8. **Quantitative Time Segmentation**
The annual-based period division (training vs testing) implies:
- Market cycles operate on multi-year timeframes
- Strategy robustness requires validation across different market regimes
- Parameter sensitivity needs temporal validation
This strategy combines elements of technical pattern recognition, temporal adaptability, and phased risk management to create a systematic approach to trend exploitation. The theoretical framework suggests markets exhibit persistent but evolving patterns that can be systematically captured through rule-based execution.

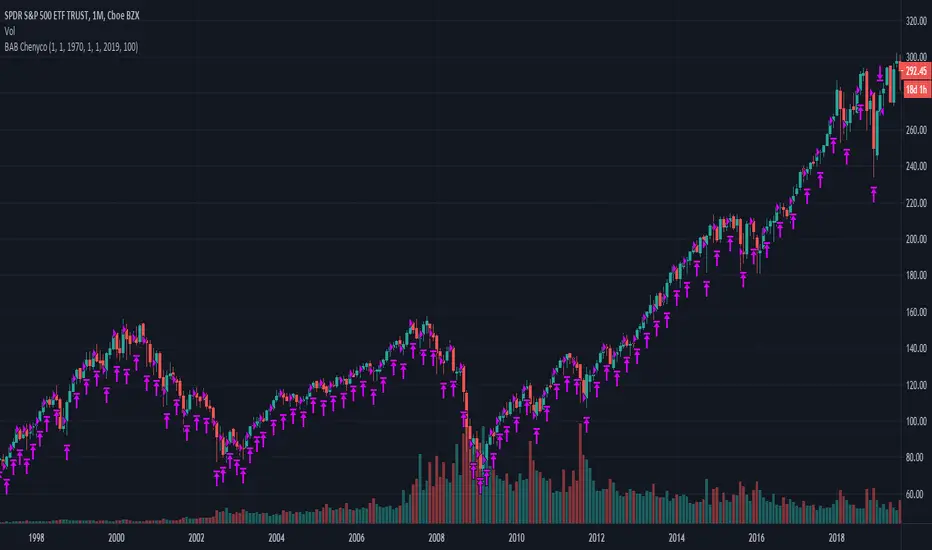
Buy Any Bar By ChenycoBuys amount of shares by bars with specified amount of money (100$ for a month bar for example).
Including commissions.

Stupid strategyStrategy with simple stop-loss and take-profit in percentage. If last trade was a successful one then repeat it. If not successful - do a reversal trade.
