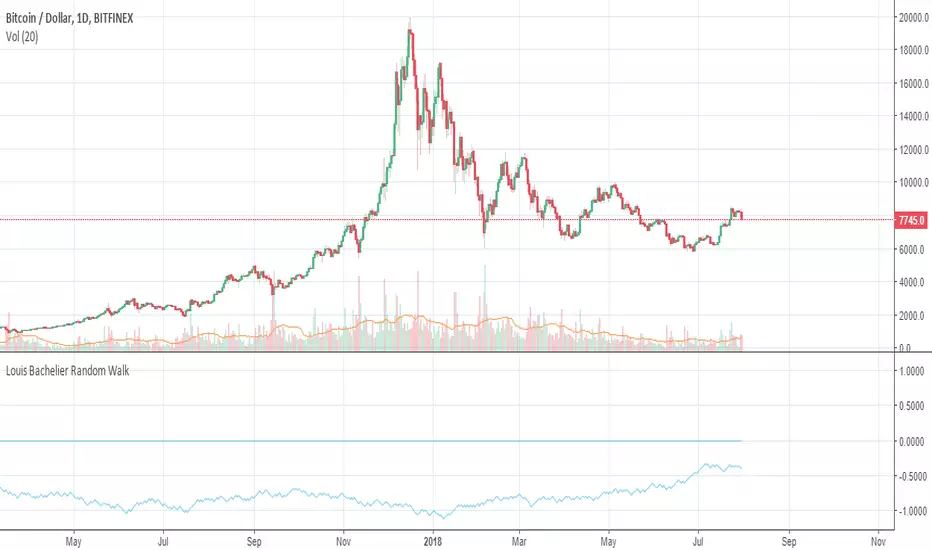
This script shows the average count of 'up bars' vs. 'down bars'. It is intended for statistic and probability purposes only. It does not include high or low price in the calculation - only the open and close prices are used.
Under settings, click "show difference" to see the difference between the two averages. This can also be called positive/negative drift....
Several tests of market efficiency have been developed over the years. The very first test, constructed by Louis Bachelier in 1900, measured the probability of a number of consecutively positive or consecutively negative price changes, or “runs.”
The randomness of runs is rejected with 95 percent statistical confidence whenever the plotted value is greater than 0....
Random Walk Index indicator script. This indicator was originally developed by Michael Poulos.
As you can see, the result is very similar to the Vortex Indicator (was developed by Etienne Botes and Douglas Siepman).