[GYTS-Pro] Market Regime Detector🧊 Market Regime Detector (Professional Edition)
🌸 Part of GoemonYae Trading System (GYTS) 🌸
🌸 --------- INTRODUCTION --------- 🌸
💮 What is the Market Regime Detector?
The Market Regime Detector (Pro) is an elite, consensus-based market state analyzer designed to filter noise and identify the true underlying market structure. By distinguishing between trending (bullish or bearish) and cyclic (range-bound) market conditions with high precision, this detector acts as the "brain" of your trading system. Instead of forcing a single strategy across incompatible market conditions, the detector empowers you to deploy the right tactic at exactly the right time.
💮 The Importance of Market Regimes
Markets constantly shift between different behavioural states or "regimes":
• Bullish trending markets - characterised by sustained upward price movement
• Bearish trending markets - characterised by sustained downward price movement
• Cyclic markets - characterised by range-bound, oscillating behaviour
Each regime requires fundamentally different trading approaches. Trend-following strategies excel in trending markets but fail in cyclic ones, while mean-reversion strategies shine in cyclic markets but underperform in trending conditions. However, detecting these regimes is easier said than done, and we have gone through hundreds of hours of testing to create the Market Regime Detector, using multiple very sophisticated methods in an easy-to-use indicator.
💮 Professional vs Community Edition
The Market Regime Detector comes in two versions: a comprehensive Professional Edition and a streamlined Community Edition.
Key advantages of the Professional Edition:
• Enhanced detection accuracy - Utilises 5 advanced detection methods (compared to only 2 in the CE version)
• Proprietary cycle measurement - Automatically detects the market's dominant cycle instead of requiring manual input
• Superior consensus mechanism - Includes a unique "strength-weighted decision" mode that gives more influence to stronger signals
• Reduced false signals - Multiple complementary methods working together provide more reliable regime identification
• Advanced DSP algorithms - Implements sophisticated digital signal processing techniques for superior market analysis
The Professional Edition delivers significant improvements in detection accuracy, signal stability, and overall trading performance.
🌸 --------- KEY FEATURES --------- 🌸
💮 Consensus-Based Detection
Rather than relying on a single method, our detector employs multiple complementary detection methodologies that analyse different aspects of market behaviour:
• Advanced digital signal processing techniques
• Volatility and momentum analysis
• Adaptive filters and mathematical transformations
• Cycle identification
• Channel breakout detection
These diverse perspectives are synthesised into a robust consensus that minimises false signals while maintaining responsiveness to genuine regime changes.
💮 Proprietary Dominant Cycle Measurement ( Pro Edition only )
At the heart of our Professional Edition detector is a proprietary dominant cycle measurement system that automatically and adaptively identifies the market's natural rhythm. This system provides a stable reference framework that continuously adapts to changing market conditions while avoiding the erratic behaviour of typical cycle-finding algorithms like Hilbert Transforms, Discrete Fourier Transforms, or autocorrelation measurements.
Unlike the Community Edition which requires manual input of a single, constant dominant cycle period, the Professional Edition automatically detects and continuously adapts this critical parameter. This automated and adaptive approach ensures optimal detection accuracy across different markets and timeframes without requiring user expertise in cycle analysis, and provides significantly better responsiveness to evolving market conditions.
💮 Intuitive Parameter System
We've distilled complex technical parameters into intuitive controls that traders can easily understand:
• Adaptability - how quickly the detector responds to changing market conditions
• Sensitivity - how readily the detector identifies transitions between regimes
• Consensus requirement - how much agreement is needed among detection methods
This approach makes the detector accessible to traders of all experience levels while preserving the power of the underlying algorithms.
💮 Visual Market Feedback
The detector provides clear visual feedback about the current market regime through:
• Colour-coded chart backgrounds (purple shades for bullish, pink for bearish, yellow for cyclic)
• Colour-coded price bars
• Strength indicators showing the degree of consensus
• Customisable color schemes to match your preferences or trading system
💮 Integration in the GYTS suite
What is of paramount importance, is that the Market Regime Detector is compatible with the GYTS Suite , i.e. it passes the regime into the Order Orchestrator where you can set how to trade the trending and cyclic regime. The intention is to integrate it with more indicators.
🌸 --------- CONFIGURATION SETTINGS --------- 🌸
💮 Adaptability
Controls how quickly the Market Regime detector adapts to changing market conditions. You can see it as a low-frequency, long-term change parameter:
• Very Low: Very slow adaptation, most stable but may miss regime changes
• Low: Slower adaptation, more stability but less responsiveness
• Normal: Balanced between stability and responsiveness
• High: Faster adaptation, more responsive but less stable
• Very High: Very fast adaptation, highly responsive but may generate false signals
This setting affects lookback periods and filter parameters across all detection methods.
💮 Sensitivity
Controls the conviction threshold required to trigger a regime change. This acts as a high-frequency, short-term filter for market noise:
• Very Low: Requires overwhelming evidence to identify a regime change.
• Low: Prioritizes stability; reduces false signals but may delay transition detection.
• Normal: Balanced sensitivity suitable for most liquid markets.
• High: Highly responsive; detects subtle regime changes early but may react to market noise.
• Very High: Extremely sensitive; detects minor fluctuations immediately.
Pro Feature Note: In the Strength-Weighted Decision mode, this setting acts as a dynamic calibrator. It not only adjusts individual method thresholds but also scales the global consensus threshold . A 'High' sensitivity lowers the barrier for the weighted consensus, allowing the system to react to early-stage breakouts even if not all methods fully agree yet.
💮 Consensus Mode
Determines how the signals from all detection methods are combined to produce the final market regime:
• Any Method (OR) : Signals bullish/bearish if any method detects that regime. If methods conflict, the stronger signal wins. More sensitive, catches more regime changes but may produce more false signals.
• All Methods (AND) : Signals only when all methods agree on the regime. More conservative, reduces false signals but might miss some legitimate regime changes.
• Weighted Decision : Balances all methods with equal voting rights. Signals bullish/bearish when the weighted consensus reaches a fixed majority (0.5). Provides a middle ground between sensitivity and stability.
• Strength-Weighted Decision ( Pro Edition only ): A "meritocratic" approach where methods reporting extreme confidence (high signal strength) are given proportionally more weight than those reporting weak signals. Unlike standard voting, a single clear signal from a highly reliable method can override indecision from others.
Note: The threshold for this decision is dynamically calibrated by your 'Sensitivity' setting, ensuring the logic adapts to your desired risk profile.
Each mode also calculates a continuous regime strength value that drives the color intensity in the 'unconstrained' display mode, giving you a visual heatmap of trend conviction.
💮 Display Mode
Choose how to display the market regime colours:
• Unconstrained regime: Shows the regime strength as a continuous gradient. This provides more nuanced visualisation where the intensity of the color indicates the strength of the trend.
• Consensus only: Shows only the final consensus regime with fixed colours based on the detected regime type.
The background and bar colours will change to indicate the current market regime:
• Purple shades : Bullish trending market. In 'unconstrained' mode, darker purple indicates a stronger bullish trend.
• Pink shades : Bearish trending market. In 'unconstrained' mode, darker pink indicates a stronger bearish trend.
• Yellow : Cyclic (range-bound) market.
💮 Custom Color Options
The Market Regime Detector allows you to customize the color scheme to match your personal preferences or to coordinate with other indicators:
• Use custom colours: Toggle to enable your own color choices instead of the default scheme
• Transparency: Adjust the transparency level of all regime colours
• Bullish colours: Define custom colours for strong, medium, weak, and very weak bullish trends
• Bearish colours: Define custom colours for strong, medium, weak, and very weak bearish trends
• Cyclic color: Define a custom color for cyclic (range-bound) market conditions
🌸 --------- DETECTION METHODS --------- 🌸
💮 Five-Method Consensus Architecture
The Professional Edition employs a sophisticated multi-stage architecture to determine market regimes with high precision.
The detection process flows through four logical stages:
1. Market Data & Cycle Detection
Price data flows into the system where the Dominant Cycle Detector automatically identifies the market's natural rhythm. This adaptive cycle length calibrates all subsequent calculations, ensuring the detector remains in sync with changing market conditions without manual adjustments.
2. Five Detection Methods
Using the detected cycle, five complementary algorithms independently evaluate the market state:
• Cyclic Centroid Analysis : Calculates the market's 'centre point' over its dominant cycle and measures price displacement to determine trend or equilibrium.
• Spectral Momentum : Measures momentum across the market's frequency spectrum to identify trend concentration.
• Energy Distribution Gauge : Gauges how price movement energy is distributed to flag cyclic or trending states.
• Volatility Channel : Models the market's volatility state, using band breakouts to indicate a trend.
• Phase Coherence Detector : Analyses phase relationships between adaptive low-pass filters to detect trend stability and identify early regime shifts.
3. Consensus Engine
The signals from all five methods are fed into the Consensus Engine. Depending on your configuration, it aggregates these votes using one of four logic modes (Any, All, Weighted, or Strength-Weighted) to filter out noise and confirm the true market regime.
4. Regime Output
The final result is broadcast as a clear market state:
• Bullish (1) : Trending upwards
• Bearish (-1) : Trending downwards
• Cyclic (0) : Range-bound or oscillating
This output drives the visual feedback on your chart and can be streamed directly to the Order Orchestrator for automated strategy switching.
💮 Synergy & Complementarity
What makes these methods powerful is not just their individual sophistication, but how they complement one another:
• Some excel at early detection while others provide confirmation
• Some analyse time-domain behaviour while others work in the frequency domain
• Some focus on momentum characteristics while others assess volatility patterns
• Some respond quickly to changes while others filter out market noise
This creates a comprehensive analytical framework that can detect regime changes more accurately than any single method. All methods utilize the automatically detected and continuously adaptive dominant cycle period, ensuring they remain precisely calibrated to current market conditions without manual intervention.
🌸 --------- USAGE GUIDE --------- 🌸
💮 Starting with Default Settings
The default settings (Normal for Adaptability, Sensitivity, and Consensus) provide a balanced starting point suitable for most markets and timeframes. Begin by observing how these settings identify regimes in your preferred instruments.
💮 Adjusting Parameters
• If you notice too many regime changes → Decrease Sensitivity or increase Consensus requirement
• If regime changes seem delayed → Increase Adaptability
• If a trending regime is not detected, the market is automatically assigned to be in a cyclic state. The majority of methods actually measure this explicitly.
• If you want to see more nuanced regime transitions → Try the "unconstrained" display mode (note that this will not affect the output to other indicators)
💮 Trading Applications
Regime-Specific Strategies:
• Bullish Trending Regime - Use trend-following strategies, trail stops wider, focus on breakouts, consider holding positions longer, and emphasise buying dips
• Bearish Trending Regime - Consider shorts, tighter stops, focus on breakdown points, sell rallies, implement downside protection, and reduce position sizes
• Cyclic Regime - Apply mean-reversion strategies, trade range boundaries, apply oscillators, target definable support/resistance levels, and use profit-taking at extremes
Strategy Switching:
Create a set of rules for each market regime and switch between them based on the detector's signal. This approach can significantly improve performance compared to applying a single strategy across all market conditions. The Pro Edition's multiple detection methods and advanced consensus mechanisms provide more reliable regime transitions, leading to better strategy switching decisions.
GYTS Suite Integration:
• In the GYTS 🎼 Order Orchestrator, select the '🔗 STREAM-int 🧊 Market Regime' as the market regime source
• Note that the consensus output (i.e. not the "unconstrained" display) will be used in this stream
• Create different strategies for trending (bullish/bearish) and cyclic regimes. The GYTS 🎼 Order Orchestrator is specifically made for this.
• The output stream is actually very simple, and can possibly be used in indicators and strategies as well. It outputs 1 for bullish, -1 for bearish and 0 for cyclic regime.
🌸 --------- FINAL NOTES --------- 🌸
💮 Development Philosophy
The Market Regime Detector has been developed with several key principles in mind:
1. Robustness - The detection methods have been rigorously tested across diverse markets and timeframes to ensure reliable performance.
2. Adaptability - The detector automatically adjusts to changing market conditions, requiring minimal manual intervention.
3. Complementarity - Each detection method provides a unique perspective, with the collective consensus being more reliable than any individual method.
4. Intuitiveness - Complex technical parameters have been abstracted into easily understood controls.
💮 Ongoing Refinement
The Market Regime Detector is under continuous development. We regularly:
• Fine-tune parameters based on expanded market data using state-of-the-art Machine Learning techniques
• Research and integrate new detection methodologies
• Optimise computational efficiency for real-time analysis
Your feedback and suggestions are very important in this ongoing refinement process!
Regimechange

Hurst Flow • @Capital.comDescription
Hurst Flow is a regime-adaptive analytical tool that measures the continuous intention force behind market behavior.
It blends momentum and persistence analysis to quantify how strongly price movement aligns with trend continuation versus mean reversion.
The output is a normalized continuous force line:
Positive values indicate increasing long-side capital exposure — markets showing trend-persistence and momentum alignment.
Negative values reflect strengthening short-side capital exposure — environments favoring mean reversion or fading moves.
Internally, the indicator processes open-price rate-of-change dynamics through adaptive smoothing, persistence estimation, and standardized scaling, producing a stable and comparable signal across time frames and assets.
Use Hurst Flow as a market regime compass — to gauge bias, filter trades, or allocate exposure intensity dynamically.
Input descriptions
TF — Timeframe used to compute the signal. Higher TF = smoother, less whipsaw, but more lag.
ROC length (Open) — Lookback for Open-to-Open rate of change (base momentum horizon).
EMA length — Smoothing for ROC; increases stability at the cost of responsiveness.
Hurst window — Window for Hurst-style persistence estimate; governs regime sensitivity.
Standartizatoin window — Period for standardization; makes values comparable across assets/timeframes.
Scale factor (0..1) — Final gain applied to the standardized signal; use <1 to temper amplitude.
Presets/Backtest
Below is a list of presets that can be used to test indicators. The presets cover various asset classes and time frames, demonstrating versatility and high customizability. To do this, you can use a special strategy Target % Rebalancer Based Strategy on Intention Indicator . The entry signal for the strategy is the output signal of the indicator from the chart, which can be selected from a special drop-down list. A detailed description of the strategy can be found on a special page. The presets presented were created on instruments not included in the sample.
Below are the basic presets for the strategy. Other configuration functions can be used to fine-tune the strategy.
The strategy settings are the same for all of the presets listed. The time interval must be set for both the indicator and the chart.
Strategy fine tuning
Enable Hysteresis + Cooldown : Off
Risk & costs
Enable Max Daily Loss Halt : Off
Commission : 0.1%
============== Pre-Sets for Hurst Flow Indicator =============================
Preset Gold
Chart bar size: 3D
Indicator settings
TF : 3D
ROC : 10
EMA : 22
Hurst : 16
Standardization window length : 8
Scale : 1
====================================================
Preset Crude Oil:USOIL
Chart bar size: 1D
Indicator settings
TF : 1D
ROC : 70
EMA : 6
Hurst : 26
Standardization window length : 16
Scale : 1
Final Weight Cap : 1
====================================================
Preset S&P500 index
Chart bar size: 2D
Indicator settings
TF : 2D
ROC : 26
EMA : 8
Hurst : 33
Standardization window length : 16
Scale : 1
====================================================
Preset MSFT
Chart bar size: 2D
Indicator settings
TF : 2D
ROC : 16
EMA : 50
Hurst : 44
Standardization window length : 32
Scale : 1

Blockchain Fundamentals: PPT [CR]Blockchain Fundamentals: PPT
A proprietary market positioning indicator that analyzes price behavior using percentile-based statistical methods. The PPT (Percentile Position Transform) provides a normalized oscillator view of market conditions, helping traders identify potential trend exhaustion and reversal zones through multi-timeframe statistical analysis.
█ FEATURES
Dual Signal Lines
The indicator plots two distinct signals:
- White Line — Primary signal representing the normalized, smoothed market position. This is the main signal used for trading decisions.
- Red Line — Raw statistical measurement before final normalization. Useful for identifying divergences and signal development.
Background Coloring
Dynamic background colors provide at-a-glance market context:
- Green Background — Indicates bullish positioning when the primary signal exceeds the buffer threshold.
- Red Background — Indicates bearish positioning when the primary signal falls below the buffer threshold.
- Gray Background — Neutral zone where no clear directional bias is present.
Flip Buffer
An adjustable threshold system designed to reduce noise and false signals:
- Enable Flip Buffer — Toggle the buffer system on or off.
- Buffer Size — Adjustable threshold level (default -0.1) that determines when background colors change. Higher values reduce sensitivity; lower values increase responsiveness.
Reference Levels
Three horizontal reference lines provide context:
- Center line at 0 — Neutral market position.
- Upper dashed line at +1 — Extreme bullish positioning threshold.
- Lower dashed line at -1 — Extreme bearish positioning threshold.
█ HOW TO USE
Signal Interpretation
The indicator operates as a mean-reversion oscillator within a normalized range:
1 — Values approaching +1 suggest extended bullish conditions where price may be overextended relative to recent history.
2 — Values approaching -1 suggest extended bearish conditions where price may be oversold relative to recent history.
3 — Crosses of the center line (0) indicate shifts in the underlying statistical trend.
Trading Applications
While specific trading strategies will vary by individual approach and market conditions:
- Consider the extremes (+1 and -1 levels) as potential areas of interest for mean-reversion setups.
- Background color changes can help identify when market positioning shifts from one regime to another.
- Divergences between the white and red lines may provide early warning of potential trend changes.
- The buffer zone (gray background) represents areas where market positioning is relatively neutral.
█ LIMITATIONS
- The indicator requires sufficient historical data to function properly. In assets with limited price history, the statistical measurements may be less reliable during early data periods.
- As a percentile-based system, the indicator is relative to recent history. Changing market regimes may require interpretation adjustments.
- Not designed for high-frequency or scalping strategies due to its daily data dependency.
- Background colors are visual aids and should not be used as standalone trading signals without additional confirmation.
█ NOTES
This indicator is part of the Blockchain Fundamentals suite and represents proprietary research into statistical market positioning analysis.
Users should experiment with the buffer settings to match their risk tolerance and trading style. More conservative traders may prefer larger buffer values to reduce signal frequency, while active traders might benefit from smaller buffers that provide earlier warnings.

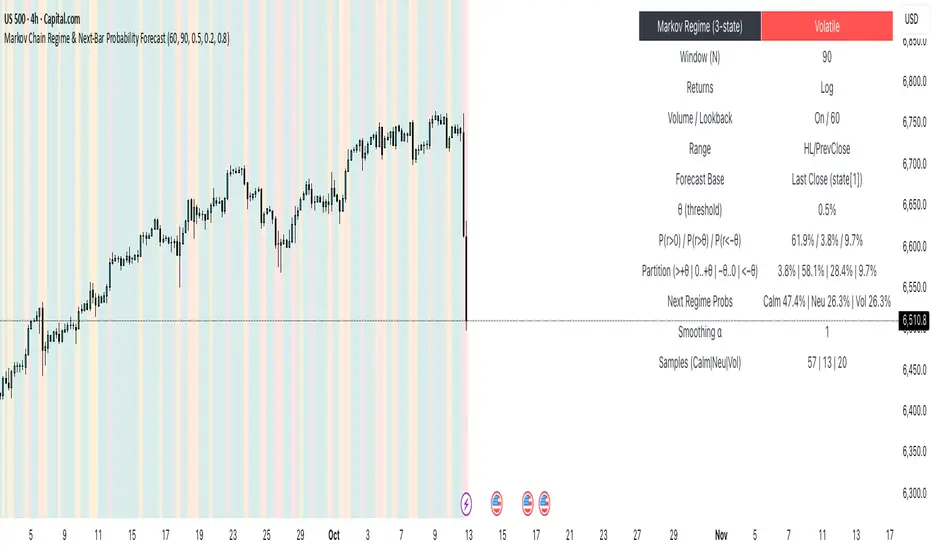
Markov Chain Regime & Next‑Bar Probability Forecast✨ What it is
A regime-aware, math-driven panel that forecasts the odds for the very next candle. It shows:
• P(next r > 0)
• P(next r > +θ)
• P(next r < −θ)
• A 4-bucket split of next-bar outcomes (>+θ | 0..+θ | −θ..0 | <−θ)
• Next-regime probabilities: Calm | Neutral | Volatile
🧠 Why the math is strong
• Markov regimes: Markets cluster in volatility “moods.” We learn a 3-state regime S∈{Calm, Neutral, Volatile} with a transition matrix A, where A = P(Sₜ₊₁=j | Sₜ=i).
• Condition on the future state: We estimate event odds given the next regime j—
q_pos(j)=P(rₜ₊₁>0 | Sₜ₊₁=j), q_gt(j)=P(rₜ₊₁>+θ | Sₜ₊₁=j), q_lt(j)=P(rₜ₊₁<−θ | Sₜ₊₁=j)—
and mix them with transitions from the current (or frozen) state sNow:
P(event) = Σⱼ A · q(event | j).
This mixture-of-regimes view (HMM-style one-step prediction) ties next-bar outcomes to where volatility is likely headed.
• Statistical hygiene: Laplace/Beta smoothing, minimum-sample gating, and unconditional fallbacks keep estimates stable. Heavy computations run on confirmed bars; “Freeze at close” avoids intrabar flicker.
📊 What each value means
• Regime label & background: 🟩 Calm, 🟧 Neutral, 🟥 Volatile — quick read of market context.
• P(next r > 0): Directional tilt for the very next bar.
• P(next r > +θ): Odds of an outsized positive move beyond θ.
• P(next r < −θ): Odds of an outsized negative move beyond −θ.
• Partition row: Distributes next-bar probability across four intuitive buckets; they ≈ sum to 100%.
• Next Regime Probs: Likelihood of switching to Calm/Neutral/Volatile on the next bar (row of A for the current/frozen state).
• Samples row: How many next-bar samples support each next-state estimate (a confidence cue).
• Smoothing α: The Laplace prior used to stabilize binary event rates.
⚙️ Inputs you control
• Returns: Log (default) or %
• Include Volume (z-score) + lookback
• Include Range (HL/PrevClose)
• Rolling window N (transitions & estimates)
• θ as percent (e.g., 0.5%)
• Freeze forecast at last close (recommended)
• Display toggles (plots, partition, samples)
🎯 How to use it
• Volatility awareness & sizing: Rising P(next regime = Volatile) → consider smaller size, wider stops, or skipping marginal entries.
• Breakout preparation: Elevated P(next r > +θ) highlights environments where range expansion is more likely; pair with your setup/trigger.
• Defense for mean-reversion: If P(next r < −θ) lifts while you’re late long (or P(next r > +θ) lifts while late short), tighten risk or wait for better context.
• Calibration tip: Start θ near your market’s typical bar size; adjust until “>+θ” flags truly meaningful moves for your timeframe.
📝 Method notes & limits
Activity features (|r|, volume z, range) are standardized; only positive z’s feed the composite activity score. Estimates adapt to instrument/timeframe; rare regimes or small windows increase variance (hence smoothing, sample gating, fallbacks). This is a context/forecast tool, not a standalone signal—combine with your entry/exit rules and risk management.
🧩 Strategies too
We also develop full strategy versions that use these probabilities for entries, filters, and position sizing. Like this publication if you’d like us to release the strategy edition next.
⚠️ Disclaimer
Educational use only. Not financial advice. Markets involve risk. Past performance does not guarantee future results.
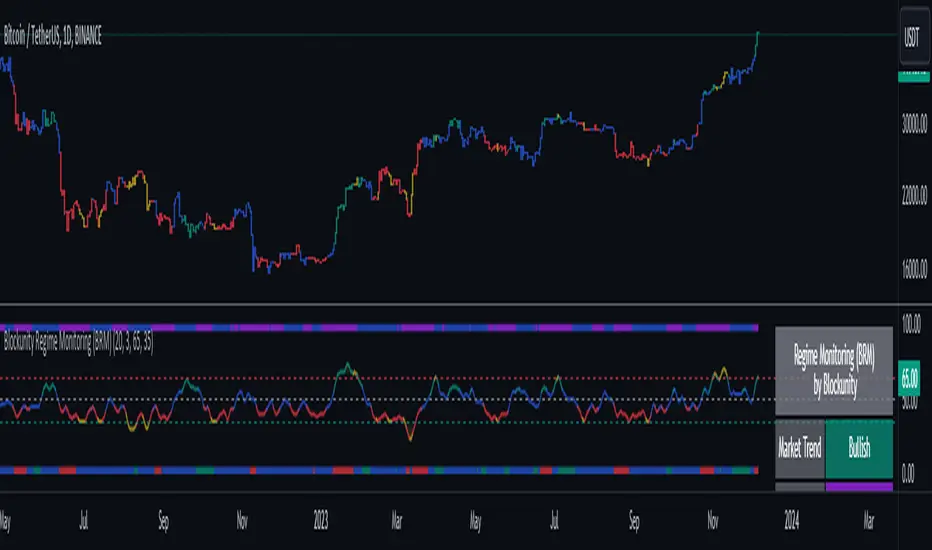
Blockunity Regime Monitoring (BRM)Efficiently analyze market conditions and detect overheating zones.
Regime Monitoring (BRM) is here to help you analyze the behavior of financial markets. The oscillator allows you to observe when an asset’s trend is likely to reverse. The trend is also given by the indicator, as is the phase the market is in (trending or congested). The BRM also provides the state of the Choppiness Index, indicating whether or not the asset is about to enter a more volatile phase.
The Idea
The goal is to provide the community with a comprehensive tool for tracking market conditions, with a visual approach to identifying overheating zones.
How to Use
This tool consists of 3 main components:
An oscillator, which we describe in detail below.
Bar color to transcribe oscillator information directly onto the graph. To activate Bar Color, make sure the first option is checked in the settings. You must also uncheck "Borders" and "Wick" in your Chart Settings.
A panel that summarizes the status of various indicator information.
Elements
The Regime Monitoring oscillator
The oscillator provides several information points. First, it gives the market trend of the asset:
Green: Bullish trend.
Red: Bearish trend.
Blue: Contested trend.
It then indicates areas of overheating, where it is considered statistically probable that we will see a change in trend dynamics. These moments are shown in yellow.
This market trend is also indicated in the table.
If you see that the oscillator is above or below these limits, but not yellow, this is because we use a Choppiness Index to filter this information.
The "Enable Choppiness Index Filter" is enabled by default in the settings. So, if the Chop is discharged (under 38.2), then the oscillator's overheating state is ignored.
You can see the difference in the images below, the first with the filter and the other without:
Market Phase
We use a Vertical Horizontal Filter (VHF) to define the market phase the asset is in. This phase can have two values:
Trending: Assets evolve within a trend.
Congestion: The asset is in a moment of congestion.
Chop State
Visualize the Choppiness Index, indicating whether an asset is gearing up to enter a phase of increased volatility. It can be:
Charged: Chop is considered to indicate to be entering a stable phase.
Neutral: Chop is neutral and does not provide any specific information.
Discharged: Chop is considered to indicate a continuation of the trend.
In addition, with the "Show Choppiness Index" option, you can plot the Chop on the oscillator:
Other Settings
You can also modify the standard Regime Monitoring parameters (Lookback, Smoothing, Limits), display or hide certain components, and change all the colors.
How it Works
Regime Monitoring's main oscillator is established as follows:
We calculate the percentage of times the closing price was higher than the opening price. This is then divided by a lookback period, which in this case defaults to 20. This calculation gives a probability of the current regime.
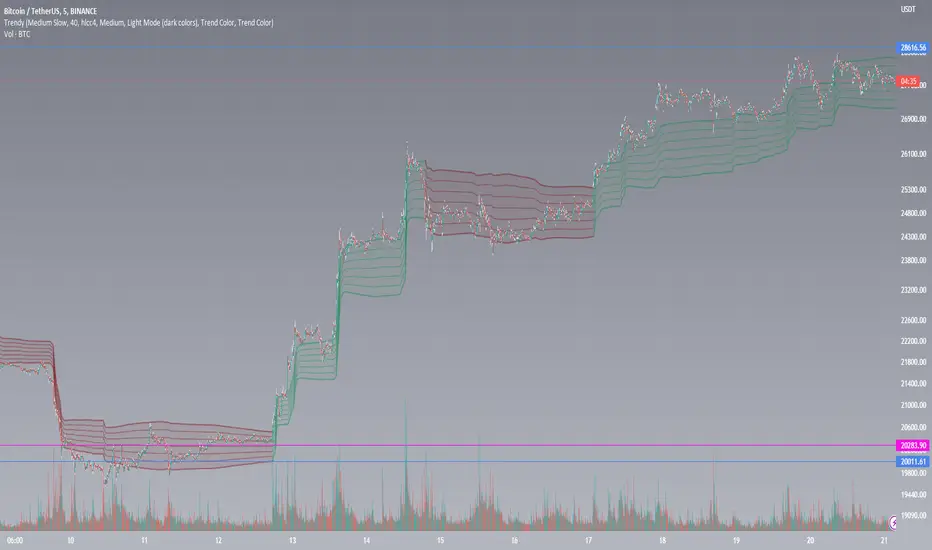
Trendgetter: Trend Detection, Regime Change, Bias Filter by [CR]Trendgetter: Trend Detection, Regime Change, Bias Filter by Cryptorhythms
“If you are not a trend setter, at least be able to exploit the ones you see.”
― Jeffrey Fry
Intro
Cryptorhythms back again with a members only indicator for trend capture this time! Trendgetter is not crypto specific and can be applied to a variety of timeframes, markets, and tickers. Its meant to be a general purpose trading aid and bias filter, providing reliable trend, bias and regime change information.
Introduction
This indicator relies upon various methods related to probabilities/statistics, digital signal processing and data science to predict optimal fair local price given any financial time series data. The goal was to create a tool that isolates trends and captures their bias, making it easier to follow a noisy market. The focus is making high hit rate uncorrelated returns to your base market. The way in which this indicator is constructed is not based upon any previous public work, and was researched and refined over a period of 6 months of trading and testing based on my own personal trading experiences and observations of the market. I use novel techniques I developed in house to denoise the data and determine a local fair price.
Description
The parameters in this indicator are mostly fixed and do not lend themselves to overfitting. So when you find good settings, its probably legit and not a false positive. They were pre-determined based on my own testing and research to handle almost all possible combinations of price action for determining trends. By fixing some parameters, you automatically reduce the chances of overfitting to historical data. The pre determined levels were carefully chosen after many options were considered.
Not just a bias filtooor, fair price predictooor and regime change detectoooor though! TG also provides a price envelope feature which shows a likely fair price range that price will distribute itself upon. Above or below the envelope indicates the presence of a very strong trend . Within the envelope indicates consolidation , but still conforming to the bias. TG then uses a statistics-based approach to display a likely range that price could potentially travel over the near term which we called a price envelope.
An additional option provides background coloration when there is the potential for a regime change on the trend bias. This can be used as a feature to help you manage your trades risk. This is simply measured by an internal (non exposed) script value returning to a mean which triggers the color to appear.
Further Explanation of Settings
-Timeframe : Change the timeframe the indicator is calculated on allowing you to for instance use the 15m Trendgetter output while remaining on the 5 minute chart.
-Trend Capture : This is the "type" of trend you are trying to follow. The different options will attempt to find the trends at various levels of noise cancellation within the lookback period you specify. "Reactive" means it will quickly change its bias and capture smaller trends. "Slow" means it will filter more noise and capture larger trends. "Adaptive" is completely in its own class of behavior and was my attempt to mix both a slow and reactive profile into one setting, it uses a few market metrics like volume and volatility to adjust parameters on the fly.
-Sample Length : Bars to consider in the calculation. Using large numbers here is not going to help, but rather hurt your results. Generally 10-100 is the range you should use for the best results. The exact value will depend on the timeframe, volatility and market/asset you are trading, and you should experiment to find it. (There is no "one size fits all" for potential trading situations)
-Source : Data series used for calculation. I recommend hlcc4 or hl2 or hlc3 instead of just "close." This will help to pre process a noisy data series for the rest of the algo.
-Certainty Level : This setting effects how easily the indicator will confirm a new trend and change its bias. " Reactive" does just as it says and will confirm new regimes faster, but can also lead to false signals or "flip flop" in certain types of price action. "Slow" will change biases less frequently or in conjunction with large moves - but this level of certainty requires the sacrifice of reactivity meaning its a bit laggy (but thats ok when you are following a larger trend). "Medium" is as you would expect the middle ground between reactive and slow. Lastly "Adaptive" tends to fall between reactive and medium in its behavior typically, but it will somewhat adjust itself to suit the variability of market conditions.
-Price Envelope :
-----My own personally created price distribution spread (not monte carlo based)
-----Above or below the envelope indicates the presence of a very strong trend. You should not be fading a trend when its in this position!
-----Within the envelope indicates consolidation, but still conforming to the bias.
User Requests :
Of course we also listen to the needs of our members and added these features upon request.
-Added dark mode and light mode themes.
----Dark Mode is for dark/black charts and uses lighter colorations
----Light mode is for light/white charts and uses darker colorations
-More updates to display and color selection options such as background colors and fill colors.
Enhanced Sigma by Cryptorhythms [CR] - AdvancedEnhanced Sigma - Advanced Volatility-Normalized Returns Analysis
The Enhanced Sigma indicator measures volatility-adjusted price returns to identify statistical extremes, regime changes, and mean reversion opportunities. By normalizing returns against their standard deviation, the indicator reveals when markets are experiencing unusual moves relative to recent volatility—highlighting potential exhaustion points, capitulation events, and statistical anomalies.
█ OVERVIEW
Sigma (σ) represents how many standard deviations current returns deviate from normal behavior. Readings beyond ±2.0 indicate statistically unusual moves, while extreme readings beyond ±3.0 occur less than 1% of the time under normal distribution. This version adds multi-layered analysis including regime detection, multi-timeframe confirmation, and adaptive thresholds.
█ KEY FEATURES
Return Calculation Methods
The indicator supports multiple return calculation approaches:
- Simple Returns — Standard percentage change calculation
- Log Returns — Logarithmic returns for better statistical properties
- Geometric Returns — Square root based calculation
- Percentage Returns — Scaled percentage format
Volume Weighting
Optional volume weighting emphasizes high-volume moves while dampening low-volume noise. When enabled, returns are weighted by normalized volume to give more significance to moves occurring on institutional participation.
Threshold Methods
Two threshold calculation approaches:
- Fixed Thresholds — Manual static levels
- Percentile-Based — Adaptive thresholds calculated from historical distribution
Percentile-based thresholds automatically adjust to changing volatility regimes over configurable lookback periods.
Statistical Significance Testing
Built-in t-test functionality determines whether current sigma readings are statistically significant or merely random noise. Configurable confidence levels (80-99.9%) filter out insignificant moves. Non-significant readings are visually dimmed.
Multi-Timeframe Analysis
Analyzes sigma across multiple timeframes simultaneously. Confluence signals trigger when all timeframes (current, 3x, 5x) align at extremes—indicating stronger conviction and reduced false signals. MTF sigma values are plotted as reference lines.
Regime Detection
Automatically classifies current volatility environment into four regimes:
- Low Volatility — Market in compression
- Normal — Standard volatility conditions
- High Volatility — Elevated movement
- Extreme — Unusual volatility expansion
Regime classification uses percentile ranking and statistical deviation analysis.
Adaptive Threshold System
Three methods for automatic threshold adjustment:
- ATR-Based — Adjusts based on Average True Range ratio
- Volatility Regime — Tightens in low volatility, widens in high volatility
- Range Expansion — Responds to recent sigma range changes
When enabled, thresholds dynamically scale with market conditions to maintain consistent sensitivity.
Cluster Analysis
Detects and scores clusters of threshold breaches within rolling windows. High cluster scores can indicate capitulation or exhaustion phases. Visual labels "C" show active clusters.
Mean Reversion Signals
Generates entry and exit signals based on extreme sigma readings returning to mean:
- Long Entry — Triggered on oversold extremes
- Short Entry — Triggered on overbought extremes
- Exit Signals — When sigma normalizes or time-based exit reached (marked as gray "X")
Optional statistical significance filter ensures only high-probability setups generate signals. Position tracking displays unrealized P&L.
Distribution Histogram
Displays sigma value distribution as a horizontal histogram showing Point of Control (POC)—the most frequently occurring sigma level. Configurable bin size and lookback period.
Statistics Dashboard
Real-time table displaying:
- Current sigma value and percentile rank
- Statistical measures (mean, std dev, skewness, kurtosis)
- Volatility regime classification
- Extreme event frequency
- Bars since last extreme
- Position status and P&L (when mean reversion enabled)
█ VISUAL ELEMENTS
Threshold Lines
- Aqua/Cyan lines — Positive (high) thresholds
- Fuchsia/Magenta lines — Negative (low) thresholds
- Solid lines — Short-term dynamic thresholds
- Circles — Long-term dynamic thresholds
- Crosses — Percentile-based static thresholds (when enabled)
Sigma Histogram
Primary histogram uses momentum-based coloring:
- Purple shades — Negative sigma (declining)
- Cyan shades — Positive sigma (advancing)
- Darker shades indicate weakening momentum
- Brighter shades indicate strengthening momentum
Statistically significant threshold breaches are highlighted with intensified colors.
Shape Markers
- Small triangles — Statistically significant threshold breaches
- Diamonds — Multi-timeframe confluence signals
- Large triangles with text — Mean reversion entry signals (LONG/SHORT)
- X markers — Mean reversion exit signals
- Labels — Cluster detection alerts
█ ALERTS
The indicator includes comprehensive alert conditions. Use confirm on bar close if repainting is enabled.
█ HOW TO USE
Identifying Extremes
Sigma readings beyond ±2.0 indicate unusual moves. Look for:
- Threshold breaches with statistical significance markers (triangles)
- Multi-timeframe confluence (diamonds) for stronger signals
- Cluster formation indicating potential exhaustion
Regime-Aware Trading
Use regime detection to adjust expectations:
- In Low Volatility regimes, smaller sigma moves may be significant
- In Extreme regimes, higher thresholds prevent overtrading
Mean Reversion Strategy
Enable mean reversion signals for systematic entries:
- LONG signals appear after statistically significant oversold extremes
- SHORT signals appear after statistically significant overbought extremes
- Exit signals trigger on return to mean or time-based stops
Distribution Analysis
Use the histogram to identify:
- POC level — Where sigma spends most time (equilibrium)
- Current position relative to distribution
