Dobrusky Pressure CoreWhat it does & who it’s for
Dobrusky Pressure Core is a volume by time replacement for traders who care about which side actually controls each bar. Instead of just plotting total volume, it splits each bar into estimated buy vs sell pressure and overlays a custom, session-aware volume baseline. It’s built for discretionary traders who want more nuanced volume context for entries, breakouts, and pullbacks.
Core ideas
Buy/sell pressure split: Each bar’s volume is broken into estimated buying and selling pressure.
Dominant side highlighting: The dominant side (buy or sell) is always displayed starting from the bottom of the bar, so you can quickly see who “owned” that bar.
Median-based baseline: Uses the median of the last N bars (50 by default) to build a robust volume baseline that’s less sensitive to one-off spikes.
Session-aware behavior: Baseline is calculated from Regular Trading Hours (RTH) by default, with an option to include Extended Hours (ETH) and a control to force Regular data on higher timeframes.
Volume regimes: Three multipliers (1x, 1.5x, 2x by default) show normal, high, and extreme volume regions.
Flexible display: Baseline can be shown as lines or as columns behind the volume, with full color customization.
How the pressure logic works
For each bar, the script:
Adjusts the range for gaps relative to the prior close so the “true” traded range is more consistent.
Computes buy pressure as a proportion of the adjusted range from low to close.
Defines sell pressure as: total volume minus buy pressure.
Marks the bar as buy-dominant if buy pressure ≥ sell pressure, otherwise sell-dominant, and colors the dominant side from the bottom to at least the midpoint using the selected buy/sell colors.
In practice, this turns basic volume columns into bars where the internal split and dominant side are clearly visible, helping you judge whether aggressive buyers or sellers truly controlled the bar instead of just looking at the price action.
Volume baseline & session logic
The script builds a session-aware baseline from recent volume:
Baseline length: A rolling window (default 50 bars) is used to compute a median volume value instead of a simple moving average.
RTH-only by default: By default, the baseline is built from Regular Trading Hours bars only. During extended hours, the baseline effectively “freezes” at the last RTH-derived value unless you choose to include extended session data.
Extended mode: If you select Extended mode, the script builds separate rolling baselines for RTH and ETH trading, using the appropriate one depending on the current session.
Force Regular Above Timeframe: On timeframes equal to or higher than your chosen threshold, the baseline automatically uses Regular session data, even if Extended is selected.
Multipliers: Three adjustable multipliers (1x, 1.5x, 2x by default) create normal, high, and extreme volume bands for quick identification.
This lets you choose whether you want a pure RTH reference or a baseline that adapts to extended-session activity.
Example ways to use it
1. Replace standard volume bars
Add Dobrusky Pressure Core to your volume pane and hide the default volume if you prefer a clean look.
Use the colors and split to see at a glance whether buyers or sellers were dominant on each bar.
2. Pressure confirmation for entries
For longs (example concept; adapt to your own rules):
Require that the entry bar’s buy pressure is greater than the previous bar’s sell pressure , or
If the entry and prior bar are both buy-dominant, require that the entry bar has more buy pressure than the prior bar.
This helps avoid taking a long when buying pressure is clearly fading relative to what sellers recently showed. A mirrored idea can be used for short setups with sell pressure.
3. Context from baseline multipliers
Use ~1x baseline as “normal” volume.
Watch for bars at or above 1.5x baseline when you want to see increased participation.
Treat 2x baseline and above as “extreme” volume zones that may mark climactic or especially important bars.
In practice, the baseline and multipliers are best used as context and filters, not as rigid rules.
Settings overview
Display
- Show Volume Baseline: toggle the baseline and its levels on or off.
- Baseline Display: choose between Line or Bars for the baseline visualization.
Baseline Calculation
- Length: lookback for the median baseline (default 50, configurable).
- Baseline Session Data: choose Regular or Extended to control which session data feeds the baseline.
Session Controls
- Regular Session (Local to TZ): define your RTH window (e.g., 0930-1600).
- Session Time Zone: choose the time zone used for that window.
- Force Regular Above Timeframe: on higher timeframes, force the baseline to use Regular session data only.
Baseline Levels
- Show Level x Multiplier 1/2/3: toggle each volume regime level.
- Multiplier 1/2/3: define what you consider normal, high, and extreme volume (defaults: 1.0, 1.5, 2.0).
Colors
- Buy Volume / Sell Volume: choose colors for buy and sell pressure.
- Baseline Bars (Base / x2 / x3): colors when the baseline is drawn as columns.
- Baseline Line (Base / x2 / x3): colors when the baseline is drawn as lines.
Limitations & best practices
This is a decision-support and visualization tool, not a buy/sell signal generator.
Best suited to markets where volume data is meaningful (e.g., index futures, liquid equities, liquid crypto).
The usefulness of any volume-based metric depends on the underlying data feed and instrument structure.
Always combine pressure and baseline context with your own strategy, risk management, and testing.
Originality
Most volume tools either show total volume only or compare it to a simple moving average. Dobrusky Pressure Core combines:
An intrabar buy/sell pressure split based on a gap-adjusted price range.
A median-based, configurable baseline built from session-specific data.
Session-aware behavior that keeps the baseline focused on Regular hours by default, with the option to incorporate Extended hours and force Regular data on higher timeframes.
The goal is to give traders a richer, session-aware view of participation and pressure that standard volume bars and simple SMA overlays don’t provide, while keeping everything transparent and open-source so users can review and adapt the logic.
Regulartradinghours

RTH Previous Day's Range + SMTs [bilal x shpat]Overview
This advanced indicator is designed specifically for futures and equity traders who focus on Regular Trading Hours (RTH) sessions. It automatically plots the previous RTH session's high and low levels and detects Smart Money Theory (SMT) divergences across multiple correlated or inversely correlated instruments.
Key Features
📊 RTH Range Detection
Automatically identifies and tracks Regular Trading Hours (9:30 AM - 4:14 PM New York time)
Plots horizontal lines at the previous RTH session's high and low
Works seamlessly on all timeframes, including ETH (Extended Trading Hours) charts
Lines dynamically extend and update as new bars form
🔄 Smart Money Theory (SMT) Divergence Detection
Compares up to 3 correlated or inversely correlated assets simultaneously
Detects bullish and bearish SMT divergences automatically
Visual divergence lines connect previous session levels to current intraday highs/lows
Customizable SMT labels showing which instruments are diverging
Option to mark assets as "Correlated" or "Inversely Correlated" for accurate divergence detection
SMT detection occurs only during RTH sessions for cleaner signals
🎨 Fully Customizable Styling
3 Label Styles: Choose between "Full" (RTH Previous Day High), "Short" (RTH PDH), or "Lowercase" (rth previous day high)
Adjustable Label Sizes: Tiny, Small, Normal, or Large
Custom Colors: Separate color controls for lines, labels, bullish SMT, and bearish SMT
Line Extension: Control how many bars ahead lines extend
Line Width: Customize line thickness
📈 SMT Visual Indicators
Arrow Symbols: ▲ = Higher / ▼ = Lower (for correlated assets)
Alternate Symbols: 🔺 = Higher / 🔻 = Lower (for inversely correlated assets)
Color-coded divergence lines (white by default, fully customizable)
Optional SMT labels showing ticker symbols with directional indicators
Optional comparison table displaying current divergence status
⚙️ Comparison Settings
Add up to 2 comparison symbols (e.g., ES1!, YM1!, NQ1!)
Toggle each comparison asset on/off independently
Set correlation type (Correlated or Inversely Correlated) for each asset
Popular comparisons: ES vs NQ, YM vs ES, Equity vs Futures
🧹 Clean Chart Management
Option to delete previous RTH SMTs when new session starts
Automatic cleanup of outdated lines and labels
Transparent label backgrounds for minimal chart clutter
Lines track exact bar where high/low occurred
How It Works
Session Detection: The indicator identifies when RTH begins (9:30 AM ET) and tracks all price action during the session until close (4:14 PM ET)
Level Capture: At the start of each new RTH session, it captures the previous session's high and low and plots them as reference levels
SMT Analysis: During the current RTH session, it continuously compares the current session's high/low with the previous session's high/low across all selected instruments
Divergence Identification: When one instrument makes a higher high while another makes a lower high (or vice versa), an SMT divergence is detected and visualized
Use Cases
Liquidity Analysis: Identify when markets are taking liquidity at different rates
Reversal Signals: SMT divergences often precede significant reversals
Correlation Trading: Monitor when traditionally correlated markets begin to diverge
Key Level Trading: Use previous RTH high/low as support/resistance levels
Multi-Market Analysis: Compare ES, NQ, and YM simultaneously for institutional flow
Best Practices
Most effective on intraday timeframes (1m - 15m charts)
Works on both RTH and ETH chart sessions - meant to be used on a RTH chart
Compare highly correlated instruments (e.g., ES1! vs NQ1!)
Use in combination with volume analysis and market structure
SMT divergences are most powerful near key levels
Settings Overview
Comparison Symbols
Asset 2 & 3: Select tickers to compare (e.g., ES1!, YM1!)
Correlation toggles for each asset
Enable/disable each comparison independently
Styling
Line color, width, and extension length
Label color, size, and style (3 options)
Separate colors for bullish and bearish SMT lines
SMT Controls
Toggle SMT detection on/off
Show/hide SMT text labels
Optional SMT comparison table
Delete previous session SMTs option
Note: This indicator is best used by traders familiar with Smart Money Concepts (SMC) and inter-market analysis. Understanding market correlations is essential for accurate interpretation of SMT divergences.
thank you shpat for the SMT option in the last indicator, i tweaked it for this one

ICT Opening Range GapOpening Range Gap
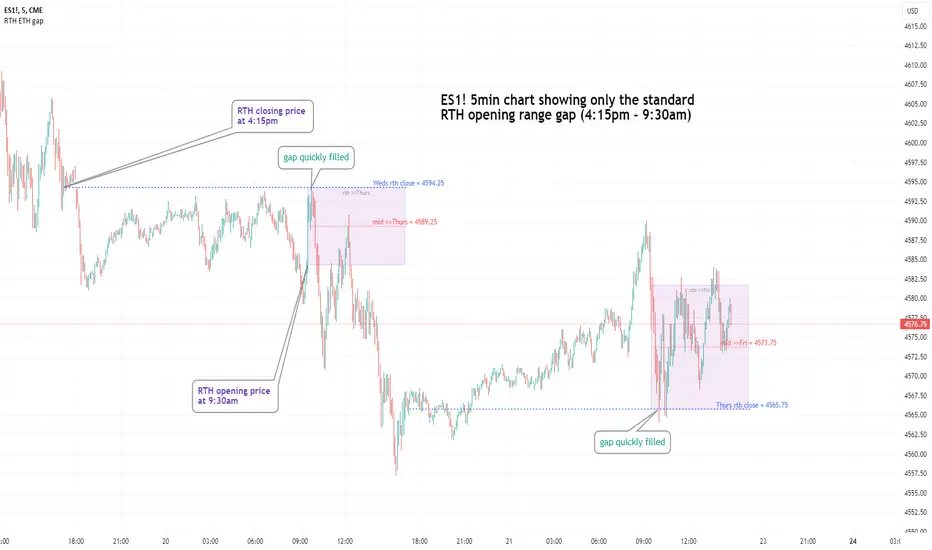
The Opening Range Gap, also known as the Regular Trading Hours (RTH) Gap, is the distance between the first opening tick of a session and the previous session's close, when looking at a chart's Regular Trading Hours (not to be confused with Electronic Trading Hours). This gap is an important element for Futures Market traders that follow the works of The Inner Circle Trader (ICT). To be more specific, the Opening Range Gap occurs between 4:15pm and 9:30am of the next day.
The Opening Range Gap can be viewed easily when switching the session type to "Regular trading hours".
The image above shows an example of an RTH Gap for Wednesday, June 12, 2024 in CME_MINI:ES1!
How To Use Opening Range Gap
The Opening Range Gap can be used like any other form of a gap by extending it into future price action and looking for it to be filled on the same day or the upcoming days.
Looking for 50% of the gap to be filled as an initial target is one of the methodologies taught by ICT. Additionally, the high and low of the gap (as well as the midpoint) can be used as points of dynamic support & resistance, even if the gap is already filled. Therefore, these gaps do not "expire", and they can be used as key price levels extended through to the end of the week.
Disclaimer
This indicator is mainly intended to work for Futures markets, and specifically the following Index Futures markets: E-mini S&P 500 Futures, E-mini NASDAQ-100 Futures, E-mini DOW Futures.
Given that, the indicator still supports various other markets/assets out-of-the-box, such as other types of Futures Markets, Stocks, Options, and more. The main difference will be that other markets may have RTH Gaps forming at different times, rather than the 4:15pm-9:30am gap that occurs in the Index Futures (Regular trading hours).
Indicator Purpose
While RTH Gaps can be labeled by hand, this indicator allows you to quickly plot multiple RTH Gaps and get a quick glimpse at potential gaps that you may have missed, which could end up being useful in your analysis.
This indicator is 100% custom-built, not using code from any other existing indicators that may plot Opening Range Gaps. The main purpose of this indicator was to overcome many shortcomings from other existing indicators, most notably the problem of displaying RTH Gaps while using ETH as the chart session.
Therefore, this indicator has many UNIQUE features, such as:
Ability to maintain accuracy of the closing/opening prices even when changing chart settings (e.g., toggling ETH/RTH sessions, toggling BACK-ADJUSTMENT on futures contracts, toggling SETTLEMENT prices, etc.).
Draw up to 25 previous Opening Range Gaps, even on ultra-low timeframes like the 1-minute or 1-second chart.
Automatically or manually choose which Opening Range Gaps to hide/show on the chart.
Highly customizable, including a different color scheme to easily distinguish between the Current and Previous RTH Gaps.
Modified price values to correctly display prices that use a format like 109'32 (e.g., Bond Futures or Wheat Futures).
Helpful tooltips to provide more detailed information about the RTH Gaps or about the current Input Settings.
Error Messages
There are some conditions which can cause the script to fail and display an error message (by clicking the red exclamation mark next to the indicator.)
Error messages:
Use a Standard Chart Type : this will occur when using a non-standard chart such as Heikin Ashi, Renko, Point & Figure, etc.
Use a Daily or Lower Timeframe : this error will appear when using a higher timeframe chart like weekly or monthly, because it can clutter the chart since RTH Gaps can form every day.
RTH Gap was not detected : this means that no RTH gap was found, which will occur on markets that don't have the option to toggle between ETH and RTH sessions (e.g., Forex or Crypto).
Exceeded the maximum lookback for Bar Replay mode : when using bar replay mode; this can depend on the amount of historical bars available in different account subscription types.
Unable to Activate Bar Replay mode : if the indicator could not be used in Bar Replay mode.
Restart Bar Replay : if the indicator works in Bar Replay but it detected an error that would cause RTH Gaps to be plotted incorrectly.
This is an example of what a script error would look like.
Indicator Settings
Most settings are self-explanatory or have a tooltip with information on what the setting does, but this section will only briefly cover the available settings.
Extend to End of Day : This setting is enabled by default. It will extend each RTH Gap only up to the end of its day (specifically, to the RTH close of the day). The option can be toggled OFF to automatically extend all RTH Gaps to the right-most candle on the chart.
Previous RTH Gaps : Between 1 and 25 previous RTH Gaps can be displayed. The checkbox can be toggled to quickly hide all previous RTH Gaps (but the same effect would be reached by setting the value to 0).
Hide Current RTH Gap : The Current RTH Gap (most recent one), can be optionally hidden from being plotted.
Beginning Anchor Point : Choose the beginning anchor point for all RTH Gaps. The default is "RTH Close", which means that each gap will be drawn on the chart starting from their previous session's RTH close @ 4:15pm. But it will be a more transparent version of the actual gap; this ghost-like image will extend from 4:15pm all the way up to 9:30am where the gap will then be drawn normally from 9:30am onwards. The other option for this setting is "RTH Open" which means that the gap will be drawn starting from the actual 9:30am opening.
Current RTH Gap Style
These settings are used to customize the visual style of the most recent RTH Gap (also known as the "Current" RTH Gap). Note: the exact same set of settings are available for the Previous RTH Gaps. The text label next to each gap can be optionally hidden to clean the chart a little.
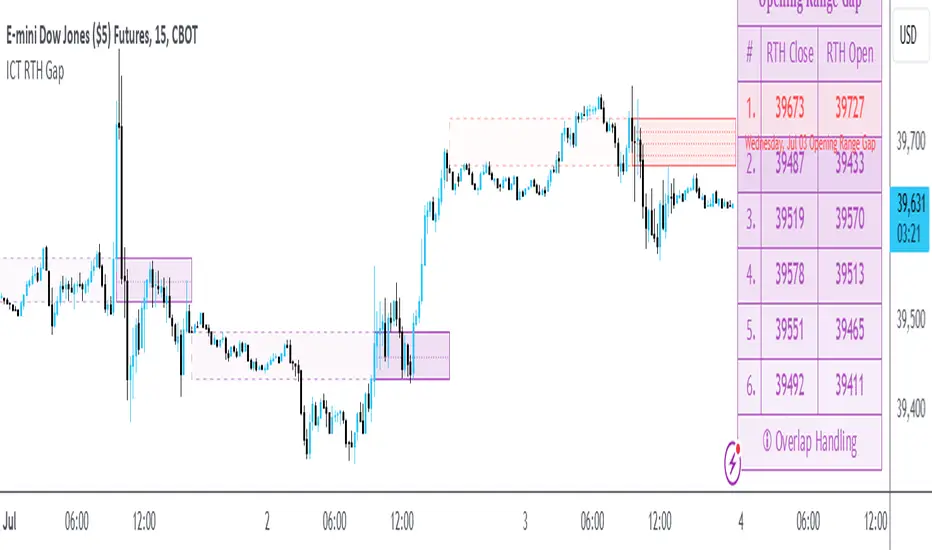
Price Table
These are settings to customize the appearance of the Price Table on the right, including the ability to hide it completely. Note: to actually use the color configurations, you must select "Custom Style" in one of the dropdowns, otherwise it will use "Default Style" which means that the Price Table is automatically styled based on the colors chosen in the Current RTH Gap Style and Previous RTH Gap Style settings.
Overlap Handling
One of 7 available overlap handling options can be used to filter which RTH Gaps are plotted on the chart. By default, the "None" option will be selected, meaning that all valid RTH Gaps are plotted on the chart.
Formatting
Date Format : select the format of the date that is shown next to each RTH Gaps.
Timezone : choose the timezone for the RTH Gap closing/opening date-times that are displayed (only in tooltips when you hover over an RTH Gap label).
RTH Gap Label : choose the details to display next to each gap (e.g., date, or gap number, or both).
Price Format : only two options: Auto/Decimal. "Auto" uses custom processing to allow displaying values such as 109'32 for Bond futures.
Tooltips
The indicator provides additional details about an RTH Gap when you hover over a row in the Price Table.
Note: the same information can be found by hovering over the Text Label that is to the right of each RTH Gap (even when the Text Label is disabled via the Settings).
Overlap Handling
The tooltip next to "Select a Strategy" in the options will provide details on each overlap handling strategy. Additionally, when a strategy is selected, a new row in the Price Table will appear; hovering over that will show details about the currently selected strategy, as well as any suggestions in case the inputs were invalid. When a strategy hides an RTH Gap, the number in the Price Table will be replaced with an "Eye" icon, indicating that it is not currently plotted on the chart.
Available strategies are:
Option 1 (Gradients) : select the percentage opacity to shade RTH Gaps in. The more recent RTH Gaps will be closer to the maximum opacity defined, while the older RTH Gaps will appear more transparent, closer to the minimum opacity defined. Note: only affects previous RTH Gaps, not the current RTH Gap.
Option 2 (Day Extension) : select the number of days to extend each RTH Gap up to. Note: this will override the "Extend to End of Day" setting, regardless whether it is toggled ON or OFF.
Option 3 (Nested Gaps) : hides nested gaps, i.e., RTH Gaps that are enclosed within another RTH Gap. Note: this option is only available when the "Extend to End of Day" setting is disabled .
Option 4 (Intersecting Gaps) : hides intersecting/overlapping gaps, i.e., RTH Gaps that overlap one another (this may also include, but is not limited to, nested gaps). The drop-down next to this option allows choosing the priority of which RTH Gaps to hide first. Note: this option is only available when the "Extend to End of Day" setting is disabled .
Option 5 (Gap Width) : the chart will only show RTH Gaps that have a width/size between the defined parameters.
Option 6 (Close Proximity) : the chart will only show the RTH Gaps that are within a certain range from the market price. This can be useful when plotting multiple RTH Gaps while using auto-scaling on the chart. By only showing nearby RTH Gaps, it will prevent the auto-scaling from having to compress the candles to fit the far-away RTH Gaps onto the screen.
Option 7 (CSV) : this option is used if none of the others suit you well; it allows specifically choosing which RTH Gaps to hide or show on the chart.
This is an example that chooses the Overlap Handling Strategy Option 6. Note that in this example, the tooltip in the price table shows a warning that the Input Number should be increased to plot some RTH Gaps on the chart.
Tips
Chart settings can be toggled to "Scale price chart only" to prevent the auto-scaling of TradingView from compressing the chart if there are RTH Gaps that are far away from the current market action.
If you change a lot of indicator settings such as RTH Gap color schemes, you can save the settings as the Default to prevent your settings from resetting the next time you use the indicator.
Pre-market Highs & Lows on regular trading hours (RTH) chartShows pre-market highs and lows on RTH or ETH chart
-Pre-market duration user input (default is 16 'bar hours'; covering the time from S&P RTH close at 4pm >> 9:30am RTH open next day
-Displays on both RTH and ETH charts
-Written for ES (ES1! or e.g ESM2023), but tested and working on SPY, SPX
-Works across timeframes
Example usage on Electronic trading hours (ETH) chart; showing the 'bar hours' user input lookback duration visually

Regular vs Electronic Trading hours Gap (RTH vs ETH); 4pm-9:30am-Shows the gap between 4pm close and 9:30am open; the Regular trading hours Vs Electronic trading hours Gap (RTH vs ETH).
-Displays this as a box starting at 9:30am, whose bottom is the 9:30am open; top is previous day's 4pm close.
-Displays when chart is toggled to either of ETH or RTH.
-Useful reminder of area above/below opening bell price that price often has a tendency to want to fill in, partially or fully
--(all times here refer to America/New_York timezone)
//Options:
~Number of past boxes to show
~Extend boxes fully to the right
~Box background color, border color, and opacities
//Limitations:
-works only on timeframes 30mins or lower (works on 1,2,5,10,15,30minutes)
-will not work on non-typical low timeframes (like 4min or 7min) since they are not divisible into 30