TriexDev - Liquidation Rekt LevelsTriexDev - Liquidation Rekt Levels TradingView Indicator
A basic indicator which lets you see where positions will be liquidated. Each line is based on default leverage levels typically used for trading. (3x,5x,10x,25x,50x)
Have a subtle 'label prompt' on the 3x - because I had noticed some people didn't understand what labels were in other indicators.
In the settings:
- There is an offset to adjust the levels horizontally, this is to help make it easier to track if the chart has hit liquidation positions.
- You can change colours/opacity of the lines.
- You can hide the 'Labels', and/or 'label prompt'
- In the 'Style' tab you can hide individual levels.
Inspired/initially based off 'Mex Rekt Level'
I often have this added to my charts, and toggle visibility when I want to check the liq levels.
GitHub Repo for tidier/more detailed documentation as it is updated.
Rekt

Retail Bomber MK1Handydandy tool to wait for the whales to wake up and start trading.
Each Zone has a schedule (call it market session) and pumps and dumps can be seen on specific times.
And for each zone you can either Highlight the background of just the start time, the whole session, or color the bars instead of changing the background.
Each zone is already set for a specific market open (session open): ASIA, UK, SYDNEY, NY + other 2 extra zones.
All of this is customisable 🙂
To set the time configuration, it goes like this:
1230:1330:1234567
1230:1330 is the period of time you want to study
1234567 are the days of the week, where 1=Sunday...And you fall on 7=Saturday
Example: If we want to study the same ranges from Monday to Friday only, it goes like: 1230 1330:23456
Colors can be editable
Labels for each session can be changed too.
Still testing it.

Safe Scalpy Stop Loss. Percentage from price visualizer.This is my first script I have published so bear with me.
I have thrown this together so you can easily see on the chart where -0.5%, -1% and -2% would be from the last candle close. I also replicated these to show positive values in case you are shorting.
I have also added a custom value setting so you can set the line at whatever percentage value you like and included an adjustable recent higher high and higher low finder to help create a recent range as it seems to work well in tandem for scalping range based price movement.
You can turn all these things on and off in the settings on the style checkboxes.
I felt the need to make this because I like to scalp trade with leverage like a total degen from time to time. Often the setups happen very quickly. It is difficult to calculate where to set a stop loss in a hurry so I keep a fixed account size/lev and just vary the position percentage size based on the percentage of the stop loss from the current price.
Sometimes when switching from a lower volatility chart to high volatility one it is easy to get caught out by quickly entering a scalp trade only to find you made your position way too big or you shouldn't have entered at all. You thought it was only moving 0.2% per candle instead of 3%. Whoops. Rekt.
This indicator is all about trying to help me avoid that with a visual clue to back up the bad maths I do quickly in my head.
I often hide it and only show it when I'm ready to enter a position to double check my SL and entry are set in a sensible area.
I thought I would publish it in case someone else finds such a simple tool handy.
Apologies if there is already something out there that does this job. I couldn't find it.
See you all on the moon.

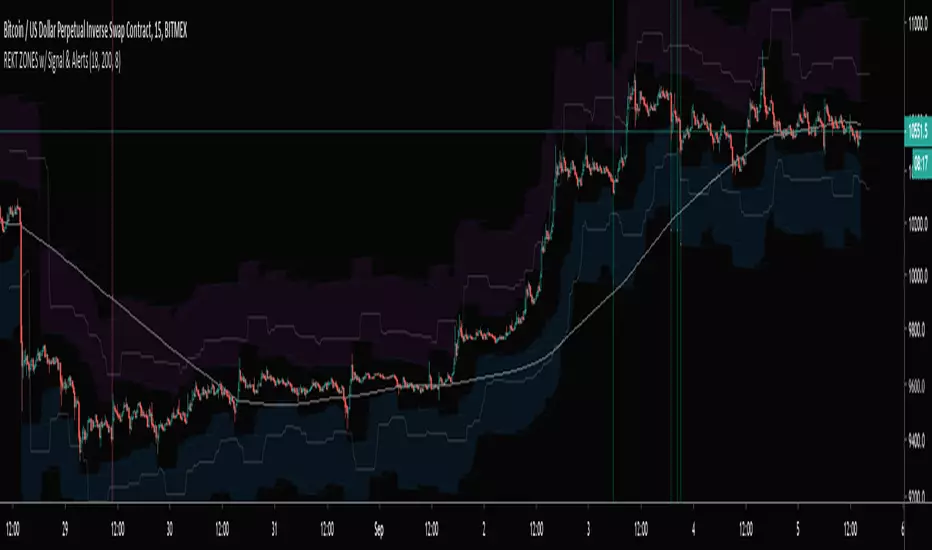
REKT ZONES w/ Signal & AlertsBitmex XBTUSD REKT ZONES with entry signal, stop, target, and alerts! Only use on a 15min charts
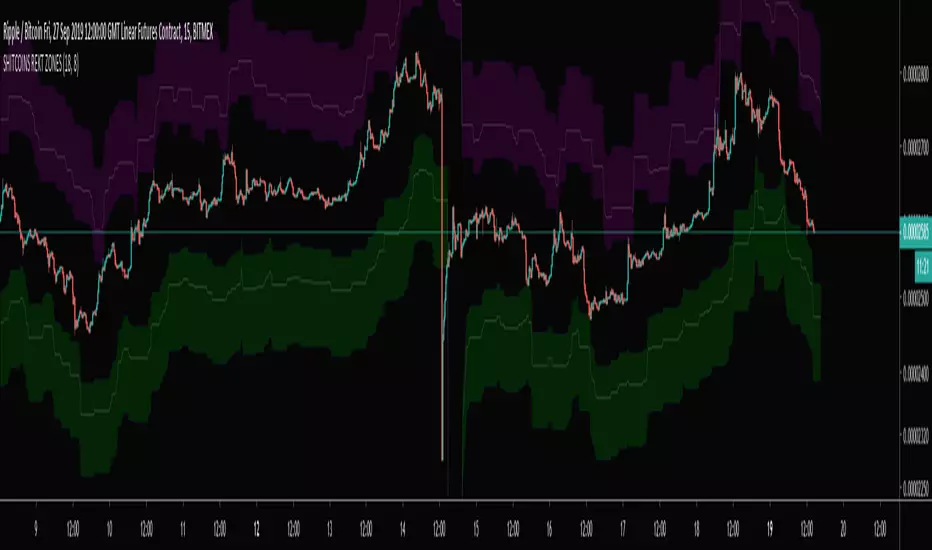
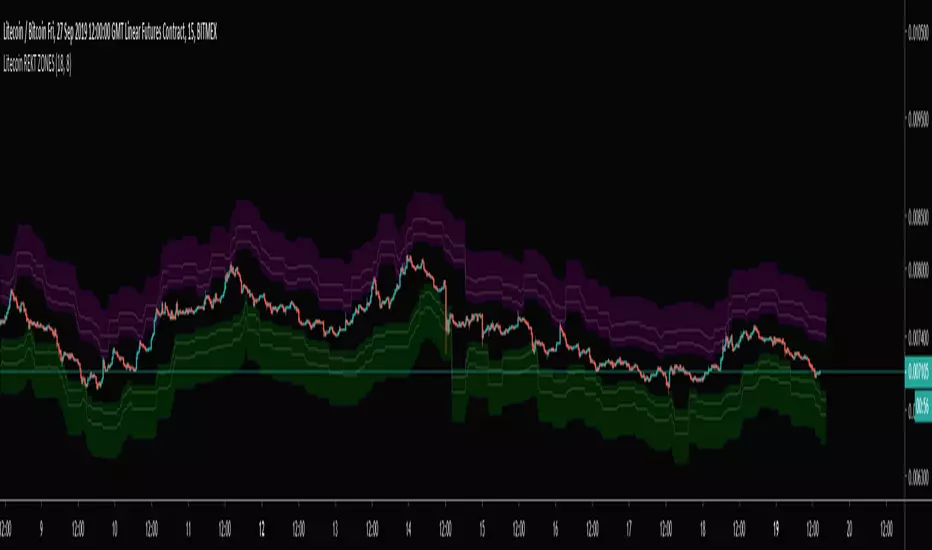
SHITCOINS REKT ZONESShitcoins(XRP, ADA, TRX, EOS, BCH) Bitmex Liquidity Zones. Best used on a 15 min chart.
Don't get REKT! Especially, on Shitcoins :)