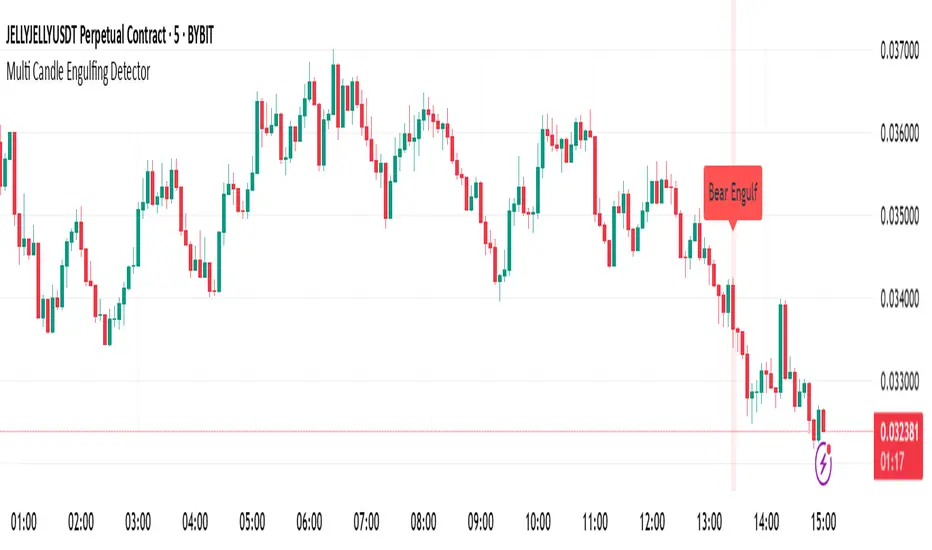
Multi Candle Engulfing Detector🔍 Multi Candle Engulfing Detector
This indicator identifies powerful engulfing candles that consume three or more previous candles — a signal often tied to strong market reversals or continuation moves.
🧠 Features
Detects candles that fully engulf the previous 3 or more candles
Optional filtering: only trigger when the engulfed candles are of the opposite color
Customizable engulf count for greater pattern control
Clear bullish and bearish signal labels on the chart
Alerts integrated: get notified the moment a setup forms
Background highlighting for enhanced visibility
⚙️ Settings
Minimum Number of Candles to Engulf: Default is 3, but can be adjusted
Require Opposite Color: When enabled, the engulfing candle must be opposite in color to the engulfed ones (e.g., green engulfing red)
📈 Use Cases
Spot strong reversal signals at tops and bottoms
Confirm breakout momentum on trend continuation
Use in confluence with other tools like volume or support/resistance
🚨 Alerts
Alerts fire when a bullish or bearish engulfing pattern is detected, allowing for mobile, email, or webhook notifications.
✅ Notes
This script is fully customizable and can be extended into a strategy or scanning tool. Feedback and suggestions are always welcome!
Reversal
Market Structure Confluence [AlgoAlpha]OVERVIEW
This script is called "Market Structure Confluence" and it combines classic market structure analysis with a dynamic volatility-based band system to detect shifts in trend and momentum more reliably. It tracks key swing points (higher highs, higher lows, lower highs, lower lows) to define the trend, then overlays a basis and ATR-smoothed volatility bands to catch rejection signals and highlight potential inflection points in the market.
CONCEPTS
Market structure is the foundation of price action trading, focusing on the relationship between successive highs and lows to understand trend conditions. Break of Structure (BOS) and Change of Character (CHoCH) events are important because they signal when a market might be shifting direction. This script enhances traditional structure by integrating volatility bands, which act like dynamic support/resistance zones based on ATR, allowing it to capture momentum surges and rejections beyond just structural shifts.
FEATURES
Swing Detection: It detects and labels Higher Highs (HH), Higher Lows (HL), Lower Highs (LH), and Lower Lows (LL) based on user-defined time horizons, helping traders quickly spot the trend direction.
BOS and CHoCH Lines: When a previous swing point is broken, the script automatically plots a Break of Structure (BOS) line. If the break represents a major trend reversal (a CHoCH), it is marked differently to separate simple breakouts from real trend changes.
Rejection Signals: Special arrows plot when price pierces a band and then pulls back, suggesting a potential trap move or rejection signal in the direction of the new structure.
Alerts: Built-in alerts for structure breaks, CHoCHs, swing points, rejections at bands, and trend flips make it easy to automate setups without manually watching the chart.
USAGE
Set your preferred swing detection size depending on your timeframe and trading style — smaller numbers for intraday, larger numbers for swing trading. Choose whether you want BOS/CHoCH confirmed by candle closes or by wick breaks. Use the volatility band settings to fine-tune how tightly or loosely the bands hug the price, adjusting sensitivity based on market conditions. When a BOS or CHoCH occurs, or when a rejection happens at the bands, the script will highlight it clearly and optionally trigger alerts. Watch for combinations where both structure breaks and volatility band rejections happen together — those are high-quality trade signals. This setup works best when used with basic trend filtering and higher timeframe confirmation.

Liquidity Trap Reversal Pro (Radar v2)Liquidity Trap Reversal Pro (Radar v2) is a non-repainting indicator designed to detect hidden liquidity traps at key swing highs and lows. It combines wick analysis, volume spike detection, and optional trend and exhaustion filters to identify high-probability reversal setups.
🔷 Features:
Non-Repainting: Pivots confirmed after lookback period, no future leaking.
Volume Spike Detection: Filters traps that occur during major liquidity events.
EMA Trend Filter (Optional): Focus on traps aligned with the prevailing trend.
Higher Timeframe Trend Filter (Optional): Confirm traps using a higher timeframe EMA bias.
Exhaustion Guard (Optional): Prevents traps after overextended moves based on ATR stretch.
Clean Visuals: Distinct plots for raw trap points vs confirmed traps.
Alerts Included: Set alerts for confirmed high/low liquidity traps.
📚 How to Use:
Watch for Trap Signals:
A Trap High signal suggests a potential bearish reversal.
A Trap Low signal suggests a potential bullish reversal.
Use Confirmed Signals for Best Entries:
Confirmed traps fire only after price moves opposite to the trap direction, adding reliability.
Use Trend Filters to Improve Accuracy:
In an uptrend (price above EMA), prefer Trap Lows (buy setups).
In a downtrend (price below EMA), prefer Trap Highs (sell setups).
Use the Exhaustion Guard to Avoid Bad Trades:
This filter blocks signals when price has moved too far from trend, helping avoid late entries.
Recommended Settings:
Best used on 15-minute, 1-hour, or 4-hour charts.
Trend filter ON for trending markets.
Exhaustion guard ON for volatile or stretched markets.
📈 Important Notes:
This script does not repaint once a pivot is confirmed.
Alerts trigger only on confirmed trap signals.
Always combine signals with sound risk management and trading strategy.
Disclaimer:
This script is for educational purposes only. It is not investment advice or a guarantee of results. Always do your own research before trading.

[Stop!Loss] ADR Signal ADR Signal - a technical indicator located in a separate window, which displays by default the 80%-level , as well as the 100%-level of the average daily range (ADR) for the last 10 days and compares it with the current intraday range. The indicator helps not only with the use of a mathematical-statistical method to identify a potential reversal at the moment during intraday trading, but can also serves as an effective assistant in risk management.
👉 Basic mechanics of the indicator
Firstly, this indicator tracks the performance of the standard ATR indicator on the daily chart, in other words, ADR (Average Daily Range).
Important ❗️The ATR (Average True Range) indicator was created by J. Welles Wilder Jr. He first introduced ATR in his book "New Concepts in Technical Trading Systems", published in 1978. Wilder developed this indicator to measure market volatility to help traders estimate the range of price movements. This indicator is built into TradingView, more details can be found by link: www.tradingview.com
Like ATR , ADR calculates the average true range for a specified period. In this case, the distance in points from the maximum of each day to its minimum is calculated, after which the arithmetic mean is calculated - this is ADR .
👉 Visualization
ADR Signal is located in a separate window on the chart and has 3 levels:
1) "ADR level" (green line) - the same parameter, the calculations of which are briefly described above. There is 100%-level of ATR on the daily chart (ADR).
2) "Current level" (red line) - this is the current price passage within the day, calculated in points. At the start of a new day, this parameter is reset. Therefore, in the indicator window, this line has sharp drops at the start of a new trading day: "A new trading day - the instrument's power reserve is renewed again".
3) "Signal level" (blue line) - this is an individually customized value that demonstrates a certain part of the ADR parameter.
👉 Inputs
1) - is responsible for the ATR indicator period, the value of which will always be calculated on the daily chart. The default value is "10", that is, ATR is calculated for the last 10 days (not including the current one).
2) - signal level (in %). The default value is "0.8", that is, 80%-level of the ADR parameter (set earlier) is calculated.
👉 Style
1) - by default, this level is colored "blue".
2) - by default, this level is colored "red".
3) - by default, this level is colored "green".
👉 How to use this indicator
Important❗️ The two methods of the use of the ADR Signal indicator described below will be most effective when trading intraday (which is highlighted quite well below), so it is more logical to use the indicator information on time periods H1 and below.
1) Identifying potential reversals during intraday trading:
The ADR Signal indicator can be used as a potential individual reversal strategy.
Important ❗️It should be noted that using it in it without additional confirming analysis tools will be a rather aggressive trading approach. Therefore, it is best to support the entry point in particular with other methods.
In this case, the crossing of the red line (the number of points passed within the current day, that is, from the minimum of the current day to its maximum) and the blue line (color of the Signal level based on the default settings), indicates that the trading instrument has passed 80% (based on the default settings for the "Signal level") of its average distance from the maximum to the minimum over the past 10 days (based on the default settings for the "ADR Length"). Such a situation in the context of the mathematical-statistical approach indicates a probable reversal, since the "power reserve" of this instrument is mostly exhausted, so one can expect with a higher probability, at least, a price stop and possibly a reversal. In case of crossing of the red line and the green one (ADR level), it says again that based on the mathematical-statistical approach, this trading instrument has completely exhausted its intraday "power reserve". In this situation, a stop or reversal of the price will be even more likely.
Of course, using the "Signal level" parameter, one can filter out even more reliable situations for potential price reversals within a day, namely, by specifying, for example, 1.5 in the field of this parameter. Under such conditions, in the case of crossing the red and blue lines (based on the default style settings), to say that the trading instrument has passed 150% of its average distance over the last 10 days (based on the default style settings "ADR length"). In this case, the probability of a stop or reversal of the price increases even more.
2) Use in risk management:
In terms of risk management, this indicator is more applicable to open trades. For example, if one had an open Buy-position (especially if it is an intraday trade) and the price has raised significantly during the day, then the crossing of the red line with the blue line , and especially the red line with the green line , may indicate that the price will most likely stop growing, since the "power reserve" is almost or completely exhausted for this instrument within the current day. In this case, one can, at a minimum, move the trade to breakeven or even partially fix the profit.
We will continue to discuss the methods of using this indicator and strategies based on it here. And we are always waiting for your reactions and feedback on this topic 💬.
Thank you for your support 🚀

Zen MIG Reversal V1**Zen MIG Reversal V1**
Zen MIG Reversal is a pattern-based indicator that highlights rare reversal setups.
It’s designed to support traders in visually identifying potential turning points, especially following strong momentum or gap-style moves.
**How it works:**
- **Bullish Reversal:**
Detects 3 consecutive bullish candles. The third bar must have a low above the high of the first bar and below the 20 EMA. When this occurs, a light blue box is drawn across the 3-bar range, from high to the current bar’s low. A blue arrow appears below the prior bar.
- **Bearish Reversal:**
Detects 3 consecutive bearish candles. The third bar must have a high below the low of the first bar and above the 20 EMA. A light red box is drawn from low to the current bar’s high. A red arrow appears above the prior bar.
- Optional settings allow you to:
- Show or hide the EMA line
- Toggle the arrows
- Adjust smoothing settings for context
**Purpose:**
It’s best used for discretionary analysis, journaling, or studying price behavior in momentum-driven environments.
**Disclaimer:**
This script is for educational and informational purposes only. It does not provide financial advice or trade recommendations. Always backtest and use proper risk management before applying any indicator to live trading.

Adaptive Support & Resistance Levels [StabTrading]The Adaptive S&R Levels indicator is designed to study support and resistance levels by synthesizing multiple well-known techniques for identifying these zones. It aims to provide traders with reliable price levels that reflect the collective perspective of market participants, using historical price action and projective techniques for extreme conditions.
💡 Introduction: Identified Problem
Traders often draw support and resistance lines using varied methods, leading to inconsistencies in where these levels are placed on charts. This variability can reduce the effectiveness of individual levels, as price may not react strongly to zones that lack broad recognition. The Adaptive S&R Levels indicator addresses this by aggressively averaging multiple established techniques to create support and resistance lines that align with what most traders are likely to identify, increasing the probability of price reactions.
🚀 How it Works: Overview
The indicator employs a multi-technique algorithm to generate support and resistance levels, ensuring they represent a consensus of trader perspectives.
🚀 How it Works: Chart Levels Display and Styling
Support levels, displayed in green below the current price, and resistance levels, shown in red above the price, are plotted clearly on the chart. Levels are numbered sequentially (e.g., v1, v2) as they move further from the current price, providing a visual hierarchy of proximity. Extreme levels, labeled as "Extreme Support" or "Extreme Resistance," are plotted in a bolder color to distinguish them as the outermost boundaries, maintaining the same green (support) and red (resistance) color scheme for consistency.
🚀 How it Works: Historical Price Action Algorithm
For areas with available historical data, the algorithm analyzes price action using a variety of recognized methods for drawing support and resistance, such as pivot points, swing highs/lows, and volume-based zones. It calculates a weighted average of these techniques to produce a “regression fit” line that reflects the accumulation of levels traders might draw. By prioritizing areas where multiple methods converge, the indicator identifies zones likely to be significant to a wide audience, enhancing their relevance.
🚀 How it Works: Projective Techniques Algorithm
In scenarios without recent historical price action—such as all-time highs or lows—the indicator employs an alternative algorithm that combines projective techniques commonly used by traders. These include Fibonacci extensions, Measured Moves (price projections), Psychological Milestones (e.g., round numbers), Channel/Trendline Extrapolation, and Time-Based Targets (inspired by methods like Gann techniques). The algorithm seeks a confluence of these methods to draw support and resistance levels that align with what most traders would consider significant in such conditions. These levels maintain the same green (support) and red (resistance) color scheme, with numbering based on their distance from the price.
🚀 How it Works: Noise Parameter Adjustment
Users can adjust a noise parameter to control the number of displayed levels. Lower settings show more lines, reflecting a broader range of potential zones but with less confluence. Higher settings increase the required confluence of techniques, resulting in fewer lines that have a higher probability of eliciting a price reaction. This customization allows traders to tailor the indicator to their preferred timeframe or trading style.
🔥 Features
Confluence-Based Levels: Support and resistance lines are derived from a weighted average of multiple techniques, aiming to mirror the levels most traders would recognize.
Extreme Levels: Generates support and resistance in areas without historical price action, using techniques like Fibonacci extensions and Measured Moves.
Color-Coded Display: Green support levels appear below the current price, and red resistance levels appear above, with extreme levels in a bolder shade for distinction.
Adjustable Noise Parameter: Users can modify the confluence threshold to display more lines (lower settings) or fewer, higher-probability lines (higher settings).
📈 Implementing the System
1. Adjust Settings
Set the noise parameter based on your trading style (0.1 to 10).
Use lower values for more frequent levels, suitable for scalping or short-term analysis.
Use higher values for fewer, higher-confluence levels, ideal for swing trading or longer-term strategies.
Adjust for your timeframe: Settings tend to be lower on shorter timeframes and higher on longer timeframes.
2. Identify Levels
Monitor green support levels below the price for potential buying zones, noting their numbered proximity (v1, v2, etc.).
Observe red resistance levels above the price for potential selling or shorting zones, noting their numbered proximity.
Note extreme levels (labeled "Extreme Support" or "Extreme Resistance") in areas like all-time highs, which may act as key reversal points.
3. Evaluate Price Reactions
Track how price interacts with the plotted levels to assess their effectiveness, considering their proximity to price.
Observe performance in bullish, bearish, or ranging markets to understand the indicator’s behavior at different levels.
Test different noise parameter settings across various assets and timeframes to find the optimal balance for your approach.
4. Layering Trades with Levels
Use the numbered levels to layer into a trade: for example, enter a partial position at a closer support level (e.g., v1) and add to it at a further level (e.g., v2) if price continues to decline, spreading risk across multiple zones.
Layer out of a trade by taking partial profits at each resistance level as price rises (e.g., reduce position at v1, then v2), or fully exit at an "Extreme Resistance" level to maximize gains while managing exposure.
🔶 Conclusion
The Adaptive S&R Levels indicator provides a framework for studying support and resistance by averaging multiple trader-recognized techniques. With its ability to handle both historical and extreme price scenarios, numbered levels for visual hierarchy, and customizable noise settings, it offers a versatile tool for analyzing key price levels. Designed for educational use, it encourages traders to test and observe how these consensus-driven levels align with market behavior within broader analysis.

Volume NodesVolume Nodes Indicator:
What This Indicator Does:
The Volume Nodes indicator identifies and visualizes statistically significant volume events on your chart, helping you identify important price levels where substantial trading activity has occurred. Unlike standard volume indicators, Volume Nodes:
Uses statistical analysis (z-scores) to identify truly abnormal volume bars
Calculates accurate buy/sell volume ratios by analyzing all lower timeframe data
Identifies the Volume Point of Control (VPOC) for high volume areas
Visualizes significant volume ranges as they extend across the chart
Tracks when price interacts with these important levels
Key Features:
High Volume Detection: Highlights bars with unusually high volume (z-score above threshold)
Low Volume Detection: Highlights bars with unusually low volume (z-score below threshold)
VPOC Lines: Horizontal lines showing the exact price level with maximum volume concentration
Volume Range Fills: Shaded areas showing the entire price range with significant volume
Accurate Volume Metrics: Shows true buy/sell volume ratios or delta percentages derived from lower timeframe data
How to Use It in Your Trading: **Move to front in the visual order on chart**
Step 1: Identify Important Volume Zones
High Volume Bars (green/red candles) indicate where significant buying or selling has occurred
VPOC Lines extending from these bars show you the exact price level with highest volume
Range Fills show you the entire zone where significant volume occurred
Step 2: Use These Levels for Trading Decisions
Support/Resistance: VPOC lines often act as support or resistance levels
Breakout Validation: Breakouts on high volume are more likely to be valid
Low Volume Warning: Low volume bars (yellow) often indicate indecision or potential reversals
Trading with Volume Flow: Use the buy/sell ratio or delta % to confirm the strength and direction of moves
Step 3: Monitor Price Interaction with Volume Zones
When price approaches a VPOC line, watch for reaction (bounce or breakout)
When price enters a volume range area, increased volatility often follows
When price crosses a VPOC line, the line changes transparency indicating it's been tested
Tips for Optimal Use
Higher Timeframes: The indicator works exceptionally well on higher timeframes (4H, daily, weekly) where volume patterns are more significant
Range Trading: Use volume nodes to identify the boundaries of trading ranges
Combine with Price Action: Look for price action confirmation (rejections, engulfing patterns) at VPOC levels
Multiple Timeframe Analysis: Compare volume nodes across different timeframes to find confluent levels
Alert Setup: Set up alerts for when price enters important volume zones or crosses VPOC lines
Reversal Signals: High volume bars with significant wicks often signal exhaustion points where smart money is transferring positions. Bullish candles with long upper wicks suggest sellers absorbing buying pressure at highs, while bearish candles with long lower wicks indicate buyers stepping in at lows - both potentially signaling momentum shifts that precede reversals.
The indicator is particularly valuable for identifying levels where large players have been active in the market and are likely to defend or act again in the future.

Aurora Flow Oscillator [QuantAlgo]The Aurora Flow Oscillator is an advanced momentum-based technical indicator designed to identify market direction, momentum shifts, and potential reversal zones using adaptive filtering techniques. It visualizes price momentum through a dynamic oscillator that quantifies trend strength and direction, helping traders and investors recognize momentum shifts and trading opportunities across various timeframes and asset class.
🟢 Technical Foundation
The Aurora Flow Oscillator employs a sophisticated mathematical approach with adaptive momentum filtering to analyze market conditions, including:
Price-Based Momentum Calculation: Calculates logarithmic price changes to measure the rate and magnitude of market movement
Adaptive Momentum Filtering: Applies an advanced filtering algorithm to smooth momentum calculations while preserving important signals
Acceleration Analysis: Incorporates momentum acceleration to identify shifts in market direction before they become obvious
Signal Normalization: Automatically scales the oscillator output to a range between -100 and 100 for consistent interpretation across different market conditions
The indicator processes price data through multiple filtering stages, applying mathematical principles including exponential smoothing with adaptive coefficients. This creates an oscillator that dynamically adjusts to market volatility while maintaining responsiveness to genuine trend changes.
🟢 Key Features & Signals
1. Momentum Flow and Extreme Zone Identification
The oscillator presents market momentum through an intuitive visual display that clearly indicates both direction and strength:
Above Zero: Indicates positive momentum and potential bullish conditions
Below Zero: Indicates negative momentum and potential bearish conditions
Slope Direction: The angle and direction of the oscillator provide immediate insight into momentum strength
Zero Line Crossings: Signal potential trend changes and new directional momentum
The indicator also identifies potential overbought and oversold market conditions through extreme zone markings:
Upper Zone (>50): Indicates strong bullish momentum that may be approaching exhaustion
Lower Zone (<-50): Indicates strong bearish momentum that may be approaching exhaustion
Extreme Boundaries (±95): Mark potentially unsustainable momentum levels where reversals become increasingly likely
These zones are displayed with gradient intensity that increases as the oscillator moves toward extremes, helping traders and investors:
→ Identify potential reversal zones
→ Determine appropriate entry and exit points
→ Gauge overall market sentiment strength
2. Customizable Trading Style Presets
The Aurora Flow Oscillator offers pre-configured settings for different trading approaches:
Default (80,150): Balanced configuration suitable for most trading and investing situations.
Scalping (5,80): Highly responsive settings for ultra-short-term trades. Generates frequent signals and catches quick price movements. Best for 1-15min charts when making many trades per day.
Day Trading (8,120): Optimized for intraday movements with faster response than default settings while maintaining reasonable signal quality. Ideal for 5-60min or 4h-12h timeframes.
Swing Trading (10,200): Designed for multi-day positions with stronger noise filtering. Focuses on capturing larger price swings while avoiding minor fluctuations. Works best on 1-4h and daily charts.
Position Trading (14,250): For longer-term position traders/investors seeking significant market trends. Reduces false signals by heavily filtering market noise. Ideal for daily or even weekly charts.
Trend Following (16,300): Maximum smoothing that prioritizes established directional movements over short-term fluctuations. Best used on daily and weekly charts, but can also be used for lower timeframe trading.
Countertrend (7,100): Tuned to detect potential reversals and exhaustion points in trends. More sensitive to momentum shifts than other presets. Effective on 15min-4h charts, as well as daily and weekly charts.
Each preset automatically adjusts internal parameters for optimal performance in the selected trading context, providing flexibility across different market approaches without requiring complex manual configuration.
🟢 Practical Usage Tips
1/ Trend Analysis and Interpretation
→ Direction Assessment: Evaluate the oscillator's position relative to zero to determine underlying momentum bias
→ Momentum Strength: Measure the oscillator's distance from zero within the -100 to +100 range to quantify momentum magnitude
→ Trend Consistency: Monitor the oscillator's path for sustained directional movement without frequent zero-line crossings
→ Reversal Detection: Watch for oscillator divergence from price and deceleration of movement when approaching extreme zones
2/ Signal Generation Strategies
Depending on your trading approach, multiple signal strategies can be employed:
Trend Following Signals:
Enter long positions when the oscillator crosses above zero
Enter short positions when the oscillator crosses below zero
Add to positions on pullbacks while maintaining the overall trend direction
Countertrend Signals:
Look for potential reversals when the oscillator reaches extreme zones (±95)
Enter contrary positions when momentum shows signs of exhaustion
Use oscillator divergence with price as additional confirmation
Momentum Shift Signals:
Enter positions when oscillator changes direction after establishing a trend
Exit positions when oscillator direction reverses against your position
Scale position size based on oscillator strength percentage
3/ Timeframe Optimization
The indicator can be effectively applied across different timeframes with these considerations:
Lower Timeframes (1-15min):
Use Scalping or Day Trading presets
Focus on quick momentum shifts and zero-line crossings
Be cautious of noise in extreme market conditions
Medium Timeframes (30min-4h):
Use Default or Swing Trading presets
Look for established trends and potential reversal zones
Combine with support/resistance analysis for entry/exit precision
Higher Timeframes (Daily+):
Use Position Trading or Trend Following presets
Focus on major trend identification and long-term positioning
Use extreme zones for position management rather than immediate reversals
🟢 Pro Tips
Price Momentum Period:
→ Lower values (5-7) increase sensitivity to minor price fluctuations but capture more market noise
→ Higher values (10-16) emphasize sustained momentum shifts at the cost of delayed response
→ Adjust based on your timeframe (lower for shorter timeframes, higher for longer timeframes)
Oscillator Filter Period:
→ Lower values (80-120) produce more frequent directional changes and earlier response to momentum shifts
→ Higher values (200-300) filter out shorter-term fluctuations to highlight dominant market cycles
→ Match to your typical holding period (shorter holding time = lower filter values)
Multi-Timeframe Analysis:
→ Compare oscillator readings across different timeframes for confluence
→ Look for alignment between higher and lower timeframe signals
→ Use higher timeframe for trend direction, lower for earlier entries
Volatility-Adaptive Trading:
→ Use oscillator strength to adjust position sizing (stronger = larger)
→ Consider reducing exposure when oscillator reaches extreme zones
→ Implement tighter stops during periods of oscillator acceleration
Combination Strategies:
→ Pair with volume indicators for confirmation of momentum shifts
→ Use with support/resistance levels for strategic entry and exit points
→ Combine with volatility indicators for comprehensive market context

Bullish & Bearish Engulfing ProHello Traders!
Overview
The Bullish & Bearish Engulfing Pro indicator is a powerful pattern recognition tool that identifies key reversal points and trend continuation opportunities. These engulfing patterns often mark the beginning of a significant price move and are widely used in technical analysis. For example, in an uptrend, a Bullish Engulfing pattern can provide an ideal pullback entry signal.
This indicator combines traditional candlestick theory with advanced technical filters like trend direction and volatility analysis to offer traders precise, high-confidence signals.
Key Features :
Accurate pattern detection:
Uses refined algorithms to detect true Bullish and Bearish Engulfing patterns, filtering out noise and false positives.
Trend filter:
Customizable Simple Moving Average (SMA) ensures trades are aligned with the market’s broader trend, improving trade success rates.
Volatility awareness:
ATR-based filtering ensures that only statistically significant engulfing patterns are highlighted.
Visual clarity:
Bullish and Bearish Engulfing patterns are displayed with distinct, customizable colors and labels for instant recognition.
Flexible customization:
Users can adjust detection criteria, SMA settings, and visual options to suit their personal strategy.
Filtered signal display:
Option to visualize filtered-out signals to better understand how the logic makes its decisions.
Bullish Engulfing Pattern
Appears after a downtrend or during a pullback in an uptrend
Consists of two candles
A smaller bearish candle
Followed by a larger bullish candle that completely engulfs the previous body
Bearish Engulfing Pattern
Appears after an uptrend or during a pullback in a downtrend
Consists of two candles
A smaller bullish candle
Followed by a larger bearish candle that completely engulfs the previous body
Key differences in this implementation
What makes this indicator unique
Trend and volatility filters
Ensure patterns occur in meaningful market conditions
Comprehensive pattern analysis:
Factors in candle body ratios, wick sizes, and relative size to past candles for smarter detection
Adaptive to market conditions:
Dynamic thresholds based on ATR allow pattern recognition to adjust to different volatility regimes
Educational value:
Visualizing rejected patterns helps traders build intuition and refine their discretion
How to Trade with this Indicator
Engulfing patterns can signal strong reversals or pullback continuations. Use them with trend and volume confirmation to maximize their effectiveness.
snapshot
Bullish Opportunities:
Look for Bullish Engulfing patterns (aqua-colored candles and labels) during or after a pullback in an uptrend.
Bearish Opportunities:
Watch for Bearish Engulfing patterns (orange-colored candles and labels) during or after a rally in a downtrend.
Entry: Enter on the next bar open after the engulfing candle completes.
Stop loss: 2 ticks below/above the engulfing candle’s low/high.
Take profit: Aim for at least a 2R target, a swing high/low or manage the tradewith a trailing stop.
Trend Alignment:
For higher win probability, take trades only in the direction of the SMA-defined trend.
Note: To ensure the candle coloring appears correctly, place the indicator at the top of the object tree.

Reversal Strength Meter – Adib NooraniThe Reversal Strength Meter is an oscillator designed to identify potential reversal zones based on supply and demand dynamics. It uses smoothed stochastic logic to reduce noise and highlight areas where momentum may be weakening, signaling possible market turning points.
🔹 Smooth, noise-reduced stochastic oscillator
🔹 Custom zones to highlight potential supply and demand imbalances
🔹 Non-repainting, compatible across all timeframes and assets
🔹 Visual-only tool — intended to support discretionary trading decisions
This oscillator assists scalpers and intraday traders in tracking subtle shifts in momentum, helping them identify when a market may be preparing to reverse — always keeping in mind that trading is based on probabilities, not certainties.
📘 How to Use the Indicator Efficiently
For Reversal Trading:
Buy Setup
– When the blue line dips below the 20 level, wait for it to re-enter above 20.
– Look for reversal candlestick patterns (e.g., bullish engulfing, hammer, or morning star).
– Enter above the pattern’s high, with a stop loss below its low.
Sell Setup
– When the blue line rises above the 80 level, wait for it to re-enter below 80.
– Look for bearish candlestick patterns (e.g., bearish engulfing, inverted hammer, or evening star).
– Enter below the pattern’s low, with a stop loss above its high.
🛡 Risk Management Guidelines
Risk only 0.5% of your capital per trade
Book 50% profits at a 1:1 risk-reward ratio
Trail the remaining 50% using price action or other supporting indicators

Reversal Scalping Ribbon - Adib NooraniThe Reversal Scalping Ribbon is a trend-following overlay tool designed to visually identify potential reversal zones based on price extremes and dynamic volatility bands. It calculates adaptive upper and lower bands using price action and custom ATR logic, helping traders quickly assess market direction and possible turning points
🔹 Volatility-adjusted bands based on price highs/lows
🔹 Color-coded ribbons to indicate trend bias and potential reversal shifts
🔹 No repainting, works on all timeframes and assets
🔹 Visual-only display, no trade signals — supports discretion-based entries
This ribbon is designed for scalpers and intraday traders to spot reversal setups with clarity. It enhances your trading by showing real-time market bias without unnecessary distractions. By focusing on probabilities, it helps to improve decision-making in fast-paced environments
How to use the indicator efficiently
For Reversal Trading:
Buy: When price closes below the green ribbon with a red candle, then re-enters with a green candle. Enter above the high of the green candle with a stop loss below the lowest low of the recent green/red candles
Sell: When price closes above the red ribbon with a green candle, then re-enters with a red candle. Enter below the low of the red candle with a stop loss above the highest high of the recent red/green candles
Risk Management:
Limit risk to 0.5% of your capital per trade
Take 50% profit at a 1:1 risk-reward ratio
For the remaining 50%, trail using the lower edge of the green band for buys and the upper edge of the red band for sells

Trend Targets [AlgoAlpha]OVERVIEW
This script combines a smoothed trend-following model with dynamic price rejection logic and ATR-based target projection to give traders a complete visual framework for trading trend continuations. It overlays on price and automatically detects potential trend shifts, confirms rejections near dynamic support/resistance, and displays calculated stop-loss and take-profit levels to support structured risk-reward management. Unlike traditional indicators that only show trend direction or signal entries, this tool brings together a unique mix of signal validation, volatility-aware positioning, and layered profit-taking to guide decision-making with more context.
CONCEPTS
The core trend logic is built on a custom Supertrend that uses an ATR-based band structure with long smoothing chains—first through a WMA, then an EMA—allowing the trend line to respond to major shifts while ignoring noise. A key addition is the use of rejection logic: the script looks for consolidation candles that "hug" the smoothed trend line and counts how many consecutive bars reject from it. This behavior often precedes significant moves. A user-defined threshold filters out weak tests and highlights only meaningful rejections.
FEATURES
Trend Detection : Automatically identifies trend direction using a smoothed Supertrend (WMA + EMA), with shape markers on trend shifts and color-coded bars for clarity.
Rejection Signals : Detects price rejections at the trend line after a user-defined number of consolidation bars; plots ▲/▼ icons to highlight strong continuation setups.
Target Projection : On trend confirmation, plots entry, stop-loss (ATR-based), and three dynamic take-profit levels based on customizable multiples.
Dynamic Updates : All levels (entry, SL, TP1–TP3) auto-adjust based on volatility and are labeled in real time on the chart.
Customization : Users can tweak trend parameters, rejection confirmation count, SL/TP ratios, smoothing lengths, and appearance settings.
Alerts : Built-in alerts for trend changes, rejection events, and when TP1, TP2, or TP3 are reached.
Chart Overlay : Plots directly on price chart with minimal clutter and clearly labeled levels for easy trading.
USAGE
Start by tuning the Supertrend factor and ATR period to fit your asset and timeframe—higher values will catch bigger swings, lower values catch faster moves. The confirmation count should match how tightly you want to filter rejection behavior—higher values make signals rarer but stronger. When the trend shifts, the indicator colors the bars and line accordingly, and if enabled, plots the full entry-TP-SL structure. Rejection markers appear only after enough qualifying bars confirm price pressure at the trend line. This is especially useful for continuation plays where price retests the trend but fails to break it. All calculations are based on volatility (ATR), so targets naturally adjust with market conditions. Add alerts to get notified of important signals even when away from the chart.

Smarter Money Concepts - OBs [PhenLabs]📊 Smarter Money Concepts - OBs
Version: PineScript™ v6
📌 Description
Smarter Money Concepts - OBs (Order Blocks) is an advanced technical analysis tool designed to identify and visualize institutional order zones on your charts. Order blocks represent significant areas of liquidity where smart money has entered positions before major moves. By tracking these zones, traders can anticipate potential reversals, continuations, and key reaction points in price action.
This indicator incorporates volume filtering technology to identify only the most significant order blocks, eliminating low-quality signals and focusing on areas where institutional participation is likely present. The combination of price structure analysis and volume confirmation provides traders with high-probability zones that may attract future price action for tests, rejections, or breakouts.
🚀 Points of Innovation
Volume-Filtered Block Detection : Identifies only order blocks formed with significant volume, focusing on areas with institutional participation
Advanced Break of Structure Logic : Uses sophisticated price action analysis to detect legitimate market structure breaks preceding order blocks
Dynamic Block Management : Intelligently tracks, extends, and removes order blocks based on price interaction and time-based expiration
Structure Recognition System : Employs technical analysis algorithms to find significant swing points for accurate order block identification
Dual Directional Tracking : Simultaneously monitors both bullish and bearish order blocks for comprehensive market structure analysis
🔧 Core Components
Order Block Detection : Identifies institutional entry zones by analyzing price action before significant breaks of structure, capturing where smart money has likely positioned before moves.
Volume Filtering Algorithm : Calculates relative volume compared to a moving average to qualify only order blocks formed with significant market participation, eliminating noise.
Structure Break Recognition : Uses price action analysis to detect legitimate breaks of market structure, ensuring order blocks are identified only at significant market turning points.
Dynamic Block Management : Continuously monitors price interaction with existing blocks, extending, maintaining, or removing them based on current market behavior.
🔥 Key Features
Volume-Based Filtering : Filter out insignificant blocks by requiring a minimum volume threshold, focusing only on zones with likely institutional activity
Visual Block Highlighting : Color-coded boxes clearly mark bullish and bearish order blocks with customizable appearance
Flexible Mitigation Options : Choose between “Wick” or “Close” methods for determining when a block has been tested or mitigated
Scan Range Adjustment : Customize how far back the indicator looks for structure points to adapt to different market conditions and timeframes
Break Source Selection : Configure which price component (close, open, high, low) is used to determine structure breaks for precise block identification
🎨 Visualization
Bullish Order Blocks : Blue-colored rectangles highlighting zones where bullish institutional orders were likely placed before upward moves, representing potential support areas.
Bearish Order Blocks : Red-colored rectangles highlighting zones where bearish institutional orders were likely placed before downward moves, representing potential resistance areas.
Block Extension : Order blocks extend to the right of the chart, providing clear visualization of these significant zones as price continues to develop.
📖 Usage Guidelines
Order Block Settings
Scan Range : Default: 25. Defines how many bars the indicator scans to determine significant structure points for order block identification.
Bull Break Price Source : Default: Close. Determines which price component is used to detect bullish breaks of structure.
Bear Break Price Source : Default: Close. Determines which price component is used to detect bearish breaks of structure.
Visual Settings
Bullish Blocks Color : Default: Blue with 85% transparency. Controls the appearance of bullish order blocks.
Bearish Blocks Color : Default: Red with 85% transparency. Controls the appearance of bearish order blocks.
General Options
Block Mitigation Method : Default: Wick, Options: Wick, Close. Determines how block mitigation is calculated - “Wick” uses high/low values while “Close” uses close values for more conservative mitigation criteria.
Remove Filled Blocks : Default: Disabled. When enabled, order blocks are removed once they’ve been mitigated by price action.
Volume Filter
Volume Filter Enabled : Default: Enabled. When activated, only shows order blocks formed with significant volume relative to recent average.
Volume SMA Period : Default: 15, Range: 1-50. Number of periods used to calculate the average volume baseline.
Min. Volume Ratio : Default: 1.5, Range: 0.5-10.0. Minimum volume ratio compared to average required to display an order block; higher values filter out more blocks.
✅ Best Use Cases
Identifying high-probability support and resistance zones for trade entries and exits
Finding optimal stop-loss placement behind significant order blocks
Detecting potential reversal areas where price may react after extended moves
Confirming breakout trades when price clears major order blocks
Building a comprehensive market structure map for medium to long-term trading decisions
Pinpointing areas where smart money may have positioned before major market moves
⚠️ Limitations
Most effective on higher timeframes (1H and above) where institutional activity is more clearly defined
Can generate multiple signals in choppy market conditions, requiring additional filtering
Volume filtering relies on accurate volume data, which may be less reliable for some securities
Recent market structure changes may invalidate older order blocks not yet automatically removed
Block identification is based on historical price action and may not predict future behavior with certainty
💡 What Makes This Unique
Volume Intelligence : Unlike basic order block indicators, this script incorporates volume analysis to identify only the most significant institutional zones, focusing on quality over quantity.
Structural Precision : Uses sophisticated break of structure algorithms to identify true market turning points, going beyond simple price pattern recognition.
Dynamic Block Management : Implements automatic block tracking, extension, and cleanup to maintain a clean and relevant chart display without manual intervention.
Institutional Focus : Designed specifically to highlight areas where smart money has likely positioned, helping retail traders align with institutional perspectives rather than retail noise.
🔬 How It Works
1. Structure Identification Process :
The indicator continuously scans price action to identify significant swing points and structure levels within the specified range, establishing a foundation for order block recognition.
2. Break Detection :
When price breaks an established structure level (crossing below a significant low for bearish breaks or above a significant high for bullish breaks), the indicator marks this as a potential zone for order block formation.
3. Volume Qualification :
For each potential order block, the algorithm calculates the relative volume compared to the configured period average. Only blocks formed with volume exceeding the minimum ratio threshold are displayed.
4. Block Creation and Management :
Valid order blocks are created, tracked, and managed as price continues to develop. Blocks extend to the right of the chart until they are either mitigated by price action or expire after the designated timeframe.
5. Continuous Monitoring :
The indicator constantly evaluates price interaction with existing blocks, determining when blocks have been tested, mitigated, or invalidated, and updates the visual representation accordingly.
💡 Note:
Order Blocks represent areas where institutional traders have likely established positions and may defend these zones during future price visits. For optimal results, use this indicator in conjunction with other confluent factors such as key support/resistance levels, trendlines, or additional confirmation indicators. The most reliable signals typically occur on higher timeframes where institutional activity is most prominent. Start with the default settings and adjust parameters gradually to match your specific trading instrument and style.

7-Channel Trend Meter v3🔥 7-Channel Trend Meter – Ultimate Trend Confirmation Tool 💹
Purpose: Supplementary indicator used as confirmation
The 7-Channel Trend Meter offers an all-in-one confirmation system that combines 7 high-accuracy indicators into one easy-to-read visual tool. Say goodbye to guesswork and unnecessary tab-switching—just clear, actionable signals for smarter trades. Whether you're trading stocks, crypto, or forex, this indicator streamlines your decision-making process and enhances your strategy’s performance.
⚙️ What’s Inside The Box?
Here is each tool that the Trend Meter uses, and why/how they're used:
Average Directional Index: Confirms market strength ✅
Directional Movement Index: Confirms trend direction ✅
EMA Cross: Confirms reversals in trend through average price ✅
Relative Strength Index: Confirms trend through divergences ✅
Stochastic Oscillator: Confirms shifts in momentum ✅
Supertrend: Confirms trend-following using ATR calculations ✅
Volume Delta: Confirms buying/selling pressure weight by finding differences ✅
🧾 How To Read It:
🟨 Bar 1 – Market Strength Meter:
Light Gold 🟡: Strong market with trending conditions.
Dark Gold 🟤: Weakening market or consolidation—proceed with caution.
📊 Bars 2 to 7 – Trend Direction Confirmations:
🟩 Green: Bullish signal, uptrend likely.
🟥 Red: Bearish signal, downtrend likely.
💯 Why it's helpful to traders:
✅ 7 Confirmations in 1 View: No need to flip between multiple charts.
✅ Visual Clarity: Spot trends instantly with a quick glance.
✅ Perfect for Entry Confirmation: Confirm trade signals before pulling the trigger.
✅ Boosts Your Win Rate: Make data-backed decisions, not guesses.
✅ Works Across Multiple Markets: Stocks, crypto, forex—you name it 🌍.
🤔 "What's with the indicator mashup/How do these components work together? 🤔
The 7-Channel Trend Meter is designed as an original and useful tool that integrates multiple indicators to enhance trading decisions, rather than merely combining existing tools without logical coherence. This strategic mashup creates a comprehensive analysis framework that offers deeper insights into market conditions by capitalizing on each component's unique strengths. The careful integration of seven indicators creates a unified system that eliminates conflicting signals and enhances the decision-making process. Rather than simply merging indicators for the sake of it, the 7-Channel Trend Meter is designed to streamline trading strategies, making it a practical tool for traders across various markets. By leveraging the combined strengths of these indicators, traders can act with greater confidence, backed by comprehensive data rather than fragmented insights. Here’s how they synergistically work together:
Average Directional Index (ADX) and Directional Movement Index (DMI): The reason for this mashup is because ADX indicates the strength of the prevailing trend, while the DMI pinpoints its direction. Together, they equip traders with a dual framework that not only identifies whether to engage with a trend but also quantifies its strength, allowing for more decisive trading strategies.
EMA Cross: The reason for this addition to the mashup is because this tool signals potential trend reversals by identifying moving average crossovers. When combined with the ADX and DMI, traders can better differentiate between genuine trend shifts and market noise, leading to more accurate entries.
Relative Strength Index (RSI) and Stochastic Oscillator: The reason for this mashup is because by using both momentum indicators, traders gain a multifaceted view of market dynamics. The RSI assesses overbought or oversold conditions, while the Stochastic Oscillator confirms momentum shifts. When both agree with the trend signals from the DMI, it enhances the reliability of reversal or continuation strategies.
Supertrend: The reason for this addition to the mashup is because as a trailing stop based on market volatility, the Supertrend indicator works hand-in-hand with the ADX’s strength assessment, allowing traders to ride strong trends while managing risk. This cohesion prevents premature exits during minor pullbacks.
Volume Delta: The reason for this addition to the mashup is because integrating volume analysis helps validate signals from the price action indicators. Significant volume behind a price movement reinforces the likelihood of its continuation, ensuring that traders can act on well-supported signals.
🔍 How it does what it says it does 🔍
While the exact calculations remain proprietary, the following outlines how the components synergistically work to aid traders in making informed decisions:
Market Strength Assessment: Average Directional Index (ADX)
This component is used as confirmation by measuring the strength of the market trend on a scale from 0 to 100. A reading above 20 generally indicates a strong trend, while readings below 20 suggest sideways movement. The Trend Meter flags strong trends, effectively helping traders identify optimal conditions for entering positions.
Trend Direction Confirmation: Directional Movement Index (DMI)
This component is used as confirmation by distinguishing between bullish and bearish trends by evaluating price movements. This combination allows traders to confirm not only if a trend exists but also its direction, informing whether to buy or sell.
Trend Reversal Detection: Exponential Moving Average (EMA) Cross
This component is used as confirmation by calculating two EMAs (one shorter and one longer) to identify potential reversal points. When the shorter EMA crosses above the longer EMA, it signals a bullish reversal, and vice versa for bearish reversals. This helps traders pinpoint optimal entry or exit points.
Momentum Analysis: Relative Strength Index (RSI) and Stochastic Oscillator
These components are used as confirmation by providing insights into momentum. The RSI assesses the speed and change of price movements, indicating overbought or oversold conditions. The Stochastic Oscillator compares a particular closing price to a range of prices over a specified period. This helps identify whether momentum is slowing or speeding up, offering a clear view of potential reversal points. When both the RSI and Stochastic Oscillator converge on signals, it increases the reliability of those signals in trading decisions.
Volatility-Based Trend Following: Supertrend
This component is used as confirmation by utilizing Average True Range (ATR) calculations to help traders stay in momentum-driven trades by providing dynamic support and resistance levels that adapt to volatility. This enables better risk management while allowing traders to capture stronger trends.
Volume Confirmation: Volume Delta
This component is used as confirmation by analyzing buying and selling pressure by measuring the difference between buy and sell volumes, offering critical insights into market sentiment. Significant volume behind a price movement increases confidence in the sustainability of that move.
🧠 Pro Tip:
When all 7 bars line up in green or red, it’s time to take action: load up for a confirmed move or sit back and wait for market confirmation. Let the Trend Meter guide your strategy with precision.
Conclusion:
Integrate the 7-Channel Trend Meter as useful confirmation for your TradingView strategy and stop trading like the average retail trader. This tool eliminates the noise and helps you stay focused on high-confidence trades.

Larry Williams POIV A/D [tradeviZion]Larry Williams' POIV A/D - Release Notes v1.0
=================================================
Release Date: 01 April 2025
OVERVIEW
--------
The Larry Williams POIV A/D (Price, Open Interest, Volume Accumulation/Distribution) indicator implements Williams' original formula while adding advanced divergence detection capabilities. This powerful tool combines price movement, open interest, and volume data to identify potential trend reversals and continuations.
FEATURES
--------
- Implements Larry Williams' original POIV A/D formula
- Divergence detection system:
* Regular divergences for trend reversal signals
* Hidden divergences for trend continuation signals
- Fast Mode option for earlier pivot detection
- Customizable sensitivity for divergence filtering
- Dynamic color visualization based on indicator direction
- Adjustable smoothing to reduce noise
- Automatic fallback to OBV when Open Interest is unavailable
FORMULA
-------
POIV A/D = CumulativeSum(Open Interest * (Close - Close ) / (True High - True Low)) + OBV
Where:
- Open Interest: Current period's open interest
- Close - Close : Price change from previous period
- True High - True Low: True Range
- OBV: On Balance Volume
DIVERGENCE TYPES
---------------
1. Regular Divergences (Reversal Signals):
- Bullish: Price makes lower lows while indicator makes higher lows
- Bearish: Price makes higher highs while indicator makes lower highs
2. Hidden Divergences (Continuation Signals):
- Bullish: Price makes higher lows while indicator makes lower lows
- Bearish: Price makes lower highs while indicator makes higher highs
REQUIREMENTS
-----------
- Works best with futures and other instruments that provide Open Interest data
- Automatically adapts to work with any instrument by using OBV when OI is unavailable
USAGE GUIDE
-----------
1. Apply the indicator to any chart
2. Configure settings:
- Adjust sensitivity for divergence detection
- Enable/disable Fast Mode for earlier signals
- Customize visual settings as needed
3. Look for divergence signals:
- Regular divergences for potential trend reversals
- Hidden divergences for trend continuation opportunities
4. Use the alerts system for automated divergence detection
KNOWN LIMITATIONS
----------------
- Requires Open Interest data for full functionality
- Fast Mode may generate more signals but with lower reliability
ACKNOWLEDGEMENTS
---------------
This indicator is based on Larry Williams' work on Open Interest analysis. The implementation includes additional features for divergence detection while maintaining the integrity of the original formula.

DAMA OSC - Directional Adaptive MA OscillatorOverview:
The DAMA OSC (Directional Adaptive MA Oscillator) is a highly customizable and versatile oscillator that analyzes the delta between two moving averages of your choice. It detects trend progression, regressions, rebound signals, MA cross and critical zone crossovers to provide highly contextual trading information.
Designed for trend-following, reversal timing, and volatility filtering, DAMA OSC adapts to market conditions and highlights actionable signals in real-time.
Features:
Support for 11 custom moving average types (EMA, DEMA, TEMA, ALMA, KAMA, etc.)
Customizable fast & slow MA periods and types
Histogram based on percentage delta between fast and slow MA
Trend direction coloring with “Green”, “Blue”, and “Red” zones
Rebound detection using close or shadow logic
Configurable thresholds: Overbought, Oversold, Underbought, Undersold
Optional filters: rebound validation by candle color or flat-zone filter
Full visual overlay: MA lines, crossover markers, rebound icons
Complete alert system with 16 preconfigured conditions
How It Works:
Histogram Logic:
The histogram measures the percentage difference between the fast and slow MA:
hist_value = ((FastMA - SlowMA) / SlowMA) * 100
Trend State Logic (Green / Blue / Red):
Green_Up = Bullish acceleration
Blue_Up (or Red_Up, depending the display settings) = Bullish deceleration
Blue_Down (or Green_Down, depending the display settings) = Bearish deceleration
Red_Down = Bearish acceleration
Rebound Logic:
A rebound is detected when price:
Crosses back over a selected MA (fast or slow)
After being away for X candles (rebound_backstep)
Optional: filtered by histogram zones or candle color
Inputs:
Display Options:
Show/hide MA lines
Show/hide MA crosses
Show/hide price rebounds
Enable/disable blue deceleration zones
DAMA Settings:
Fast/Slow MA type and length
Source input (close by default)
Overbought/Oversold levels
Underbought/Undersold levels
Rebound Settings:
Use Close and/or Shadow
Rebound MA (Fast/Slow)
Candle color validation
Flat zone filter rebounds (between UnderSold and UnderBought)
Available MA type:
SMA (Simple MA)
EMA (Exponential MA)
DEMA (Double EMA)
TEMA (Triple EMA)
WMA (Weighted MA)
HMA (Hull MA)
VWMA (Volume Weighted MA)
Kijun (Ichimoku Baseline)
ALMA (Arnaud Legoux MA)
KAMA (Kaufman Adaptive MA)
HULLMOD (Modified Hull MA, Same as HMA, tweaked for Pine v6 constraints)
Notes:
**DEMA/TEMA** reduce lag compared to EMA, useful for faster reaction in trending markets.
**KAMA/ALMA** are better suited to noisy or volatile environments (e.g., BTC).
**VWMA** reacts strongly to volume spikes.
**HMA/HULLMOD** are great for visual clarity in fast moves.
Alerts Included (Fully Configurable):
Golden Cross:
Fast MA crosses above Slow MA
Death Cross:
Fast MA crosses below Slow MA
Bullish Rebound:
Rebound from below MA in uptrend
Bearish Rebound:
Rebound from above MA in downtrend
Bull Progression:
Transition into Green_Up with positive delta
Bear Progression:
Transition into Red_Down with negative delta
Bull Regression:
Exit from Red_Down into Blue/Green with negative delta
Bear Regression:
Exit from Green_Up into Blue/Red with positive delta
Crossover Overbought:
Histogram crosses above Overbought
Crossunder Overbought:
Histogram crosses below Overbought
Crossover Oversold:
Histogram crosses above Oversold
Crossunder Oversold:
Histogram crosses below Oversold
Crossover Underbought:
Histogram crosses above Underbought
Crossunder Underbought:
Histogram crosses below Underbought
Crossover Undersold:
Histogram crosses above Undersold
Crossunder Undersold:
Histogram crosses below Undersold
Credits:
Created by Eff_Hash. This code is shared with the TradingView community and full free. do not hesitate to share your best settings and usage.

Auto TrendLines [TradingFinder] Support Resistance Signal Alerts🔵 Introduction
The trendline is one of the most essential tools in technical analysis, widely used in financial markets such as Forex, cryptocurrency, and stocks. A trendline is a straight line that connects swing highs or swing lows and visually indicates the market’s trend direction.
Traders use trendlines to identify price structure, the strength of buyers and sellers, dynamic support and resistance zones, and optimal entry and exit points.
In technical analysis, trendlines are typically classified into three categories: uptrend lines (drawn by connecting higher lows), downtrend lines (formed by connecting lower highs), and sideways trends (moving horizontally). A valid trendline usually requires at least three confirmed touchpoints to be considered reliable for trading decisions.
Trendlines can serve as the foundation for a variety of trading strategies, such as the trendline bounce strategy, valid breakout setups, and confluence-based analysis with other tools like candlestick patterns, divergences, moving averages, and Fibonacci levels.
Additionally, trendlines are categorized into internal and external, and further into major and minor levels, each serving unique roles in market structure analysis.
🔵 How to Use
Trendlines are a key component in technical analysis, used to identify market direction, define dynamic support and resistance zones, highlight strategic entry and exit points, and manage risk. For a trendline to be reliable, it must be drawn based on structural principles—not by simply connecting two arbitrary points.
🟣 Selecting Pivot Types Based on Trend Direction
The first step is to determine the market trend: uptrend, downtrend, or sideways.
Then, choose pivot points that match the trend type :
In an uptrend, trendlines are drawn by connecting low pivots, especially higher lows.
In a downtrend, trendlines are formed by connecting high pivots, specifically lower highs.
It is crucial to connect pivots of the same type and structure to ensure the trendline is valid and analytically sound.
🟣 Pivot Classification
This indicator automatically classifies pivot points into two categories :
Major Pivots :
MLL : Major Lower Low
MHL : Major Higher Low
MHH : Major Higher High
MLH : Major Lower High
These define the primary structure of the market and are typically used in broader structural analysis.
Minor Pivots :
mLL: minor Lower Low
mHL: minor Higher Low
mHH: minor Higher High
mLH: minor Lower High
These are used for drawing more precise trendlines within corrective waves or internal price movements.
Example : In a downtrend, drawing a trendline from an MHH to an mHH creates structural inconsistency and introduces noise. Instead, connect points like MHL to MHL or mLH to mLH for a valid trendline.
🟣 Drawing High-Precision Trendlines
To ensure a reliable trendline :
Use pivots of the same classification (Major with Major or Minor with Minor).
Ensure at least three valid contact points (three touches = structural confirmation).
Draw through candles with the least deviation (choose wicks or bodies based on confluence).
Preferably draw from right to left for better alignment with current market behavior.
Use parallel lines to turn a single trendline into a trendline zone, if needed.
🟣 Using Trendlines for Trade Entries
Bounce Entry: When price approaches the trendline and shows signs of reversal (e.g., a reversal candle, divergence, or support/resistance), enter in the direction of the trend with a logical stop-loss.
Breakout Entry: When price breaks through the trendline with strong momentum and a confirmation (such as a retest or break of structure), consider trading in the direction of the breakout.
🟣 Trendline-Based Risk Management
For bounce entries, the stop-loss is placed below the trendline or the last pivot low (in an uptrend).
For breakout entries, the stop-loss is set behind the breakout candle or the last structural level.
A broken trendline can also act as an exit signal from a trade.
🟣 Combining Trendlines with Other Tools (Confluence)
Trendlines gain much more strength when used alongside other analytical tools :
Horizontal support and resistance levels
Moving averages (such as EMA 50 or EMA 200)
Fibonacci retracement zones
Candlestick patterns (e.g., Engulfing, Pin Bar)
RSI or MACD divergences
Market structure breaks (BoS / ChoCH)
🔵 Settings
Pivot Period : This defines how sensitive the pivot detection is. A higher number means the algorithm will identify more significant pivot points, resulting in longer-term trendlines.
Alerts
Alert :
Enable or disable the entire alert system
Set a custom alert name
Choose how often alerts trigger (every time, once per bar, or on bar close)
Select the time zone for alert timestamps (e.g., UTC)
Each trendline type supports two alert types :
Break Alert : Triggered when price breaks the trendline
React Alert : Triggered when price reacts or bounces off the trendline
These alerts can be independently enabled or disabled for all trendline categories (Major/Minor, Internal/External, Up/Down).
Display :
For each of the eight trendline types, you can control :
Whether to show or hide the line
Whether to delete the previous line when a new one is drawn
Color, line style (solid, dashed, dotted), extension direction (e.g., right only), and width
Major lines are typically thicker and more opaque, while minor lines appear thinner and more transparent.
All settings are designed to give the user full control over the appearance, behavior, and alert system of the indicator, without requiring manual drawing or adjustments.
🔵 Conclusion
A trendline is more than just a line on the chart—it is a structural, strategic, and flexible tool in technical analysis that can serve as the foundation for understanding price behavior and making trading decisions. Whether in trending markets or during corrections, trendlines help traders identify market direction, key zones, and high-potential entry and exit points with precision.
The accuracy and effectiveness of a trendline depend on using structurally valid pivot points and adhering to proper market logic, rather than relying on guesswork or personal bias.
This indicator is built to solve that exact problem. It automatically detects and draws multiple types of trendlines based on actual price structure, separating them into Major/Minor and Internal/External categories, and respecting professional analytical principles such as pivot type, trend direction, and structural location.

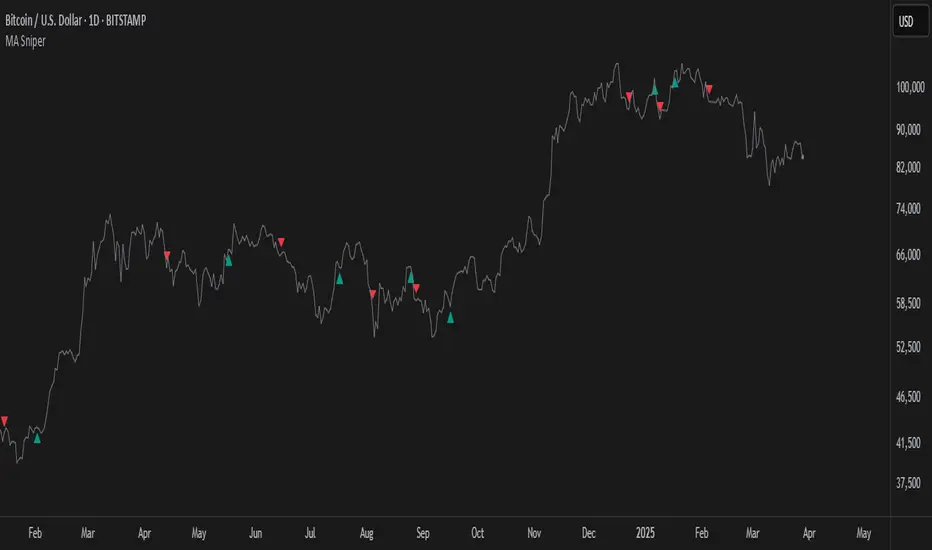
MA SniperThis indicator automatically finds the most effective moving average to use in a price crossover strategy—so you can focus on trading, not testing. It continuously evaluates a wide range of moving average periods, ranks them based on real-time market performance, and selects the one delivering the highest quality signals. The result? A smarter, adaptive tool that shows you exactly when price crosses its optimal moving average—bullish signals in green, bearish in red.
What makes it unique is the way it thinks.
Under the hood, the script doesn’t just pick a random MA or let you choose one manually. Instead, it backtests a large panel of moving average lengths for the current asset and timeframe. It evaluates each one by calculating its **Profit Factor**—a key performance metric used by pros to measure the quality of a strategy. Then, it assigns each MA a score and ranks them in a clean, built-in table so you can see, at a glance, which ones are currently most effective.
From that list, it picks the top-performing MA and uses it to generate live crossover signals on your chart. That MA is plotted automatically, and the signals adapt in real-time. This isn’t a static setup—it’s a dynamic system that evolves as the market evolves.
Even better: the indicator detects the type of instrument you’re trading (forex, stocks, etc.) and adjusts its internal calculations accordingly, including how many bars per day to consider. That means it remains highly accurate whether you’re trading EURUSD, SPX500, or TSLA.
You also get a real-time dashboard (via the table) that acts as a transparent scorecard. Want to see how other MAs are doing? You can. Want to understand why a certain MA was selected? The data is right there.
This tool is for traders who love crossover strategies but want something smarter, faster, and more precise—without spending hours manually testing. Whether you're scalping or swing trading, it offers a data-driven edge that’s hard to ignore.
Give it a try—you’ll quickly see how powerful it can be when your MA does the thinking for you.
This tool is for informational and educational purposes only. Trading involves risk, and past performance does not guarantee future results. Use responsibly.
Uptrick: Reversal Matrix +Overview
The Uptrick: Reversal Matrix + is designed as a comprehensive tool that organizes market information in a visually intuitive way. It presents a variety of signals and data points on the chart, aiming to provide clarity about potential reversals, directional momentum, and the broader context surrounding price behavior. By consolidating numerous indicators and statistics into a single interface, it serves as a versatile companion for different trading styles and time horizons.
Purpose
This indicator offers a multifunctional approach to market analysis. It seeks to help users gain a more holistic view of current conditions rather than focusing on isolated data points. Its primary goal is to guide traders toward recognizing evolving market structures, shifts in buying or selling pressure, and periods where price movement may exhibit stronger or weaker momentum. Because it is designed for adaptive use, it can cater to fast, intraday styles or more deliberate, long-term strategies, depending on how the user configures it.
Originality and Uniqueness
The Reversal Matrix + stands out by merging various categories of market data into cohesive visuals and tables. While many indicators offer singular signals or straightforward buy/sell prompts, this script integrates numerous underlying components and displays them in organized panels. Each piece of data, from volume characteristics to volatility states, is contextualized. This multi-layered approach helps traders see more than just a single dimension of the market. Whether one is exploring short-term breakouts, potential traps, or broader market regimes, the tool accommodates multiple perspectives within a single framework.
Inputs
1. Sensitivity.
This setting allows you to choose different levels based on how frequently you would like signals to appear. Selecting a higher sensitivity may capture faster changes but can produce a greater number of signals. More moderate or smoother settings can be preferable for users looking for less frequent but potentially clearer indications of shifts.
2. Trading Style.
This option adapts the tool to match conservative, normal, or more aggressive preferences. When choosing a conservative style, the script attempts to filter out smaller fluctuations, while the aggressive style might highlight more potential turning points as they emerge.
3. Potential Signal Threshold Difference
This setting adjusts the sensitivity of potential reversal signals. A lower value means the script will highlight only the most distinct setups, filtering out weaker or borderline scenarios. A higher value makes the tool more receptive to subtle shifts, potentially flagging more frequent signals. It allows users to fine-tune how responsive the script is to early momentum changes, depending on their preferred level of signal strictness.
4. Table Positions (Optional).
There are inputs that let you decide the on-chart position of the tables. You can enable or disable these tables and choose where they appear (for instance, top-right or bottom-left), depending on how you want the data displayed alongside price bars.
Table and Its Position
When enabled, a large table, known as the Full Metrics Table, offers extensive details about various technical and behavioral metrics. You can place it anywhere on your chart layout for convenience. It is designed to give you a granular view of current conditions without overwhelming the main price candles themselves.
Another, smaller panel known as the Final Verdict Table can also be displayed at a user-chosen position. This panel simplifies the script’s internal assessments into broader verdicts or summaries, allowing for a quick read on the market’s status.
Features
Multi-Faceted Signal and Alert System.
The indicator continuously scans market activity, highlighting events such as sudden rises or drops, changes in volatility, and shifts in momentum. Users can configure an array of alerts that instantly notify them of these occurrences, reducing the need to constantly monitor the chart.
Candle Overlays and Fading Effects .
In addition to standard chart candles, the script offers visual cues by shading or coloring candles differently when it detects certain signals. The fading mechanism gradually diminishes the bar color of older signals so that recent ones are more noticeable. This helps keep the focus on current opportunities while retaining a historical context.
Contextual Market Synopsis .
Each time a candle closes, the tool updates a variety of behind-the-scenes checks. This process helps the user see whether the market remains within the same general state (trending, ranging, or reversing) or is shifting rapidly. It also adds clarity when conditions may be transitioning between bullish and bearish inclinations.
Adaptable Settings for Different Styles .
Since traders differ in their tolerance for rapid fluctuations, the script’s adjustable Sensitivity and Trading Style inputs provide a way to fine-tune how it reacts. Someone trading on shorter timeframes can opt for more frequent signals that capture subtle changes, whereas a position trader might lean toward smoother outputs that highlight only stronger, more sustained conditions.
Extended Data Analysis .
Beyond immediate buy/sell possibilities, the Reversal Matrix+ delivers comprehensive data to help users confirm or question a market stance. A wide range of volume, volatility, and price action elements are factored in, giving each signal additional context rather than a simple green or red highlight.
Final Verdict Summaries .
When the second table is enabled, it condenses key aspects of the indicator’s internal logic into straightforward statements. Rather than navigating multiple data rows, you can check if the market appears more stable or volatile, potentially bullish or bearish, and whether a reversal probability is deemed high or low.
Large-Scale Alert Coverage .
More than fifty specialized alerts focus on distinct aspects, enabling users to track everything from volume anomalies to momentum acceleration.
Specialized Color Schemes .
To assist in quickly spotting bullish or bearish tendencies, candles and background components may be tinted in line with the latest recognized conditions. This visual reinforcement makes it easier to decide if ongoing signals confirm a previous stance or suggest a change.
Buy/Sell Signals
A core function of the script is to present buy and sell indications on the chart, identifying moments when price momentum may be shifting in a meaningful way. These signals come in two varieties: potential reversals and confirmed reversals. Potential reversals appear sooner, providing an early heads-up that market behavior could be turning. Confirmed reversals require a stronger confluence of underlying conditions, aiming to reduce the likelihood of false starts.
Internally, the script examines multiple facets—such as momentum flow, changes in volatility, and volume characteristics—to determine when a potential transition is noteworthy enough to highlight as a signal. As soon as those conditions line up, the script applies distinct markers or shapes to the candles, making it easy to spot these pivotal points on the chart. In addition, each new signal is emphasized through color-based candle shading, while older signals gradually fade to keep attention on the most relevant opportunities.
Although these signals can function as standalone cues, many traders pair them with the script’s other outputs—such as the Full Metrics Table, the Final Verdict Table, and specialized alerts—to form a more complete perspective. For instance, a potential buy signal spotted in real time may gain extra weight if certain metrics in the table reflect a constructive market backdrop. Meanwhile, the final verdict can offer a succinct confirmation or contradiction to what the buy or sell signal suggests. By combining these elements, traders can pursue strategies that balance both immediacy and context, tailoring their entries and exits to their own tolerance for risk and time horizon.
These features collectively allow users to explore the market from multiple angles. Whether one seeks a deeper technical dive or simpler guidance, the indicator’s layered design aims to cater to a broad spectrum of trading approaches.
Full Metrics Table
A key element of Uptrick: Reversal Matrix+ is the extensive set of data displayed within the Full Metrics Table. Below is an expanded explanation of the sixty-four core metrics. Each is accompanied by a brief statement about its practical significance.
Price
Displays current price.
Price Percent
Shows how much the price has shifted in percentage terms over a recent comparison point. Useful for gauging recent moves.
Vo Open
Presents price movement in relation to the candle’s open. Helps traders see if momentum favored bullish or bearish direction within the candle.
Range Percent
Depicts the span between high and low over the candle’s range, offering a measure of volatility within that candle.
Bodi Percent
Indicates how much of the candle is body as opposed to wick. Shows whether there was more decisive movement or more back-and-forth trading.
Volatility
Generically measures how dramatically price has been fluctuating over a given period. Helps users notice if the market is calm or very active.
Mpeed
Represents a sense of speed in price movement, potentially revealing if momentum is picking up or slowing down.
Accel
Points to how quickly price movement shifts from one level of speed to another. Can hint at a market that is accelerating or flattening out.
Volume
Reflects how many shares, contracts, or units are traded within the current bar. Higher volume may suggest stronger conviction.
Vol Percent
Shows how the volume compares, in percentage, to a previous period’s volume. Useful for spotting surges or drops in trading activity.
Mession Hi
Captures the highest point within a recent observed period or session. Often watched for potential breakout or reversal clues.
Mession Lo
Captures the lowest point within a recent observed period or session. Similarly, used to watch for support or breakdowns.
Pos Percent
Indicates how far the current price stands within its range. Being near the upper percentile suggests strength or an overbought scenario, depending on the viewpoint.
Mpread
Offers a sense of the overall spread in price action, which can reflect the determination of buyers or sellers within a candle.
Gap
Shows the difference in price from a prior close or from some previous reference point. Helps identify abrupt shifts in sentiment.
Conf. (Core)
Presents a general level of signal confidence based on internal checks. Assists in quickly scanning for whether a candle is aligned with broader market patterns.
Availability
Describes liquidity conditions, such as whether the market seems actively traded or comparatively thinner.
Conf. Bias
Highlights if price and momentum appear to confirm a prevailing direction, or if there is a noticeable lack of such alignment.
Valuation
Suggests how current price compares to an internal yardstick of fair or undervalued settings. Useful for spotting potential discount or premium zones.
Reversal
Warns about the possibility that price may turn from its recent direction. Intriguing for those who look for turning points at the end of trends.
Vol. Mtate
Indicates whether conditions are characterized by subdued or elevated swings. A higher reading may signal that caution is warranted.
Direction
Reflects a bullish or bearish inclination based on internal data. Provides a simplified way to see whether momentum is leaning up or down.
Vol. Clarity
Measures the clarity of volume movement, potentially detecting spikes or plateaus that can confirm or contradict price action.
Mtructure
Offers insight into how recent highs and lows are forming. A market that keeps printing higher highs and lows might suggest ongoing upward momentum.
Reaction
Shows how quickly the market responds to new information. Speedy changes may indicate more emotionally driven or news-influenced trading.
Trend Conf.
Suggests the tool’s assessment of how solid or fragile a given direction is. Useful for quickly seeing if a trend might persist.
Zone
Labels whether price is running near top or bottom levels of a selected range, helping identify if a market is pushing extremes.
Ehhaustion
Reveals if a move might be overextended and could retrace. Helpful in deciding whether to take profits or wait for a deeper confirmation.
Range Env
Describes whether the market is operating in a tight or wide range. Can help in choosing strategies like breakout or range-bound approaches.
Demand
Reports on whether buying demand or selling supply is more dominant in the current period. Assists in gauging short-term pressure.
Conf. Level
Provides an additional notion of how firm a signal might be. It may be labeled as early or fully formed, helping with timing considerations.
Momentum
Conveys whether price is accelerating upward, decelerating, or shifting into a more neutral gear.
Higher Close Percent
Indicates the frequency of consecutive higher closes over recent bars. Demonstrates if a market is consistently pushing upward.
Bear Trap
Points to scenarios where sellers could be caught off guard if the market reverses after a seemingly bearish move.
Bull Trap
Opposite of the above, hinting that buyers may be misled if price fails to hold after a seemingly bullish shift.
Vol Mqueeze
Identifies periods where volume and volatility might be compressing. Often used by traders to anticipate a potential abrupt expansion in movement.
Divergence
Suggests a mismatch between price and internal momentum signals. May foretell a hidden reversal or shift in direction.
Hist. Vol
Provides a longer-term viewpoint of how volatility stands in the broader scope, enabling comparison between current choppiness and previous norms.
Velocity
Tracks the overall vigor of price movement. A high velocity can mean powerful directional drive.
Wick Ratio
Analyzes the presence of upper or lower wicks and can suggest whether buying or selling tails are dominant within each bar.
Decision Bias
Indicates how the script perceives near-term market consensus. A strong bias may reveal one side’s momentum more clearly.
Break Chance
Hints at whether a local high or low has a fair possibility of being broken, which can be relevant to breakout-style trading.
Trend Mlope
Observes the slope of the ongoing trend, showing whether price is inclining, declining, or moving sideways over a specified window.
Trend Dir
Concisely states if that slope leans upward or downward. Useful for determining basic directional posture at a glance.
Regime
Groups the market environment into stable bullish, stable bearish, or a more unsettled pattern, helping shape strategic decisions.
Price Comparison
Shows whether price is trading above or below certain historical or moving references. Provides a broad sense of market posture.
Vol Mhift
Highlights any general upswing or downswing in traded volume, indicating whether participants are stepping in or scaling back.
Mtructural Balance
Offers an overview of whether the chart bars show more wick dominance or more body dominance. Helps in reading subtle shifts in power.
Flow Mtability
Portrays how orderly or choppy the price movement is. Less stable flow can lead to more frequent reversals or whipsaws.
Liquidity Pull
Shows the extent to which trading activity may be magnetizing price, helping gauge if there is substantial interest at certain zones.
Bar Mhape
Describes the candle’s shape, such as longer upper or lower tails, which can point to rejections or confirmations of direction.
Bui/Mell Rating
Reveals which side holds greater influence at a glance. Might display more leaning to buy strength or to sell pressure.
Range Vol Flow
Monitors the interplay between how wide the range is and how volume is behaving. If both are expanding, more powerful swings may follow.
Hiper Move
Spots especially strong or sudden moves. Could be a swift jump up or down, prompting attention to volatility management.
Candle Force
Indicates how forceful a candle’s close is compared to its full range. Strong force bars often underscore decisive momentum.
Hi/Lo Tag
Alerts you to newly formed session extremes, helping confirm if recent highs or lows are significant.
Price Action
Labels the candle as leaning bullish, leaning bearish, or neutral, providing a concise understanding of the immediate tone.
Vol Abnorm
Distinguishes between typical volume and unusually high volume that might signal institutional trading or news releases.
Trend Match
Checks if short-term direction is aligned with a broader trend. Clear alignment can strengthen confidence in that direction.
Move Confirm
Conveys whether the tool sees a price movement as already established or still in a formative state.
Momentum Focus
Gives a quick snapshot of whether price momentum is generally tilting higher, lower, or holding steady.
Vol Total
Presents a broad average or accumulated sense of volume over a longer window, providing context for current activity.
Hist. Accum
Positions price within a more extended historical range, allowing one to see if the asset is near major peaks or troughs.
Trap Bias
Informs if the market may be showing conditions that lead to bull traps or bear traps, cautioning traders who chase rapid moves.
Final Verdict Table
The secondary table, known as the Final Verdict Table, condenses the tool’s main findings into concise statements. It watches for patterns such as alignment of trends, clarity of momentum, perceived volatility conditions, and possible reversals. Depending on what the script observes, the table might suggest a bullish confluence, a bearish confluence, an unstable market environment, or a more neutral outlook. This feature is particularly helpful for traders who prefer quick insights over a detailed breakdown of every metric.
Metrics Included in the Final Verdict Table
Directional Momentum Flow
This entry shows how the indicator interprets short-term momentum for the current market. If momentum appears to be gaining strength in one direction, it may indicate that buyers or sellers have a slight edge, whereas a flat reading might suggest indecision.
Volatility Regime Assessment
This metric provides insight into whether the market is relatively calm, moderate, or experiencing elevated volatility. A calmer volatility state might favor steadier strategies, while higher volatility could signal the potential for wider price swings.
Trend Continuity Confidence
This section reflects how confident the tool is in the market’s current trend. It helps traders see whether recent action supports a persistent uptrend, downtrend, or if there is ambiguity that undermines the idea of a consistent directional movement.
Reversal Probability Index
Here, the table evaluates whether conditions are conducive to a market turnaround. If the script observes signs of exhaustion or conflict in momentum, it may suggest an increased possibility of the price switching direction.
Manipulation Detector
This component looks for signals that the market may be attempting to trap buyers or sellers. For instance, a sudden shift might hint at a bull or bear trap scenario. This readout serves to caution against seemingly obvious moves that could quickly reverse.
Final Verdict
Below these metrics, the table presents a single overall statement that integrates the above factors. This final verdict can range from identifying a bullish or bearish confluence to calling the market unstable or neutral if conditions are inconclusive. It is intended to be a quick, high-level summary of the script’s general stance on the market.
Any Other Features
Users can access more than fifty specialized alerts that target different market conditions, from potential trap scenarios to shifts in volatility regimes. These alerts can be integrated into various platforms, ensuring that traders receive immediate notifications when critical triggers occur. The color-coded candle approach, combined with fading effects, helps maintain chart readability. Over time, this setup encourages a balance between a detailed backdrop of market data and a clear depiction of fresh signals.
Why More than One Indicator
Integrating multiple components under one roof offers several advantages. It reduces the chance of relying on a single dimension, such as price action alone, which can sometimes mislead or generate frequent false signals. By combining various measures of volatility, volume, and price structure, the script can reveal confluences or disagreements among different elements. This multi-faceted approach can improve clarity, making it easier to decide when conditions line up favorably or when they conflict, thereby prompting caution.
Conclusion
In summary, the Uptrick: Reversal Matrix + aims to deliver a sweeping overview of market dynamics. It guides users from raw observations—like price and volume—to broader insights concerning trend stability, potential reversals, and overall liquidity. Its dual-table system allows for both fine-grained analysis and fast verdicts, catering to traders with varying degrees of time and attention. The numerous alerts and color coding schemes further round out its capacity for real-time monitoring and visually clear signal presentation.
Disclaimer
Trading involves inherent risks, and no tool can entirely eliminate uncertainty. This indicator’s materials are provided for informational purposes, without guarantees regarding future performance. Traders should exercise due diligence, apply sound risk management, and consider professional advice. The Uptrick: Reversal Matrix+ does not assume responsibility for financial decisions made based on its output.

HEMA Trend Levels [AlgoAlpha]OVERVIEW
This script plots two Hull-EMA (HEMA) curves to define a color-coded dynamic trend zone and generate context-aware breakout levels, allowing traders to easily visualize prevailing momentum and identify high-probability breakout retests. The script blends smoothed price tracking with conditional box plotting, delivering both trend-following and mean-reversion signals within one system. It is designed to be simple to read visually while offering nuanced trend shifts and test confirmations.
█ CONCEPTS
The Hull-EMA (HEMA) is a hybrid moving average combining the responsiveness of short EMAs with the smoothness of longer ones. It applies layered smoothing: first by subtracting a full EMA from a half-length EMA (doubling the short EMA's weight), and then by smoothing the result again with the square root of the original length. This process reduces lag while maintaining clarity in direction changes. In this script, two HEMAs—fast and slow—are used to define the trend structure and trigger events when they cross. These crossovers generate "trend shift boxes"—temporary support or resistance zones drawn immediately after trend transitions—to detect price retests in the new direction. When price cleanly retests these levels, the script marks them as confirmations with triangle symbols, helping traders isolate better continuation setups. Color-coded bars further enhance visual interpretation: bullish bars when price is above both HEMAs, bearish when below, and neutral (gray) when indecisive.
█ FEATURES
Bullish and bearish bar coloring based on price and HEMA alignment.
Box plotting at each crossover (bullish or bearish) to create short-term decision zones.
Real-time test detection: price must cleanly test and bounce from box levels to be considered valid.
Multiple alert conditions: crossover alerts, test alerts, and trend continuation alerts.
█ USAGE
Use this indicator on any time frame and asset. Adjust HEMA lengths to match your trading style—shorter lengths for scalping or intraday, longer for swing trading. The shaded area between HEMAs helps visually define the current trend. Watch for crossovers: a bullish crossover plots a green support box just below price, and a bearish one plots a red resistance box just above. These zones act as short-term decision points. When price returns to test a box and confirms with strong rejection (e.g., closes above for bullish or below for bearish), a triangle symbol is plotted. These tests can signal strong trend continuation. For traders looking for clean entries, combining the crossover with a successful retest improves reliability. Alerts can be enabled for all key signals: trend shift, test confirmations, and continuation conditions, making it suitable for automated setups or discretionary traders tracking multiple charts.

Reversal Precision Index Overview
The Reversal Precision Index (RPI) is designed to assist traders in identifying potential reversal zones and tracking market trends. This overlay indicator combines a set of dynamic price channels with a customizable trend-following band, offering a robust framework for spotting key turning points and monitoring price action. Ideal for traders seeking to enhance their decision-making process, RPI is versatile across various timeframes and asset types.
Key Features
Dynamic Price Channels: Visualizes multiple support and resistance levels based on a weighted average of price data, helping you identify areas where price reversals are likely to occur.
Trend-Following Band: Includes an adjustable band that follows price trends, providing insights into the overall market direction and potential breakout zones.
Customizable Alerts: Notifies you when price crosses key levels, allowing you to react promptly to significant market movements.
Price Labels: Displays current levels of the price channels on the chart, aiding in quick reference and analysis (optional).
Interpreting the Indicator
Reversal Zones: Look for price reactions near the channel levels, which often act as high-probability reversal points. These zones can signal potential entry or exit opportunities.
Trend Direction: The trend band provides a smoothed view of market direction. Use its position relative to price to gauge bullish or bearish momentum.

Lowess Channel + (RSI) [ChartPrime]The Lowess Channel + (RSI) indicator applies the LOWESS (Locally Weighted Scatterplot Smoothing) algorithm to filter price fluctuations and construct a dynamic channel. LOWESS is a non-parametric regression method that smooths noisy data by fitting weighted linear regressions at localized segments. This technique is widely used in statistical analysis to reveal trends while preserving data structure.
In this indicator, the LOWESS algorithm is used to create a central trend line and deviation-based bands. The midline changes color based on trend direction, and diamonds are plotted when a trend shift occurs. Additionally, an RSI gauge is positioned at the end of the channel to display the current RSI level in relation to the price bands.
lowess_smooth(src, length, bandwidth) =>
sum_weights = 0.0
sum_weighted_y = 0.0
sum_weighted_xy = 0.0
sum_weighted_x2 = 0.0
sum_weighted_x = 0.0
for i = 0 to length - 1
x = float(i)
weight = math.exp(-0.5 * (x / bandwidth) * (x / bandwidth))
y = nz(src , 0)
sum_weights := sum_weights + weight
sum_weighted_x := sum_weighted_x + weight * x
sum_weighted_y := sum_weighted_y + weight * y
sum_weighted_xy := sum_weighted_xy + weight * x * y
sum_weighted_x2 := sum_weighted_x2 + weight * x * x
mean_x = sum_weighted_x / sum_weights
mean_y = sum_weighted_y / sum_weights
beta = (sum_weighted_xy - mean_x * mean_y * sum_weights) / (sum_weighted_x2 - mean_x * mean_x * sum_weights)
alpha = mean_y - beta * mean_x
alpha + beta * float(length / 2) // Centered smoothing
⯁ KEY FEATURES
LOWESS Price Filtering – Smooths price fluctuations to reveal the underlying trend with minimal lag.
Dynamic Trend Coloring – The midline changes color based on trend direction (e.g., bullish or bearish).
Trend Shift Diamonds – Marks points where the midline color changes, indicating a possible trend shift.
Deviation-Based Bands – Expands above and below the midline using ATR-based multipliers for volatility tracking.
RSI Gauge Display – A vertical gauge at the right side of the chart shows the current RSI level relative to the price channel.
Fully Customizable – Users can adjust LOWESS length, band width, colors, and enable or disable the RSI gauge and adjust RSIlength.
⯁ HOW TO USE
Use the LOWESS midline as a trend filter —bullish when green, bearish when purple.
Watch for trend shift diamonds as potential entry or exit signals.
Utilize the price bands to gauge overbought and oversold zones based on volatility.
Monitor the RSI gauge to confirm trend strength—high RSI near upper bands suggests overbought conditions, while low RSI near lower bands indicates oversold conditions.
⯁ CONCLUSION
The Lowess Channel + (RSI) indicator offers a powerful way to analyze market trends by applying a statistically robust smoothing algorithm. Unlike traditional moving averages, LOWESS filtering provides a flexible, responsive trendline that adapts to price movements. The integrated RSI gauge enhances decision-making by displaying momentum conditions alongside trend dynamics. Whether used for trend-following or mean reversion strategies, this indicator provides traders with a well-rounded perspective on market behavior.

Williams Fractals Ultimate (Donchian Adjusted)Williams Fractals Ultimate (Donchian Adjusted)
Understanding Williams Fractals
Williams Fractals are a simple yet powerful tool used to identify potential turning points in the market. They highlight local highs (up fractals) and local lows (down fractals) based on a set period.
An up fractal appears when a price peak is higher than the surrounding prices.
A down fractal appears when a price low is lower than the surrounding prices.
Fractals help traders spot support and resistance levels, potential trend reversals, and price breakout zones.
Why Adjust Fractals with the Donchian Channel?
The standard Williams Fractals method identifies local highs and lows without considering broader market context. This script enhances fractal accuracy by integrating the Donchian Channel, which tracks the highest highs and lowest lows over a set period.
- The Donchian Baseline is calculated as the average of the highest high and lowest low over a selected period.
- Fractals are filtered based on this baseline:
Up Fractals are only shown if they are above the Donchian baseline.
Down Fractals are only shown if they are below the Donchian baseline.
This filtering method removes weak signals and ensures that only relevant fractals aligned with market structure are displayed.
Key Features of the Script
Customizable Fractal & Donchian Periods – Allows traders to fine-tune fractal sensitivity.
Donchian-Based Filtering – Reduces noise and highlights meaningful fractals.
Fractal ZigZag Line (Optional) – Helps visualize price swings more clearly.
Why Is This So Effective?
Stronger trend signals – Filtering with the Donchian baseline eliminates unreliable fractals.
Clearer price action – The optional ZigZag line visually connects significant highs and lows.
Easy trend identification – Helps traders confirm breakout zones and key price levels.
This script is a technical analysis tool and does not guarantee profitable trades. Always combine it with other indicators and risk management strategies before making trading decisions.
