RSI Momentum Acceleration by TartigradiaPlots the momentum acceleration oscillators from price and RSI, rescaled and with areas above/below highlighted.
Usage: in a nutshell, when the background is yellow, it's bearish (RSI decelerates faster than price), whereas when the background is green, it's bullish (RSI accelerates faster than price). It appears to detect early some reversals that are otherwise difficult to detect.
Note: it supports using any other indicator's output as the second source input, instead of RSI. PineScript does not allow for more than one source to receive input from other indicators, all the others must only use price as an input.
This indicator uses the core routine to calculate Momentum Acceleration Oscillators by DGT:
This indicator is based on the idea of stinkbug : "RSI is a good momentum indicator showing how excited ppl are on a move, this is why divergences on it work so well. I would like to see the change accelerating or slowing on a move up or down.."
Reversalpattern

PivotThis library was designed to create three different datasets using Bill Williams fractals. The goal is to spot trends in reversal data and ultimately use these datasets to help predict future price reversals.
First, the pivot() function is used to initialize and populate three separate arrays (high pivot , low pivot , all pivots ). Since each high/low price depends on the bar_index, the bar_index, pivot direction(high/low), and high/low values are compressed into a string to maintain the data's integrity ("__"). Once each string array is populated and organized by bar_index, all three are returned inside a tuple. The return value must be deconstructed H,L,A =pivot() for each array's values to be accessed using getPivot() . This boilerplate allows for data to be accessed more efficiently in a recursive environment. getPivot() was designed to be used inside of a for or while block to populate matrices for further analyses. Again, getPivot() return values must be exposed through deconstruction. x,d,y =getPivot(). See code for more details.
pivot(int XLR) initializes and populates arrays
Parameters
XLR - number of bars to the left and right that must be lower for a high to be considered a pivotHigh, or vice versa. This number will drastically change the size and scope of the returned datasets. smaller values will produce much larger datasets, which might model short term price activity well. In contrast, larger values will produce smaller datasets which might model longer term price activity well.
Returns - tuple [string ]
getPivot(string arrayID, int index) accesses array data
Parameters
arrayID - the variable name for one of the three arrays returned by pivot().
index - the index of the provided array, with 0 being the most recent pivot point. can be set to " i " in a loop to access values recursively
Returns - tuple

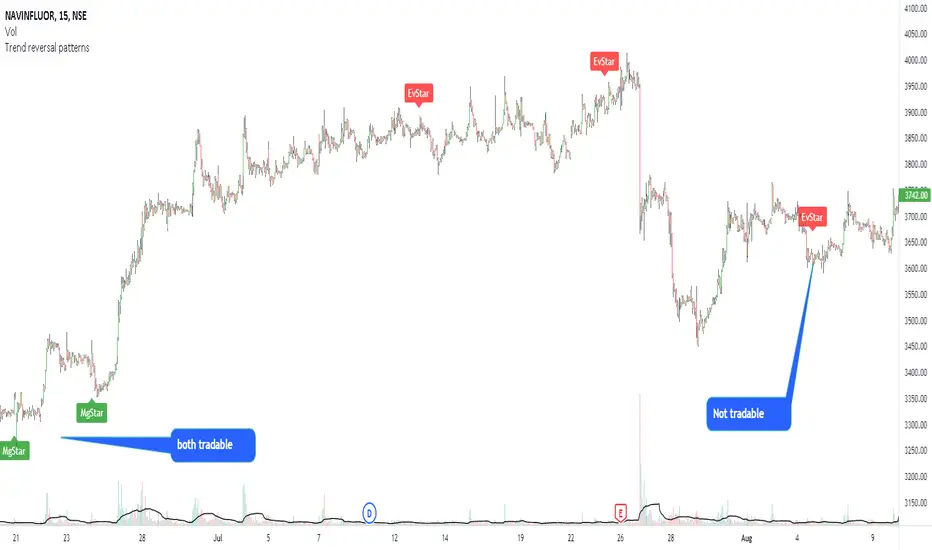
Modified morning and evening starsThis script highlights modified version of evening and morning star candlestick patterns. Volume has also been added in the script to create convergence of volume with price action.
It is recommended to use these patterns for positional trading. It is advised to use
Morning star at the bottom of the downtrend
Evening star at the top of the uptrend
Avoid entries against above recommendations
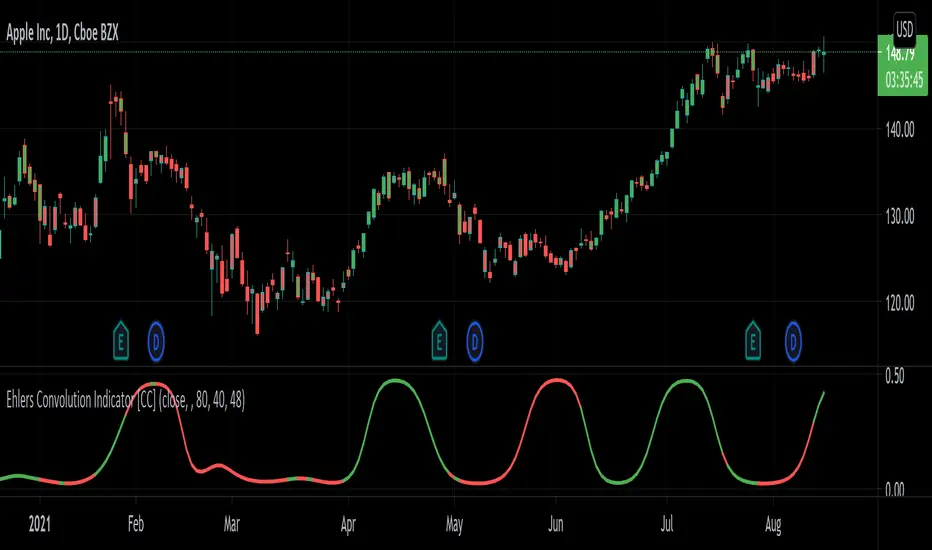
Ehlers Convolution Indicator [CC]The Convolution Indicator was created by John Ehlers (Cycle Analytics For Traders pgs 170-174) and this is version of an indicator to find potential reversal points. The idea behind this indicator is to use a variation of his AutoCorrelation Indicator that transforms the data using digital signal processing and as you can see it looks very similar to his BandPass Filter . The idea is that when this indicator peaks then it has reached a potential reversal point and so the stock may continue in the current direction but most of the time this indicator correctly points out the reversal points. I have included normal buy and sell signals but generally speaking you would want to buy when the indicator is around 0.05 to 0.10 and moving up and sell when it reaches its peak and is starting to move down.
Let me know if you have any other scripts you would like to see me publish!
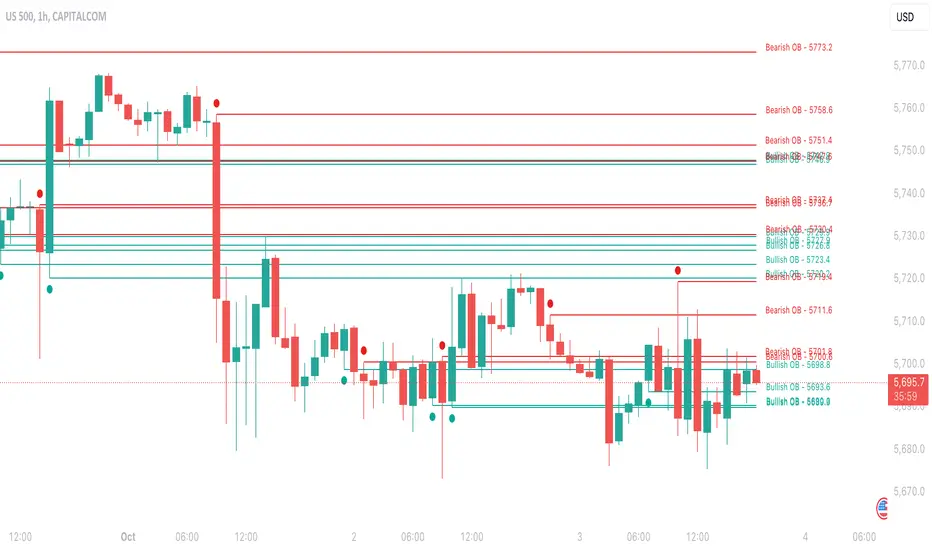
Institutional OrderBlock Pressure█ OVERVIEW
OrderBlocks are areas where Banks take a Short or Long position. So they create a movement that they would like to hide from us, but luckily for us they cannot. Take the example of Banks opening Short position for x reason. The Trend is already Bearish. The Price will fall and then make a Reversal
(most often to the price where they opened their positions) and it is at this precise moment that they will again resume a Short position twice as
large because for the moment, following this example it is not in their interest that the Price exceeds a certain Price since they are Seller.
As a result they create a solid Resistance (the strongest it is). There are several ways to interpret this logic, we can try to follow the movement of Banks
or on the contrary take advantage of the recovery of the course. Note that not having level 2 and access to the order book from TradingView we can only
make a rough estimate of the "OrderBlocks" through VPOC.
█ HOW TO INTERPRET?
• The Labels displayed by "Red Arrow" and "Green Arrow" represent supposed Bearish or Bullish OrderBlock. Note that you should not in any way interpret these "Arrows" as Signals to Buy or Sell for the reasons mentioned above.
• The OB Line works according to detected OrderBlock Candle. These lines indicate the potential recovery area. (The highlighted lines and candles are white by default).
• It is better to use this indicator on Higher TimeFrame like 2H or 4H.
• You can change the Volume Ratio (here VPOC) which is 89 by default.
• There is a Customization section that allows you to change the colors of the Lines and Candles from White to Black depending on your background color (Light or Dark).
• YES the indicator is Repainting and YES you can have False Alerts since Labels appear in intra-bar!
█ ALERTS
• In fact we don't really need Alerts for the logic of this indicator except maybe to get the Price of the last OB Detected and to keep this price in your Alert History and may use it later. Some improvements will come in future with updates and we have already planned to add Alerts when a "Line Cross" gone occur.
If you notice any bugs or if you have any suggestions, don't be hateful gangs ;)
Happy trading everyone and remember, risk management is the most important!
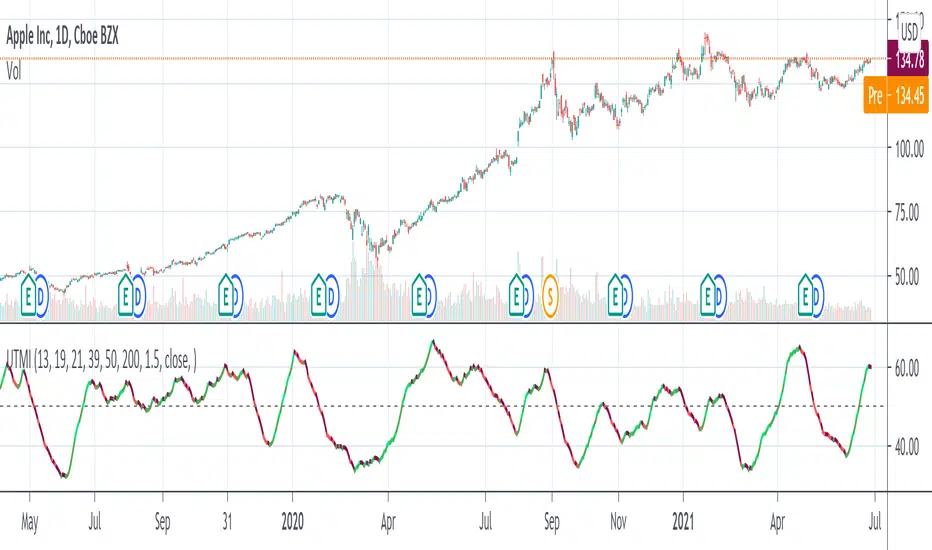
Ultimate Momentum Indicator [CC]This is a custom indicator of mine loosely based on the work by Steve J Godwin & Louisa C Schneider (Stocks and Commodities Feb 2021 pg 22) and this works pretty well at anticipating future price swings as the momentum falls. The idea I was going for was to introduce the idea of reversals in combination with a momentum indicator so you can better identify peaks and valleys. I have included strong buy and signals in addition to normal ones so darker colors are the strong buy and sell signals and lighter colors are the normal ones. I would recommend to buy when the line turns green and sell when it turns red.
Let me know if there are any other indicators you would like me to publish!
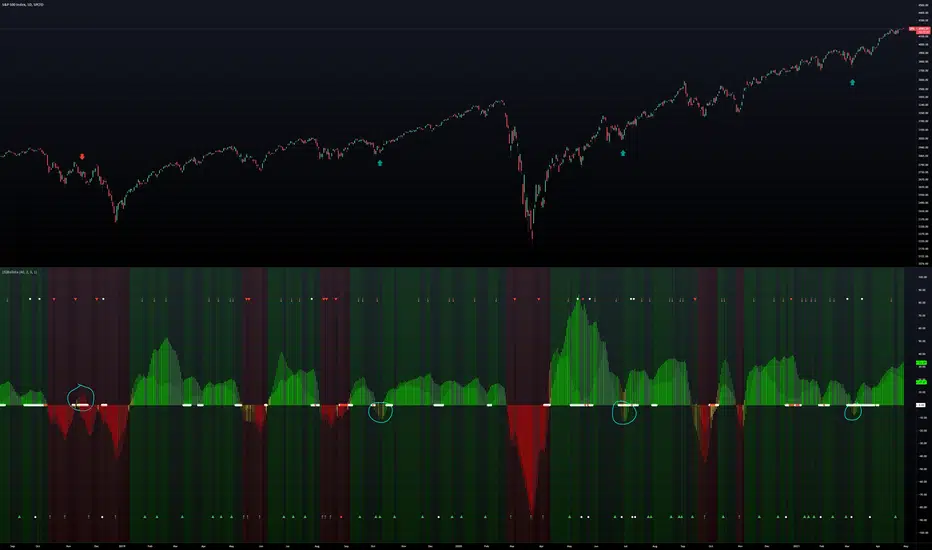
(JS) BallistaAlright so this is a script I made by combining two existing ones and making a really cool discovery that has proven very useful.
You'll notice that there are two separate oscillators that are laid on top of each other. The background oscillator is my "Tip-and-Dip" oscillator which you can see here (will refer to this as TnD from here), and the foreground oscillator from the Squeeze , which can be viewed here .
Initially I just wanted to see how they interacted with one another and compare them, but this led to some pretty interesting observations.
First let me go through the options real quick to get that out of the way, though it is mostly self-explanatory.
Lookback Period defines the amount of bars used for the TnD oscillator.
Smoothing Value smooths out the TnD output.
Standard Deviations is used to calculate the TnD formula.
Color Scheme is preset BG colors.
Using Dark Mode changes colors based on dark mode or not.
Squeeze Momentum On turns the Squeeze in the foreground off and on.
Arrows Off turns the arrows on the indicator off and on.
Now to explain the indicator a bit more. I have the default lookback period as 40 due to the Squeeze being 20, which makes the TnD oscillator the "slow" output with the Squeeze being the "fast" output.
Some initial observations were that when both the Squeeze and the TnD are moving in the direction, when the Squeeze is higher (uptrend) or lower (downtrend) it seems to indicate strength in the move. As the move loses steam you'll notice the Squeeze diverge from the TnD.
However, the most useful thing I discovered about the interaction between these two indicators is where the name for it came from. So if you aren't familiar with what a Ballista is, per Wikipedia, "The ballista... sometimes called bolt thrower, was an ancient missile weapon that launched either bolts or stones at a distant target." There are instances where the Squeeze seems to get ahead of itself and gets too far away from the TnD (which is the long term trend between the two). The key thing to look for is an "inverted squeeze" - this is when the squeeze oscillator ends up flipping against the TnD. When this occurs there is an extremely high probability that you'll see price shoot back the opposite way of the Squeeze.
I've been using this setup myself for about a year now and have been very satisfied with the results thusfar. I circled some examples on the SPX daily chart here to show you what I mean with the inverted Squeeze shooting back.
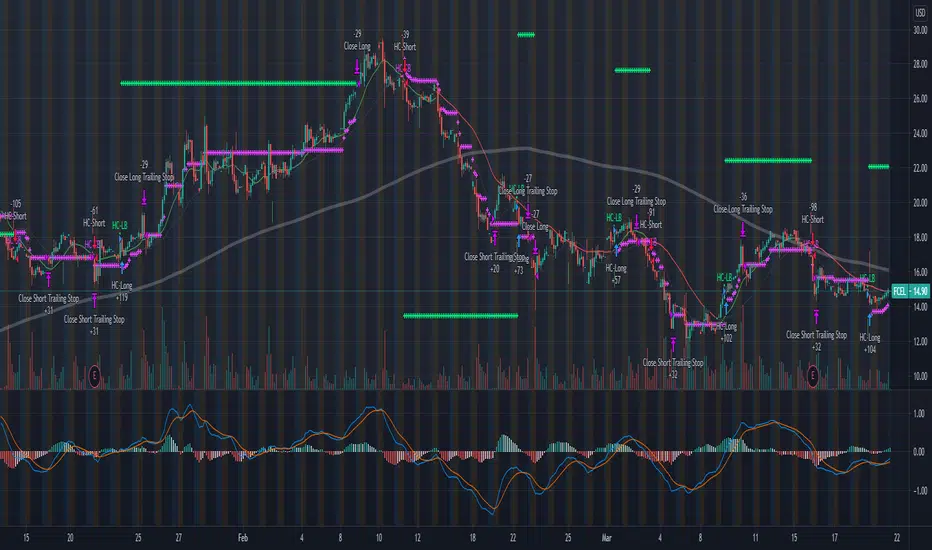
KISS Strategy: SMA + EMA//Hello my fellow investors
//I am creating a simple non-cluttered strategy that uses 3(+1) simple means to determine: viability, entry, and exit
//1) Has a consistent trend been maintained for several days/weeks
//2) SH SMA crossover LG SMA = Bullish entry/LG SMA crossover SH SMA = Bearish entry
//3) Use the Slope factor & Weeks in Trend (WiT) to dertermine how strong of an entry signal you are comfortable with
//4) Exit position based on next SMA cross and trend reversal or stop loss%
//3+1) For added confidence in trend detection: Apply MACD check - buy--> MACD line above signal line and corssover below histogram \\ sell --> MACD line below signal line and crossover above histogram.
//*)This code also allows you to determine your desired backtesting date compliments of alanaster
The chart shown has:
Starting Capital: $10,000
Investment percent per trade: 1.5%
Stop Loss: 20%
Take Profit: 100%
RSI_OverValue with Engulfing candleThis script detects potential trend reverse and Buy or Sell spots.
It works with finding overvalued RSI and Engulfing candle after that and plotting "Buy" or "Sell" signal on price chart.
* Users can change RSI values easily from setting.
Enjoy

Volume Divergence by MMIt's a simply volume indicator. You should watch for breaks on both volume uptrend and volume downtrend. It uses fibonacci numbers to build smoothed moving average of volume.
Also you can check divergences for trend reversal and momentum loss.

HTF Candlestick Patterns [TradingView] vX by DGTCandlesticks are graphical representations of price movements for a given period of time. They are commonly formed by the opening, high, low, and closing prices of a financial instrument. They have their origins in the centuries-old Japanese rice trade and have made their way into modern day price charting.
It’s important to note that candlestick patterns aren’t necessarily a buy or sell signal by themselves. They are instead a way to look at market structure and a potential indication of an upcoming opportunity. It is always useful to look at candlestick patterns in context like any other market analysis tool and candlestick patterns are most useful when used in combination with other techniques. There are countless candlestick patterns that traders can use to identify areas of interest on a chart, where some candlestick patterns may provide insights into the balance between buyers and sellers, others may indicate a reversal, continuation, or indecision.
Reversal patterns are quite useful when used in context. Reversal patterns should form at the bottom of a downtrend or at the top of an uptrend. Otherwise, they are not a reversal patterns, but continuation patterns. Most reversal patterns require confirmation such as price move in the direction of reversal accompanied by appropriate trading volume. The reversal patterns can further be confirmed through other means of traditional technical analysis—like trend lines, momentum, oscillators, or volume indicators—to reaffirm buying or selling pressure. The patterns themselves do not guarantee that the trend will reverse. Investors should always confirm reversal by the subsequent price action before initiating a trade.
This study implements some of the most commonly used candlestick patterns in a context with directional movement indicator. On request users can adjust the strong trend threshold from dialog box, eighter can disabled correlation with directional movement indicator. To add additional sight to analysis the simple moving averages of 20, 50, 100 and 200 periods are added (configurable)
You may add additional indicators of your choice. Colored DMI, BB Cloud or Price Distance to its MAs may help
Enjoy it!
Disclaimer: The script is for informational and educational purposes only. Use of the script does not constitutes professional and/or financial advice. You alone the sole responsibility of evaluating the script output and risks associated with the use of the script. In exchange for using the script, you agree not to hold dgtrd tradingview user liable for any possible claim for damages arising from any decision you make based on use of the script

Depth Multiple Time FrameThe price always returns to the average !!!
An important separation of the price with respect to an average, indicates a depth and generally generates a reversion or correction in the trend. Depth detection is a simple and very powerful technique, it is widely used for scalping and pyramid operations, this indicator detects depth in 7 time frames, everything is configurable independently, simultaneous detection of depth in several time frames increases The chances of success in the operation. I personally like pyramidization and it is one of the tools I use to detect depth to average the price of my operations.
thumbs up!!

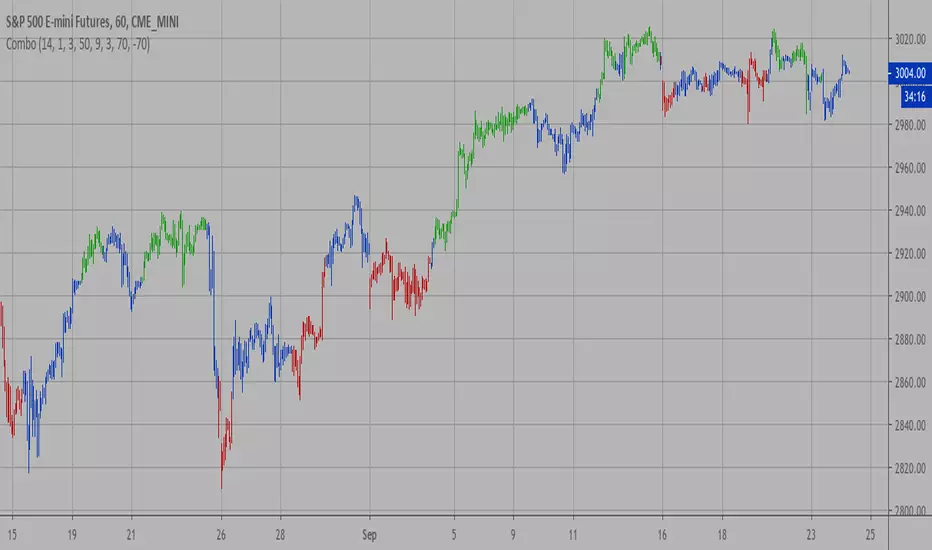
Combo Strategy 123 Reversal & CMOfilt This is combo strategies for get a cumulative signal.
First strategy
This System was created from the Book "How I Tripled My Money In The
Futures Market" by Ulf Jensen, Page 183. This is reverse type of strategies.
The strategy buys at market, if close price is higher than the previous close
during 2 days and the meaning of 9-days Stochastic Slow Oscillator is lower than 50.
The strategy sells at market, if close price is lower than the previous close price
during 2 days and the meaning of 9-days Stochastic Fast Oscillator is higher than 50.
Second strategy
This indicator plots a CMO which ignores price changes which are less
than a threshold value. CMO was developed by Tushar Chande. A scientist,
an inventor, and a respected trading system developer, Mr. Chande developed
the CMO to capture what he calls "pure momentum". For more definitive
information on the CMO and other indicators we recommend the book The New
Technical Trader by Tushar Chande and Stanley Kroll.
The CMO is closely related to, yet unique from, other momentum oriented
indicators such as Relative Strength Index, Stochastic, Rate-of-Change, etc.
It is most closely related to Welles Wilder`s RSI, yet it differs in several ways:
- It uses data for both up days and down days in the numerator, thereby directly
measuring momentum;
- The calculations are applied on unsmoothed data. Therefore, short-term extreme
movements in price are not hidden. Once calculated, smoothing can be applied to the
CMO, if desired;
- The scale is bounded between +100 and -100, thereby allowing you to clearly see
changes in net momentum using the 0 level. The bounded scale also allows you to
conveniently compare values across different securities.
WARNING:
- For purpose educate only
- This script to change bars colors.

Rounded Bottom Breakout Strategy Moving Averages20-day SMA , 34-day EMA , 50-day SMA and 200-day SMA moving average indicator based on Rick Saddler's Rounded Bottom Reversal Breakout Strategy

Combo Backtest 123 Reversal & Bandpass FilterThis is combo strategies for get
a cumulative signal. Result signal will return 1 if two strategies
is long, -1 if all strategies is short and 0 if signals of strategies is not equal.
First strategy
This System was created from the Book "How I Tripled My Money In The
Futures Market" by Ulf Jensen, Page 183. This is reverse type of strategies.
The strategy buys at market, if close price is higher than the previous close
during 2 days and the meaning of 9-days Stochastic Slow Oscillator is lower than 50.
The strategy sells at market, if close price is lower than the previous close price
during 2 days and the meaning of 9-days Stochastic Fast Oscillator is higher than 50.
Second strategy
The related article is copyrighted material from
Stocks & Commodities Mar 2010
You can use in the xPrice any series: Open, High, Low, Close, HL2, HLC3, OHLC4 and ect...
WARNING:
- For purpose educate only
- This script to change bars colors.

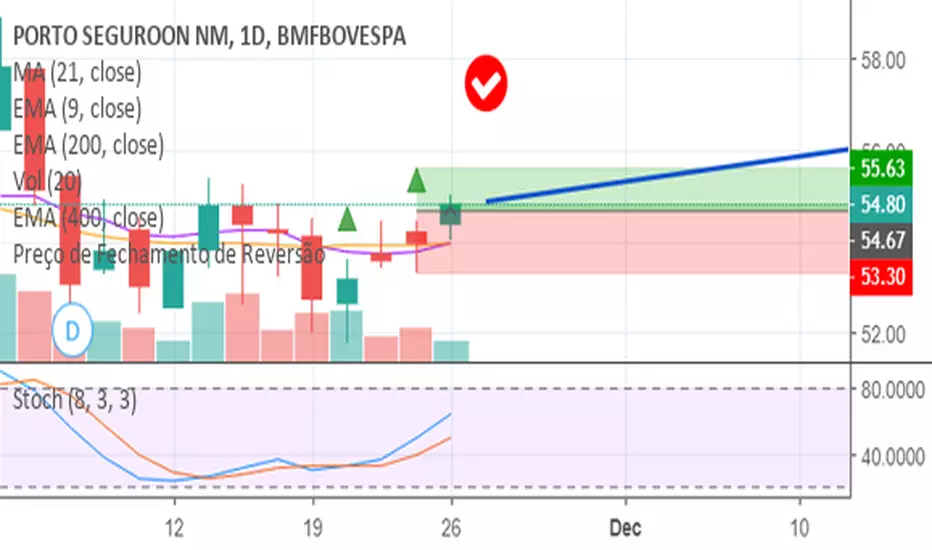
Indicator "Preço de Fechamento de Reversão"
IMPORTANT: Filter entries with Stochastic. Oversold for long and Overbought for short
Marks candles following setup created by Analyst "Stormer" from Brazil.
This setup was not created or modified in any way by me.
Input configuration toggles marking by triangles above or below candles or change of candle color as following:
For Long Entry - Gray Candle or Green Triangle Above Candle:
Lower low than previous low and higher close than previous close
For Short Entry - Black Candle or Red Triangle Below Candle:
Higher high than previous high and lower close than previous close
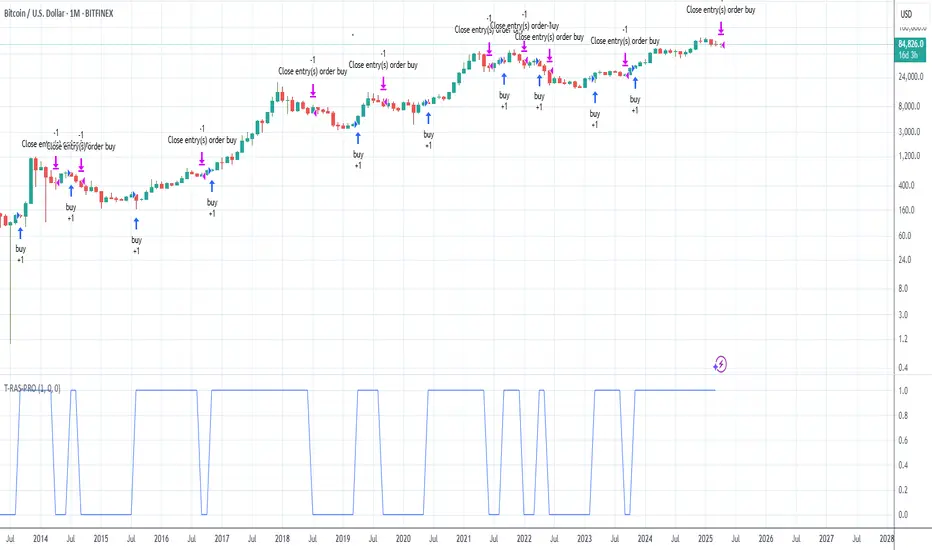
Trend Reversal Alerts Strategy [4H/3M]This is advanced version of T-R.A.S with better logic adapted for 4hour / 3month timeframes
CCI AnalysesThis script analyses the CCI indicator values, showing when a fall in price or a rise in price may happen, or when the CCI is confirming the trend.
The user can personalize:
The period to be used and the range of the CCI bands ( by default)
The slow SMA period to be used and the price percentage variation to react for bullish/bearish
Consecutive number of bullish/bearish in order to consider the CCI as a trend confirmation rather than a price reversal
