AI-Weighted RSI (Zeiierman)█ Overview
AI-Weighted RSI (Zeiierman) is an adaptive oscillator that enhances classic RSI by applying a correlation-weighted prediction layer. Instead of looking only at RSI values directly, this indicator continuously evaluates how other price- and volume-based features (returns, volatility, volume shifts) correlate with RSI, and then weights them accordingly to project the next RSI state.
The result is a smoother, forward-looking RSI framework that adapts to market conditions in real time.
By leveraging feature correlation instead of static formulas, AI-Weighted RSI behaves like a lightweight learning model, adjusting its emphasis depending on which features are most aligned with RSI behavior during the current regime.
█ How It Works
⚪ Feature Extraction
Each bar, the script computes features: log returns, RSI itself, ATR% (volatility), volume, and volume log-change.
⚪ Correlation Screening
Over a rolling learning window, it measures the correlation of each feature against RSI. The strongest relationships are ranked and selected.
⚪ Adaptive Weighting
Features are standardized (z-scored), then combined using their signed correlations as weights, building a rolling, adaptive prediction of RSI.
⚪ Prediction to RSI Weight
The predicted RSI is mapped back into a “weight” scale (±2 by default). Above 0 = bullish bias, below 0 = bearish bias, with color-graded fills to visualize overbought/oversold pressure.
⚪ Signal Line
A smoothing option (signal length) overlays a moving average of the AI-Weighted RSI for clearer trend confirmation.
█ Why AI-Weighted RSI
⚪ Adaptive to Market Regime
Because the model re-evaluates correlations continuously, it naturally shifts which features dominate, sometimes volatility explains RSI best, sometimes volume, sometimes returns.
⚪ Forward-Looking Bias
Instead of simply reflecting RSI, the model provides a projection, helping anticipate shifts in momentum before RSI itself flips.
█ How to Use
⚪ Directional Bias
Read the RSI relative to 0. Above = bullish momentum bias, below = bearish.
⚪ Overbought / Oversold Zones
Shaded fills beyond +0.5 or -0.5 highlight extremes where RSI pressure often exhausts.
⚪ Divergences
When price makes new highs/lows but AI-Weighted RSI fails to confirm, it often signals weakening momentum.
█ Settings
RSI Length: Lookback for the core RSI calculation.
Signal Length: Smoothing applied to the AI-Weighted RSI output.
Learning Window: Bars used for correlation learning and z-scoring.
-----------------
Disclaimer
The content provided in my scripts, indicators, ideas, algorithms, and systems is for educational and informational purposes only. It does not constitute financial advice, investment recommendations, or a solicitation to buy or sell any financial instruments. I will not accept liability for any loss or damage, including without limitation any loss of profit, which may arise directly or indirectly from the use of or reliance on such information.
All investments involve risk, and the past performance of a security, industry, sector, market, financial product, trading strategy, backtest, or individual's trading does not guarantee future results or returns. Investors are fully responsible for any investment decisions they make. Such decisions should be based solely on an evaluation of their financial circumstances, investment objectives, risk tolerance, and liquidity needs.
Rsioscillator

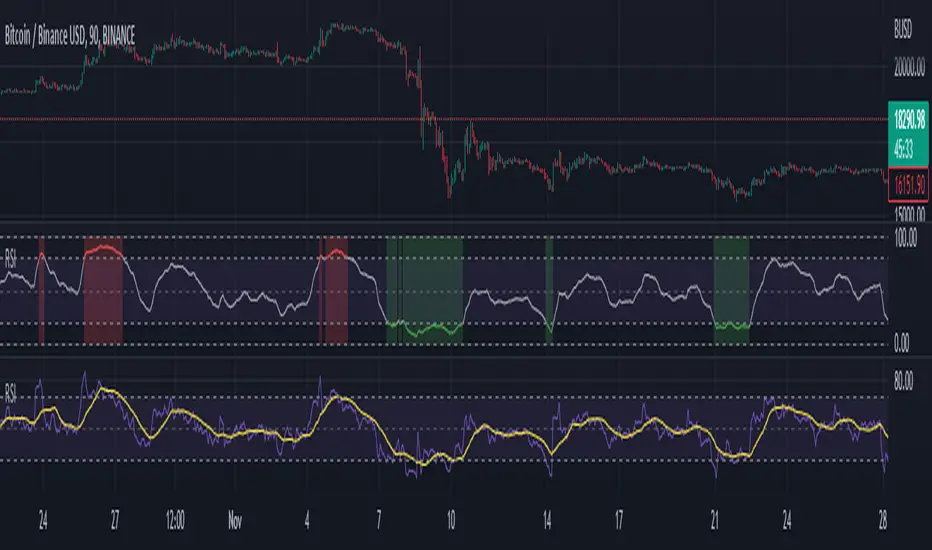
RSI Divergences on price chart - Open Source CodeHello Traders,
I have some exciting news to share with you all! Recently, I came across an incredible RSI divergences indicator developed by Socrate_FR. This indicator, in my opinion has an exceptional accuracy in detecting RSI divergences. However, during my exploration of other indicators in the TradingView library that display signals on the price chart, I found that many of them were often unreliable and missed out on important divergences.One such example is the Prices / RSI Divergences Detector by vtllr. Although vtllr did an amazing job with the indicator, I noticed that it didn't capture several relevant divergences accurately.
This observation inspired me to enhance the most accurate RSI divergences indicator available by showcasing the signals directly on the price chart. By doing so, I aimed to address the issue of unreliable and missed divergences in other price chart indicators. With this enhanced version, you can now effortlessly identify and track RSI regular divergences on the price chart itself:
-Regular bullish divergence occurs when the price forms lower lows while the RSI indicator forms higher lows. It suggests a potential bullish reversal (green line plot)
-Regular bearish divergence occurs when the price forms higher highs while the RSI indicator forms lower highs. It suggests a potential bearish reversal (red line plot)
Another key mofication:
This Indicator introduces a simpler approach compared to the original Socrate indicator. While Socrate differentiated divergences into eight types for both bullish and bearish scenarios, our enhanced version focuses on two distinct categories: small and big divergences. This decision was made to provide a clearer and more user-friendly experience. By condensing the divergence types into two groups, traders can easily identify and analyze the significance of the divergences without getting overwhelmed by excessive variations. The small divergences represent relatively minor divergences, while the big divergences indicate stronger and more significant signals.
-Small divergences represent relatively minor divergences (plotshape small circle)
-Big divergences indicate stronger signals (plotshape big circle)
I firmly believe that this enhanced RSI Divergences Indicator will be an invaluable tool for traders who rely on RSI analysis in their trading strategies. It combines the accuracy of Socrate_FR's original indicator with the enhanced visibility of signals on the price chart, ensuring you never miss any important divergences.
If you're interested in trying out this enhanced version of the indicator, please feel free to access the open-source code. If you want to visit and try the original version of the code visit Socrate_FR profile.
www.tradingview.com
Keep attention!
It is important to note that no trading indicator or strategy is foolproof, and there is always a risk of losses in trading. While this indicator may provide useful information for making conclusions, it should not be used as the sole basis for making trading decisions. Traders should always use proper risk management techniques and consider multiple factors when making trading decisions.
Support us:)
If you find this new indicator helpful in your trading analysis, I would greatly appreciate your support! Please consider to follow, giving it a like, leaving feedback, or sharing it with your trading network. Your engagement will not only help me improve this tool but will also help other traders discover it and benefit from its features. Thank you for your support!

Exponential Smoothed RSII wanted to create a custom RSI to get clearer signals, so I coded this. It is an RSI average (to prevent the classic RSI in and out oversold/overbought zones) that is approaching the 0 and 100 levels with an exponential math formula.
If the "RSI smoothing factor" input increases, the rsi gets easily closer to the 0 and 100 limits.
This RSI will never be lower than 0 or higher than 100, its smoothing is asymptotic to the limits levels
I also added the possibility to change timeframe if you need
Note: the image is a simple confrontation between built-in RSI and exponentially smoothed RSI
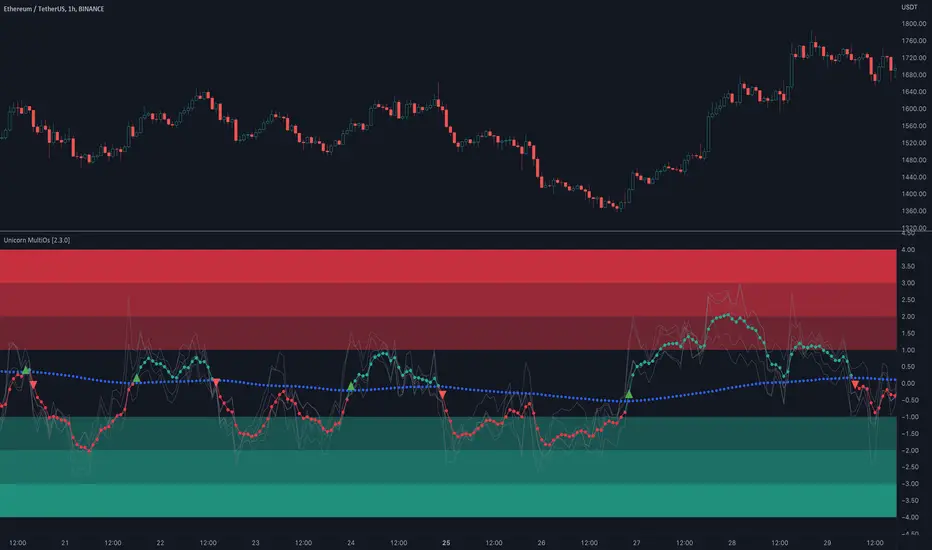
Unicorn MultiOsMultiOs is an oscillator that combines several widely used oscillators into one. In order to combine different oscillators, it is necessary to reduce them to a single scale. To do this we have developed a custom method based on z-scoring and adjusting by volatility .
The user can choose which of the oscillators from the list to combine into one. The combinations are countless. Some of the combinations may be a better fit for certain markets or trading styles. We call this new class of indicators obtained by combining several oscillators into one - "super oscillators". MultiOs provides a wide scopе for experimentation in creating different super oscillators. A good way to start is to combine all the oscillators from the list into one.
As our practice shows, combining several oscillators into one provides a number of advantages:
The compound super oscillator is smoother than any of its components, but its lag does not increase. This is due to the fact that the calculation does not require additional rolling window averaging. The averaging is performed over an ensemble of several non-smoothed oscillators. The signals are easier to read due to this alternative smoothing mechanism.
The signals are more meaningful and confirmed because they contain contributions from several oscillators and represent their consensus.
In the Candle Mode the MultiOs oscillator is plotted as a candlestick chart. You can apply all sorts of technical analysis to the oscillator candlestick chart, including candlestick patterns analysis. Reversal candlestick patterns in the overbought and oversold zones can give you leading price reversal signals.
We have also included an option to apply the regular smoothing to the MultiOs oscillator. The smoothing feature applies a simple moving average to the oscillator. The Smoothing parameter sets the period of the smoothing moving average.
This feature helps to reduce the number of false trend change signals. But don't forget that smoothing increases the indicator lag. So if you use smoothing, prefer smaller Smoothing parameter values (less than 10). And try to find the optimal tradeoff.
HOW TO USE
Choose which oscillators you would like to include into the mixture, and use the resulting super oscillator as your normal oscillator: forecast price reversals with overbought/oversold conditions and divergences, enter trends with zero line cross signals, detect narrow sideways markets when the oscillator fluctuates in the «gray zone» not going overbought or oversold.
When using this script, please, keep in mind that past results do not necessarily reflect future results and that many factors influence trading results.
SETTINGS
The indicator settings panel allows you to set the parameters that control the calculation and visualization of the indicator. You can also more deeply customize the display of the indicator on the Style tab of the indicator settings panel. This can be useful, for example, to change the colors or make some of the lines brighter.
GLOBAL MODE
Candle Mode - turns on/off the Candle Mode in which the MultiOs oscillator is plotted as a candlestick chart.
MAIN
Oscillator period - sets the oscillator period, which determines the size of the main rolling window, on which all calculations are made.
Smoothing - sets the oscillator smoothing intensity. The value 1 corresponds to the absence of smoothing.
Use Momentum, Use RSI , Use Stochastic , etc. - include/exclude the corresponding oscillator in/from the MultiOs calculation.
DISPLAY
Show MultiOS, Show Momentum, Show RSI , etc. - enable/disable the display of the corresponding oscillator.
Show Zero Line - enables/disables the display of the zero level.
Smoothed RSI Heikin Ashi Oscillator w/ Expanded Types [Loxx]Smoothed RSI Heikin-Ashi Oscillator w/ Expanded Types is a spin on Heikin Ashi RSI Oscillator by @JayRogers. The purpose of this modification is to reduce noise in the original version thereby increasing suitability of the signal output. This indicator is tuned for Forex markets.
Differences:
35+ Smoothing Options for RSI
35+ Smoothing Options for HA Candles
Heiken-Ashi Better Expanded Source input. This source input is use for the RSI calculation only.
Signals
Alerts
What are Heiken-Ashi "better" candles?
The "better formula" was proposed in an article/memo by BNP-Paribas (In Warrants & Zertifikate, No. 8, August 2004 (a monthly German magazine published by BNP Paribas, Frankfurt), there is an article by Sebastian Schmidt about further development (smoothing) of Heikin-Ashi chart.)
They proposed to use the following :
(Open+Close)/2+(((Close-Open)/( High-Low ))*ABS((Close-Open)/2))
instead of using :
haClose = (O+H+L+C)/4
According to that document the HA representation using their proposed formula is better than the traditional formula.
What are traditional Heiken-Ashi candles?
The Heikin-Ashi technique averages price data to create a Japanese candlestick chart that filters out market noise.
Heikin-Ashi charts, developed by Munehisa Homma in the 1700s, share some characteristics with standard candlestick charts but differ based on the values used to create each candle. Instead of using the open, high, low, and close like standard candlestick charts, the Heikin-Ashi technique uses a modified formula based on two-period averages. This gives the chart a smoother appearance, making it easier to spots trends and reversals, but also obscures gaps and some price data.
Future updates
Expand signal options to include RSI-, Zero-, and color-crosses
