First X Days Of A YearFirst X-Day Indicator
Overview
The "First X-Day Indicator" is a powerful tool to visualize and analyze market sentiment during the crucial first trading days of each new year. It provides immediate visual feedback on whether the year is starting with positive or negative momentum compared to the previous year's close, a concept often related to market theories like the "January Effect" or the "First Five Days Rule."
The indicator is designed to be clean, intuitive, and fully customizable to fit your charting style.
Key Features
Yearly Baseline: Automatically draws a horizontal line at the previous year's closing price. This line serves as a clear 0% reference for the current year's performance.
Dynamic Background Coloring: For a user-defined number of days at the start of the year, the chart background is colored daily. Green indicates the close is above the previous year's close, while red indicates it's below.
Final Performance Symbol: At the end of the analysis period (e.g., on the 5th day), a single summary symbol (like 👍 or 👎) appears. This symbol represents the final performance outcome of the initial trading period.
Settings & Customization
You have full control over all visual elements:
Analysis Period: Define exactly how many days at the start of the year you want to analyze (e.g., 3, 5, or 10 days).
Line Customization: Fully control the yearly baseline's appearance. You can change its color, width, and style (Solid, Dashed, or Dotted) or hide it completely.
Symbol Customization: Choose any character or emoji for the positive and negative performance symbols. You can also adjust their size (Small, Normal, Large) or hide them.
Background Control: Enable or disable the daily background coloring and select your preferred custom colors for positive and negative days.
Rule

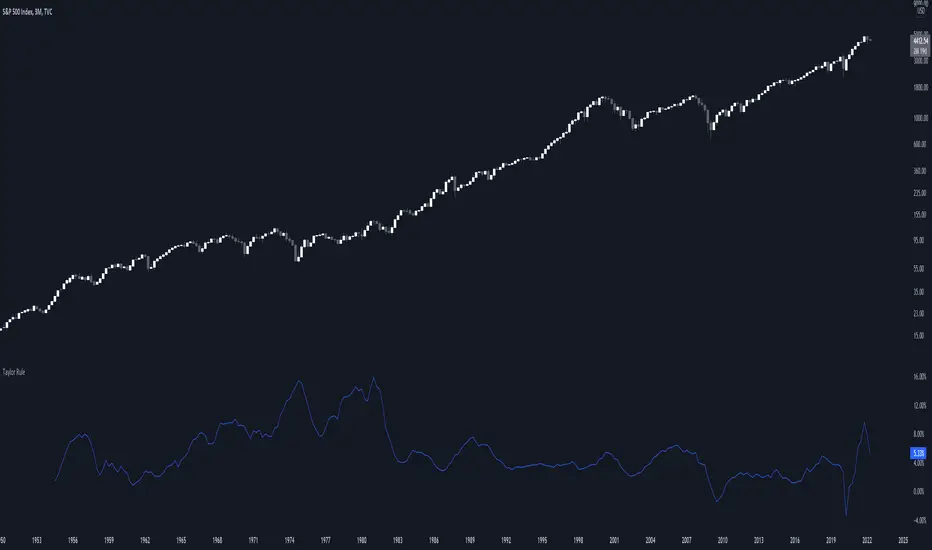
Taylor RuleThe Taylor rule is a simple formula that John Taylor devised to guide policymakers. It calculates what the federal funds rate should be, as a function of the output gap and current inflation. Here, we measure the output gap as the difference between potential output and real GDP. Inflation is measured by changes in the CPI, and we use a target inflation rate of 2%. We also assume a steady-state real interest rate of 2%.
Sahm Rule Recession Indicator (by Alex L.)Real-time Sahm Rule Recession Indicator (idea by Claudia Sahm) based on US national unemployment rate.
I added an enhanced feature (optional) that uses slight variation in Sahm's idea and is usable to detect oversold stocks/crypto.
Enjoy!

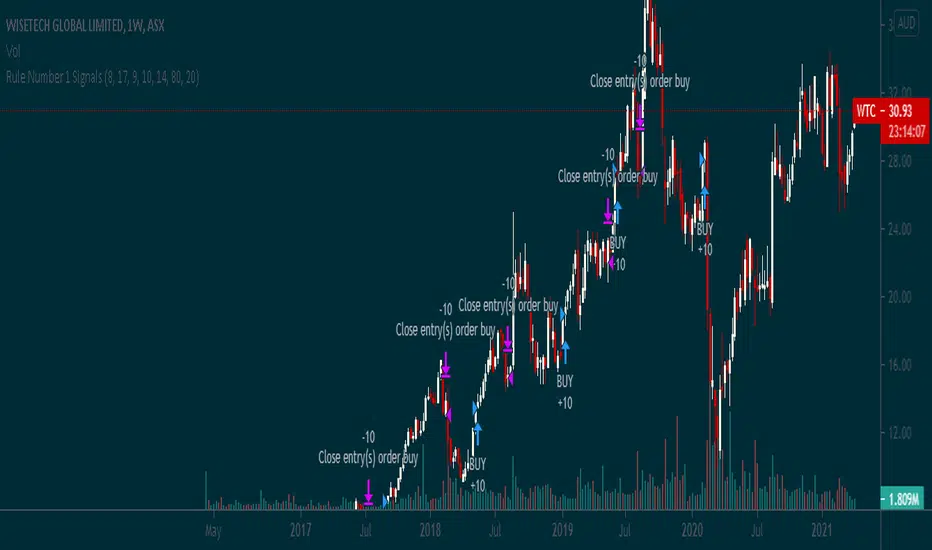
Rule Number 1 Signals [ALERTS]Alerts version of rule number 1 signals, a long-only strategy for long term investors to help them enter positions more optimally

Rule Number 1 SignalsThis script takes the Rule #1 3 tools and plots them on the graph, to provide an additional level of indication for when to sell and when to buy.