Stochastics Confluences 4 in 1Description of the Pine Script:
This script plots the Full Stochastic indicator for four different time periods, and highlights conditions where potential buy or sell signals can be identified. The Stochastic indicator measures the position of the current closing price relative to the range of high and low prices over a defined period, helping traders identify overbought and oversold conditions.
Key Features:
Stochastic Calculation for 4 Different Periods:
The script calculates the Stochastic for four separate lookback periods: 9, 14, 40, and 60 bars.
Each Stochastic value is smoothed by a Simple Moving Average (SMA) to reduce noise and provide a clearer signal.
Visual Representation:
It plots each Stochastic value on the chart using different colors, allowing the user to see how the different periods of the indicator behave relative to each other.
Horizontal lines are drawn at 80 (Upper Bound) and 20 (Lower Bound), commonly used to identify overbought and oversold regions.
Highlighting Buy and Sell Conditions:
Green Highlight (Potential Buy Signal):
When all four Stochastic values (for the four different periods) are below 20, this suggests that the asset is in an oversold condition across multiple timeframes. The green background highlight appears when the Stochastic lines converge below 20, indicating a potential buy signal, as the price may be preparing to move upward from an oversold state.
Red Highlight (Potential Sell Signal):
When all four Stochastic values are above 80, the asset is in an overbought condition across multiple timeframes. The red background highlight appears when the Stochastic lines converge above 80, indicating a potential sell signal, as the price may soon reverse downward from an overbought state.
How to Interpret the Signals:
Buy Signals (Green Highlight):
When the chart is highlighted in green, it means the Stochastic indicators for all four periods are below 20, signaling that the asset is oversold and may be nearing a potential upward reversal. This condition suggests a possible buying opportunity, especially when other indicators confirm the potential for an upward trend.
Sell Signals (Red Highlight):
When the chart is highlighted in red, it indicates that the Stochastic indicators for all four periods are above 80, meaning the asset is overbought. This condition signals a possible downward reversal, suggesting a potential selling opportunity if the price begins to show signs of weakness.
By using this script, traders can visually identify periods of strong confluence across different timeframes when the Stochastic indicators are in extreme oversold or overbought conditions, which are traditionally seen as strong buy or sell signals.
This approach helps filter out weaker signals and focuses on moments when all timeframes align, increasing the probability of a successful trade.
Search in scripts for "信达股份40周年"

[MAD] Fibonacci Bands with SmoothingHi, this is just an easy script, nothing special, it was a request from a community member and was finished in just 40 minutes :D
This indicator offers a approach to tracking market price movements by utilizing Fibonacci-based levels combined with customizable smoothing options for both the bands and the high/low values.
Key Features:
Customizable Moving Averages: Choose from a variety of smoothing methods, including SMA, EMA, WMA, HMA, VWMA, and advanced Ehlers-based methods.
This allows for flexible adaptation to different assets.
Multiple Fibonacci Band Multipliers: The user can define six different multipliers for both the upper and lower Fibonacci bands, allowing for granular customization of the indicator. The middle line serves as the central reference, and the multipliers extend the bands outward based on price range dynamics.
High/Low Smoothing: In addition to smoothing the Fibonacci bands, users can apply smoothing to the high and low prices that form the basis for calculating the Fibonacci bands. This ensures that the indicator responds smoothly to market movements, reducing noise while capturing key trends.
Forward Shift Option: Allows for projecting the bands into the future by shifting the calculated levels forward by a user-specified number of periods. This feature is particularly useful for those interested in anticipating price actions and future trends.
Visual Enhancements: The indicator features filled regions between bands to clearly visualize the zones of price movement. The fills between the bands offer insight into potential support and resistance zones, based on price levels defined by the Fibonacci ratios.
How It Works:
The indicator uses the highest and lowest closing prices over a specified lookback period to establish a price range. Based on this range, it calculates the middle line (0.5 level) and applies user-defined Fibonacci multipliers to generate both upper and lower bands. Users have control over the smoothing method for both the high/low prices and the bands themselves, allowing for an adaptive experience that can be tailored to different timeframes or market conditions.
For visualization, areas between the upper and lower bands are filled with distinct colors, providing an intuitive view of the potential price zones where the market might react or consolidate.
These fills highlight the zones created by the Fibonacci bands, helping users identify critical market levels with ease.
have fun
p.s.: @frankchef hope that suits your needs & expectations ;-)
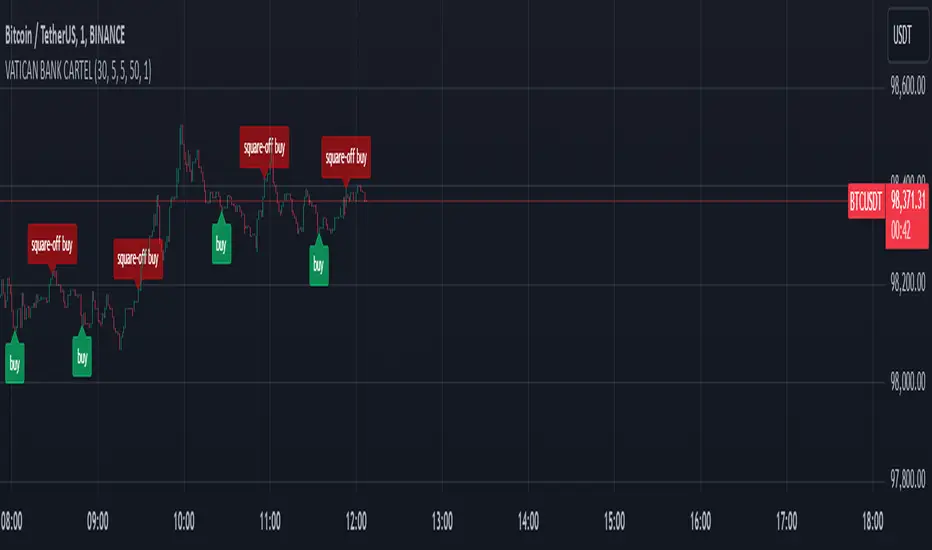
VATICAN BANK CARTELVATICAN BANK CARTEL - Precision Signal Detection for Buyers.
The VATICAN BANK CARTEL indicator is a highly sophisticated tool designed specifically for buyers, helping them identify key market trends and generate actionable buy signals. Utilizing advanced algorithms, this indicator employs a multi-variable detection mechanism that dynamically adapts to price movements, offering real-time insights to assist in executing profitable buy trades. This indicator is optimized solely for identifying buying opportunities, ensuring that traders are equipped to make well-timed entries and exits, without signals for shorting or selling.
The recommended settings for VATICAN BANK CARTEL indicator is as follows:-
Depth Engine = 20,30,40,50,100.
Deviation Engine = 3,5,7,15,20.
Backstep Engine = 15,17,20,25.
NOTE:- But you can also use this indicator as per your setting, whichever setting gives you best results use that setting.
Key Features:
1.Adaptive Depth, Deviation, and Backstep Inputs:
The core of this indicator is its customizable Depth Engine, Deviation Engine, and Backstep Engine parameters. These inputs allow traders to adjust the sensitivity of the trend detection algorithm based on specific market conditions:
Depth: Defines how deep the indicator scans historical price data for potential trend reversals.
Deviation: Determines the minimum required price fluctuation to confirm a market movement.
Backstep: Sets the retracement level to filter false signals and maintain the accuracy of trend detection.
2. Visual Signal Representation:
The VATICAN BANK CARTEL plots highly visible labels on the chart to mark trend reversals. These labels are customizable in terms of size and transparency, ensuring clarity in various chart environments. Traders can quickly spot buying opportunities with green labels and potential square-off points with red labels, focusing exclusively on buy-side signals.
3.Real-Time Alerts:
The indicator is equipped with real-time alert conditions to notify traders of significant buy or square-off buy signals. These alerts, which are triggered based on the indicator’s internal signal logic, ensure that traders never miss a critical market movement on the buy side.
4.Custom Label Size and Transparency:
To enhance visual flexibility, the indicator allows the user to adjust label size (from small to large) and transparency levels. This feature provides a clean, adaptable view suited for different charting styles and timeframes.
How It Works:
The VATICAN BANK CARTEL analyzes the price action using a sophisticated algorithm that considers historical low and high points, dynamically detecting directional changes. When a change in market direction is detected, the indicator plots a label at the key reversal points, helping traders confirm potential entry points:
- Buy Signal (Green): Indicates potential buying opportunities based on a trend reversal.
- Square-Off Buy Signal (Red): Marks the exit point for open buy positions, allowing traders to take profits or protect capital from potential market reversals.
Note: This indicator is exclusively designed to provide signals for buyers. It does not generate sell or short signals, making it ideal for traders focused solely on identifying optimal buying opportunities in the market.
Customizable Parameters:
- Depth Engine: Fine-tunes the historical data analysis for signal generation.
- Deviation Engine: Adjusts the minimum price change required for detecting trends.
- Backstep Engine: Controls the indicator's sensitivity to retracements, minimizing false signals.
- Labels Transparency: Adjusts the opacity of the labels, ensuring they integrate seamlessly into any chart layout.
- Buy and Sell Colors: Customizable color options for buy and square-off buy labels to match your preferred color scheme.
- Label Size: Select between five different label sizes for optimal chart visibility.
Ideal For:
This indicator is ideal for both beginner and experienced traders looking to enhance their buying strategy with a highly reliable, visual, and alert-driven tool. The VATICAN BANK CARTEL adapts to various timeframes, making it suitable for day traders, swing traders, and long-term investors alike—focused exclusively on buying opportunities.
Benefits and Applications:
1.Intraday Trading: The VATICAN BANK CARTEL indicator is particularly well-suited for intraday trading, as it provides accurate and timely "buy" and "square-off buy" signals based on the current market dynamics.
2.Trend-following Strategies: Traders who employ trend-following strategies can leverage the indicator's ability to identify the overall market direction, allowing them to align their trades with the dominant trend.
3.Swing Trading: The dynamic price tracking and signal generation capabilities of the indicator can be beneficial for swing traders, who aim to capture medium-term price movements.
Security Measures:
1. The code includes a security notice at the beginning, indicating that it is subject to the Mozilla Public License 2.0, which is a reputable open-source license.
2. The code does not appear to contain any obvious security vulnerabilities or malicious content that could compromise user data or accounts.
NOTE:- This indicator is provided under the Mozilla Public License 2.0 and is subject to its terms and conditions.
Disclaimer: The usage of VATICAN BANK CARTEL indicator might or might not contribute to your trading capital(money) profits and losses and the author is not responsible for the same.
IMPORTANT NOTICE:
While the indicator aims to provide reliable "buy" and "square-off buy" signals, it is crucial to understand that the market can be influenced by unpredictable events, such as natural disasters, political unrest, changes in monetary policies, or economic crises. These unforeseen situations may occasionally lead to false signals generated by the VATICAN BANK CARTEL indicator.
Users should exercise caution and diligence when relying on the indicator's signals, as the market's behavior can be unpredictable, and external factors may impact the accuracy of the signals. It is recommended to thoroughly backtest the indicator's performance in various market conditions and to use it as one of the many tools in a comprehensive trading strategy, rather than solely relying on its output.
Ultimately, the success of the VATICAN BANK CARTEL indicator will depend on the user's ability to adapt it to their specific trading style, market conditions, and risk management approach. Continuous monitoring, analysis, and adjustment of the indicator's settings may be necessary to maintain its effectiveness in the ever-evolving financial markets.
DEVELOPER:- yashgode9
PineScript:- version:- 5
This indicator aims to enhance trading decision-making by combining DEPTH, DEVIATION, BACKSTEP with custom signal generation, offering a comprehensive tool for traders seeking clear "buy" and "square-off buy" signals on the TradingView platform.
Adaptive Gaussian MA For Loop [BackQuant]Adaptive Gaussian MA For Loop
PLEASE Read the following carefully before applying this indicator to your trading system. Knowing the core logic behind the tools you're using allows you to integrate them into your strategy with confidence and precision.
Introducing BackQuant's Adaptive Gaussian Moving Average For Loop (AGMA FL) — a sophisticated trading indicator that merges the Gaussian Moving Average (GMA) with adaptive volatility to provide dynamic trend analysis. This unique indicator further enhances its effectiveness by utilizing a for-loop scoring mechanism to detect potential shifts in market direction. Let's dive into the components, the rationale behind them, and how this indicator can be practically applied to your trading strategies.
Understanding the Gaussian Moving Average (GMA)
The Gaussian Moving Average (GMA) is a smoothed moving average that applies Gaussian weighting to price data. Gaussian weighting gives more significance to data points near the center of the lookback window, making the GMA particularly effective at reducing noise while maintaining sensitivity to changes in price direction. In contrast to simpler moving averages like the SMA or EMA, GMA provides a more refined smoothing function, which can help traders follow the true trend in volatile markets.
In this script, the GMA is calculated over a defined Calculation Period (default 14), applying a Gaussian filter to smooth out market fluctuations and provide a clearer view of underlying trends.
Adaptive Volatility: A Dynamic Edge
The Adaptive feature in this indicator gives it the ability to adjust its sensitivity based on current market volatility. If the Adaptive option is enabled, the GMA uses a standard deviation-based volatility measure (with a default period of 20) to dynamically adjust the width of the Gaussian filter, allowing the GMA to react faster in volatile markets and more slowly in calm conditions. This dynamic nature ensures that the GMA stays relevant across different market environments.
When the Adaptive setting is disabled, the script defaults to a constant standard deviation value (default 1.0), providing a more stable but less responsive smoothing function.
Why Use Adaptive Gaussian Moving Average?
The Gaussian Moving Average already provides smoother results than standard moving averages, but by adding an adaptive component, the indicator becomes even more responsive to real-time price changes. In fast-moving or highly volatile markets, this adaptation allows traders to react quicker to emerging trends. Conversely, in quieter markets, it reduces over-sensitivity to minor fluctuations, thus lowering the risk of false signals.
For-Loop Scoring Mechanism
The heart of this indicator lies in its for-loop scoring system, which evaluates the smoothed price data (the GMA) over a specified range, comparing it to previous values. This scoring system assigns a numerical value based on whether the current GMA is higher or lower than previous values, creating a trend score.
Long Signals: These are generated when the for-loop score surpasses the Long Threshold (default set at 40), signaling that the GMA is gaining upward momentum, potentially identifying a favorable buying opportunity.
Short Signals: These are triggered when the score crosses below the Short Threshold (default set at -10), indicating that the market may be losing strength and that a selling or shorting opportunity could be emerging.
Thresholds & Customization Options
This indicator offers a high degree of flexibility, allowing you to fine-tune the settings according to your trading style and risk preferences:
Calculation Period: Adjust the lookback period for the Gaussian filter, affecting how smooth or responsive the indicator is to price changes.
Adaptive Mode: Toggle the adaptive feature on or off, allowing the GMA to dynamically adjust based on market volatility or remain consistent with a fixed standard deviation.
Volatility Settings: Control the standard deviation period for adaptive mode, fine-tuning how quickly the GMA responds to shifts in volatility.
For-Loop Settings: Modify the start and end points for the for-loop score calculation, adjusting the depth of analysis for trend signals.
Thresholds for Signals: Set custom long and short thresholds to determine when buy or sell signals should be generated.
Visualization Options: Choose to color bars based on trend direction, plot signal lines, or adjust the background color to reflect current market sentiment visually.
Trading Applications
The Adaptive Gaussian MA For Loop can be applied to a variety of trading styles and markets. Here are some key ways you can use this indicator in practice:
Trend Following: The combination of Gaussian smoothing and adaptive volatility helps traders stay on top of market trends, identifying significant momentum shifts while filtering out noise. The for-loop scoring system enhances this by providing a numerical representation of trend strength, making it easier to spot when a new trend is emerging or when an existing one is gaining strength.
Mean Reversion: For traders looking to capitalize on short-term market corrections, the adaptive nature of this indicator makes it easier to identify when price action is deviating too far from its smoothed trend, allowing for strategic entries and exits based on overbought or oversold conditions.
Swing Trading: With its ability to capture medium-term price movements while avoiding the noise of short-term fluctuations, this indicator is well-suited for swing traders who aim to profit from market reversals or short-to-mid-term trends.
Volatility Management: The adaptive feature allows the indicator to adjust dynamically in volatile markets, ensuring that it remains responsive in times of increased uncertainty while avoiding unnecessary noise in calmer periods. This makes it an effective tool for traders who want to manage risk by staying in tune with changing market conditions.
Final Thoughts
The Adaptive Gaussian MA For Loop is a powerful and flexible indicator that merges the elegance of Gaussian smoothing with the adaptability of volatility-based adjustments. By incorporating a for-loop scoring mechanism, this indicator provides traders with a comprehensive view of market trends and potential trade opportunities.
It’s important to test the settings on historical data and adapt them to your specific trading style, timeframe, and market conditions. As with any technical tool, the AGMA For Loop should be used in conjunction with other indicators and solid risk management practices for the best results.
Thus following all of the key points here are some sample backtests on the 1D Chart
Disclaimer: Backtests are based off past results, and are not indicative of the future.
INDEX:BTCUSD
INDEX:ETHUSD
BINANCE:SOLUSD

Two Pole Butterworth For Loop [BackQuant]Two Pole Butterworth For Loop
PLEASE read the following carefully, as understanding the underlying concepts and logic behind the indicator is key to incorporating it into your trading system in a sound and methodical manner.
Introducing BackQuant's Two Pole Butterworth For Loop (2P BW FL) — an advanced indicator that fuses the power of the Two Pole Butterworth filter with a dynamic for-loop scoring mechanism. This unique approach is designed to extract actionable trading signals by smoothing out price data and then analyzing it using a comparative scoring method. Let's delve into how this indicator works, why it was created, and how it can be used in various trading scenarios.
Understanding the Two Pole Butterworth Filter
The Butterworth filter is a signal processing tool known for its smooth response and minimal distortion. It's often used in electronic and communication systems to filter out unwanted noise. In trading, the Butterworth filter can be applied to price data to smooth out the volatility, providing traders with a clearer view of underlying trends without the whipsaws often associated with market noise.
The Two Pole Butterworth variant further enhances this effect by applying the filter with two poles, effectively creating a sharper transition between the passband and stopband. In simple terms, this allows the filter to follow the price action more closely, reacting to changes while maintaining smoothness.
In this script, the Two Pole Butterworth filter is applied to the Calculation Source (default is set to the closing price), creating a smoothed price series that serves as the foundation for further analysis.
Why Use a Two Pole Butterworth Filter?
The Two Pole Butterworth filter is chosen for its ability to reduce lag while maintaining a smooth output. This makes it an ideal choice for traders who want to capture trends without being misled by short-term volatility or market noise. By filtering the price data, the Two Pole Butterworth enables traders to focus on the broader market movements and avoid false signals.
The For-Loop Scoring Mechanism
In addition to the Butterworth filter, this script uses a for-loop scoring system to evaluate the smoothed price data. The for-loop compares the current value of the filtered price (referred to as "subject") to previous values over a defined range (set by the start and end input). The score is calculated based on whether the subject is higher or lower than the previous points, and the cumulative score is used to determine the strength of the trend.
Long and Short Signal Logic
Long Signals: A long signal is triggered when the score surpasses the Long Threshold (default set at 40). This suggests that the price has built sufficient upward momentum, indicating a potential buying opportunity.
Short Signals: A short signal is triggered when the score crosses under the Short Threshold (default set at -10). This indicates weakening price action or a potential downtrend, signaling a possible selling or shorting opportunity.
By utilizing this scoring system, the indicator identifies moments when the price momentum is shifting, helping traders enter positions at opportune times.
Customization and Visualization Options
One of the strengths of this indicator is its flexibility. Traders can customize various settings to fit their personal trading style or adapt it to different markets and timeframes:
Calculation Periods: Adjust the lookback period for the Butterworth filter, allowing for shorter or longer smoothing depending on the desired sensitivity.
Threshold Levels: Set the long and short thresholds to define when signals should be triggered, giving you control over the balance between sensitivity and specificity.
Signal Line Width and Colors: Customize the visual presentation of the indicator on the chart, including the width of the signal line and the colors used for long and short conditions.
Candlestick and Background Colors: If desired, the indicator can color the candlesticks or the background according to the detected trend, offering additional clarity at a glance.
Trading Applications
This Two Pole Butterworth For Loop indicator is versatile and can be adapted to various market conditions and trading strategies. Here are a few use cases where this indicator shines:
Trend Following: The Butterworth filter smooths the price data, making it easier to follow trends and identify when they are gaining or losing strength. The for-loop scoring system enhances this by providing a clear indication of how strong the current trend is compared to recent history.
Mean Reversion: For traders looking to identify potential reversals, the indicator’s ability to compare the filtered price to previous values over a range of periods allows it to spot moments when the trend may be losing steam, potentially signaling a reversal.
Swing Trading: The combination of smoothing and scoring allows swing traders to capture short to medium-term price movements by filtering out the noise and focusing on significant shifts in momentum.
Risk Management: By providing clear long and short signals, this indicator helps traders manage their risk by offering well-defined entry and exit points. The smooth nature of the Butterworth filter also reduces the risk of getting caught in false signals due to market noise.
Final Thoughts
The Two Pole Butterworth For Loop indicator offers traders a powerful combination of smoothing and scoring to detect meaningful trends and shifts in price momentum. Whether you are a trend follower, swing trader, or someone looking to refine your entry and exit points, this indicator provides the tools to make more informed trading decisions.
As always, it's essential to backtest the indicator on historical data and tailor the settings to your specific trading style and market. While the Butterworth filter helps reduce noise and smooth trends, no indicator can predict the future with absolute certainty, so it should be used in conjunction with other tools and sound risk management practices.
Thus following all of the key points here are some sample backtests on the 1D Chart
Disclaimer: Backtests are based off past results, and are not indicative of the future.
INDEX:BTCUSD
INDEX:ETHUSD
BINANCE:SOLUSD

Fourier For Loop [BackQuant]Fourier For Loop
PLEASE Read the following, as understanding an indicator's functionality is essential before integrating it into a trading strategy. Knowing the core logic behind each tool allows for a sound and strategic approach to trading.
Introducing BackQuant's Fourier For Loop (FFL) — a cutting-edge trading indicator that combines Fourier transforms with a for-loop scoring mechanism. This innovative approach leverages mathematical precision to extract trends and reversals in the market, helping traders make informed decisions. Let's break down the components, rationale, and potential use-cases of this indicator.
Understanding Fourier Transform in Trading
The Fourier Transform decomposes price movements into their frequency components, allowing for a detailed analysis of cyclical behavior in the market. By transforming the price data from the time domain into the frequency domain, this indicator identifies underlying patterns that traditional methods may overlook.
In this script, Fourier transforms are applied to the specified calculation source (defaulted to HLC3). The transformation yields magnitude values that can be used to score market movements over a defined range. This scoring process helps uncover long and short signals based on relative strength and trend direction.
Why Use Fourier Transforms?
Fourier Transforms excel in identifying recurring cycles and smoothing noisy data, making them ideal for fast-paced markets where price movements may be erratic. They also provide a unique perspective on market volatility, offering traders additional insights beyond standard indicators.
Calculation Logic: For-Loop Scoring Mechanism
The For Loop Scoring mechanism compares the magnitude of each transformed point in the series, summing the results to generate a score. This score forms the backbone of the signal generation system.
Long Signals: Generated when the score surpasses the defined long threshold (default set at 40). This indicates a strong bullish trend, signaling potential upward momentum.
Short Signals: Triggered when the score crosses under the short threshold (default set at -10). This suggests a bearish trend or potential downside risk.'
Thresholds & Customization
The indicator offers customizable settings to fit various trading styles:
Calculation Periods: Control how many periods the Fourier transform covers.
Long/Short Thresholds: Adjust the sensitivity of the signals to match different timeframes or risk preferences.
Visualization Options: Traders can visualize the thresholds, change the color of bars based on trend direction, and even color the background for enhanced clarity.
Trading Applications
This Fourier For Loop indicator is designed to be versatile across various market conditions and timeframes. Some of its key use-cases include:
Cycle Detection: Fourier transforms help identify recurring patterns or cycles, giving traders a head-start on market direction.
Trend Following: The for-loop scoring system helps confirm the strength of trends, allowing traders to enter positions with greater confidence.
Risk Management: With clearly defined long and short signals, traders can manage their positions effectively, minimizing exposure to false signals.
Final Note
Incorporating this indicator into your trading strategy adds a layer of mathematical precision to traditional technical analysis. Be sure to adjust the calculation start/end points and thresholds to match your specific trading style, and remember that no indicator guarantees success. Always backtest thoroughly and integrate the Fourier For Loop into a balanced trading system.
Thus following all of the key points here are some sample backtests on the 1D Chart
Disclaimer: Backtests are based off past results, and are not indicative of the future .
INDEX:BTCUSD
INDEX:ETHUSD
BINANCE:SOLUSD

NIFTY - Heatmap [DRK]Nifty 50 Heatmap by Percentage Change
This Pine Script generates a dynamic heatmap for the top 40 weighted stocks in the Nifty 50 index, ordered by their percentage change. The heatmap visually represents the performance of these stocks, with green indicating positive changes and red indicating negative changes.
Features :
Real-time Updates : The heatmap updates in real-time, providing an up-to-date snapshot of market performance.
Color Coding : Stocks are color-coded based on their percentage change, making it easy to identify gainers and losers at a glance.
Future Enhancements:
Indicator : Planned updates include popups or descriptions that provide additional insights, such as key indicators and their positive or negative signals.
Detailed Analysis : Future versions will offer more detailed analysis and insights to help traders make informed decisions.
Stay tuned for these exciting updates!

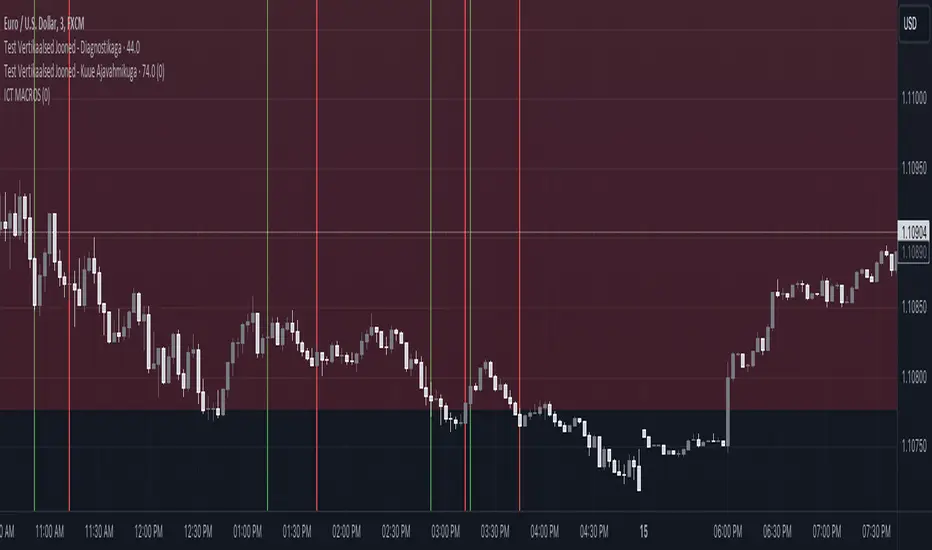
ICT MACROS (UTC-4)This Pine Script creates an indicator that draws vertical lines on a TradingView chart to mark specific time intervals during the day. It allows the user to see when certain predefined time periods start and end, using vertical lines of different colors. The script is designed to work with time frames aligned to the UTC-4 timezone.
### Key Features of the Script
1. **Vertical Line Drawing Function**:
- The script uses a custom function, `draw_vertical_line`, to draw vertical lines at specific times.
- This function takes four parameters:
- `specificTime`: The specific timestamp when the vertical line should be drawn.
- `lineColor`: The color of the vertical line.
- `labelText`: The text label for the line (used internally for debugging purposes).
- `adjustment_minutes`: An integer value that allows time adjustment (in minutes) to make the lines align more accurately with the chart’s candles.
- The function calculates an adjusted time using the `adjustment_minutes` parameter and checks if the current time (`time`) falls within a 3-minute range of the adjusted time. If it does, it draws a vertical line.
2. **User Input for Time Adjustment**:
- The `adjustment_minutes` input allows users to fine-tune the appearance of the lines by shifting them slightly forward or backward in time to ensure they align with the chart candles. This is useful because of potential minor discrepancies between the script’s timestamps and the chart’s actual candle times.
3. **Predefined Time Intervals**:
- The script specifies six different time intervals (using the UTC-4 timezone) and draws vertical lines to mark the start and end of each interval:
- **First interval**: 8:50 - 9:10 AM
- **Second interval**: 9:50 - 10:10 AM
- **Third interval**: 10:50 - 11:10 AM
- **Fourth interval**: 13:10 - 13:40 PM
- **Fifth interval**: 14:50 - 15:10 PM
- **Sixth interval**: 15:15 - 15:45 PM
- For each interval, there are two timestamps: the start time and the end time. The script draws a green vertical line for the start and a red vertical line for the end.
4. **Line Drawing Logic**:
- For each time interval, the script calculates the timestamp using the `timestamp()` function with the specified time in UTC-4.
- The `draw_vertical_line` function is called twice for each interval: once for the start time (with a green line) and once for the end time (with a red line).
5. **Visual Overlay**:
- The script uses the `overlay=true` setting, which means that the vertical lines are drawn directly on top of the existing price chart. This helps in visually identifying the specific time intervals without cluttering the chart.
### Summary
This Pine Script is designed for traders or analysts who want to visualize specific time intervals directly on their TradingView charts. It provides a customizable way to highlight these intervals using vertical lines, making it easier to analyze price action or trading volume during key times of the day. The `adjustment_minutes` input adds flexibility to align these lines accurately with chart data.
Grandfather-Father-Son RSI Buy Indicator-only for daily TFGrandfather-Father-Son RSI Buy and Sell Indicator
This script identifies buy and sell opportunities by combining RSI values across multiple timeframes to capture market trends and reversals. The "Grandfather-Father-Son" concept breaks down RSI analysis into three key timeframes:
Grandfather (Monthly): Represents the long-term trend, helping to filter trades that align with the overall market direction.
Father (Weekly): Provides intermediate-term momentum, confirming market conditions before signaling entry or exit points.
Son (Daily): Tracks short-term corrections and movements to pinpoint precise buy and sell opportunities.
Key Features:
Buy Signal: A buy signal is triggered when:
Monthly RSI (Grandfather) and Weekly RSI (Father) are both above 70.
Daily RSI (Son) is between 40 and 45, signaling a potential market pullback before resuming the upward trend.
The indicator checks for alignment across these timeframes to generate a reliable buy signal.
Sell Signal: A sell signal occurs when the Daily RSI (Son) crosses above 70, indicating a potential overbought condition.
Multi-Timeframe Analysis: The script pulls data from higher timeframes (monthly and weekly) to ensure that signals reflect larger market trends rather than short-term fluctuations.
Instructions:
Optimal Timeframe: This script works best on the Daily timeframe, as it uses Monthly and Weekly RSI for trend confirmation. The indicator will display a warning if applied to other timeframes to ensure it is used optimally.
Trend Alignment: The strategy ensures that buy signals are triggered only when there is a strong uptrend in both the Grandfather (Monthly) and Father (Weekly) RSI, while sell signals are based on potential overbought conditions in the Son (Daily) RSI.
Limitations:
Timeframe Dependency: Signals are based on higher timeframe data (Weekly and Monthly), which may only update at the close of those respective time periods. Therefore, it is designed to work in real-time but will be most reliable when trading in alignment with these longer-term trends.
Replay Mode: The script has been optimized to function correctly during live market conditions, with no reliance on future data (no lookahead). This ensures signals appear accurately during both backtesting and live trading.
Disclaimer:
This script is for educational purposes and should be used with caution. Always backtest before using in live trading and adjust parameters to fit your trading strategy and risk management plan.

Dynamic Volume RSI (DVRSI) [QuantAlgo]Introducing the Dynamic Volume RSI (DVRSI) by QuantAlgo 📈✨
Elevate your trading and investing strategies with the Dynamic Volume RSI (DVRSI) , a powerful tool designed to provide clear insights into market momentum and trend shifts. This indicator is ideal for traders and investors who want to stay ahead of the curve by using volume-responsive calculations and adaptive smoothing techniques to enhance signal clarity and reliability.
🌟 Key Features:
🛠 Customizable RSI Settings: Tailor the indicator to your strategy by adjusting the RSI length and price source. Whether you’re focused on short-term trades or long-term investments, DVRSI adapts to your needs.
🌊 Adaptive Smoothing: Enable adaptive smoothing to filter out market noise and ensure cleaner signals in volatile or choppy market conditions.
🎨 Dynamic Color-Coding: Easily identify bullish and bearish trends with color-coded candles and RSI plots, offering clear visual cues to track market direction.
⚖️ Volume-Responsive Adjustments: The DVRSI reacts to volume changes, giving greater significance to high-volume price moves and improving the accuracy of trend detection.
🔔 Custom Alerts: Stay informed with alerts for key RSI crossovers and trend changes, allowing you to act quickly on emerging opportunities.
📈 How to Use:
✅ Add the Indicator: Set up the DVRSI by adding it to your chart and customizing the RSI length, price source, and smoothing options to fit your specific strategy.
👀 Monitor Visual Cues: Watch for trend shifts through the color-coded plot and candles, signaling changes in momentum as the RSI crosses key levels.
🔔 Set Alerts: Configure alerts for critical RSI crossovers, such as the 50 line, ensuring you stay on top of potential market reversals and opportunities.
🔍 How It Works:
The Dynamic Volume RSI (DVRSI) is a unique indicator designed to provide more accurate and responsive signals by incorporating both price movement and volume sensitivity into the RSI framework. It begins by calculating the traditional RSI values based on a user-defined length and price source, but unlike standard RSI tools, the DVRSI applies volume-weighted adjustments to reflect the strength of market participation.
The indicator dynamically adjusts its sensitivity by factoring in volume to the RSI calculation, which means that price moves backed by higher volumes carry more weight, making the signal more reliable. This method helps identify stronger trends and reduces the risk of false signals in low-volume environments. To further enhance accuracy, the DVRSI offers an adaptive smoothing option that allows users to reduce noise during periods of market volatility. This adaptive smoothing function responds to market conditions, providing a cleaner signal by reducing erratic movements or price spikes that could lead to misleading signals.
Additionally, the DVRSI uses dynamic color-coding to visually represent the strength of bullish or bearish trends. The candles and RSI plots change color based on the RSI values crossing critical thresholds, such as the 50 level, offering an intuitive way to recognize trend shifts. Traders can also configure alerts for specific RSI crossovers (e.g., above 50 or below 40), ensuring that they stay informed of potential trend reversals and significant market shifts in real-time.
The combination of volume sensitivity, adaptive smoothing, and dynamic trend visualization makes the DVRSI a robust and versatile tool for traders and investors looking to fine-tune their market analysis. By incorporating both price and volume data, this indicator delivers more precise signals, helping users make informed decisions with greater confidence.
Disclaimer:
The Dynamic Volume RSI is designed to enhance your market analysis but should not be used as a sole decision-making tool. Always consider multiple factors before making any trading or investment decisions. Past performance is not indicative of future results.

Adaptive RSI-Stoch with Butterworth Filter [UAlgo]The Adaptive RSI-Stoch with Butterworth Filter is a technical indicator designed to combine the strengths of the Relative Strength Index (RSI), Stochastic Oscillator, and a Butterworth Filter to provide a smooth and adaptive momentum-based trading signal. This custom-built indicator leverages the RSI to measure market momentum, applies Stochastic calculations for overbought/oversold conditions, and incorporates a Butterworth Filter to reduce noise and smooth out price movements for enhanced signal reliability.
By utilizing these combined methods, this indicator aims to help traders identify potential market reversal points, momentum shifts, and overbought/oversold conditions with greater precision, while minimizing false signals in volatile markets.
🔶 Key Features
Adaptive RSI and Stochastic Oscillator: Calculates RSI using a configurable period and applies a dual-smoothing mechanism with Stochastic Oscillator values (K and D lines).
Helps in identifying momentum strength and potential trend reversals.
Butterworth Filter: An advanced signal processing filter that reduces noise and smooths out the indicator values for better trend identification.
The filter can be enabled or disabled based on user preferences.
Customizable Parameters: Flexibility to adjust the length of RSI, the smoothing factors for Stochastic (K and D values), and the Butterworth Filter period.
🔶 Interpreting the Indicator
RSI & Stochastic Calculations:
The RSI is calculated based on the closing price over the user-defined period, and further smoothed to generate Stochastic Oscillator values.
The K and D values of the Stochastic Oscillator provide insights into short-term overbought or oversold conditions.
Butterworth Filter Application:
What is Butterworth Filter and How It Works?
The Butterworth Filter is a type of signal processing filter that is designed to have a maximally flat frequency response in the passband, meaning it doesn’t distort the frequency components of the signal within the desired range. It is widely used in digital signal processing and technical analysis to smooth noisy data while preserving the important trends in the underlying data. In this indicator, the Butterworth Filter is applied to the trigger value, making the resulting signal smoother and more stable by filtering out short-term fluctuations or noise in price data.
Key Concepts Behind the Butterworth Filter:
Filter Design: The Butterworth filter works by calculating weighted averages of current and past inputs (price or indicator values) and outputs to produce a smooth output. It is characterized by the absence of ripple in the passband and a smooth roll-off after the cutoff frequency.
Cutoff Frequency: The period specified in the indicator acts as a control for the cutoff frequency. A higher period means the filter will remove more high-frequency noise and retain longer-term trends, while a lower period means it will respond more to short-term fluctuations in the data.
Smoothing Process: In this script, the Butterworth Filter is calculated recursively using the following formula,
butterworth_filter(series float input, int period) =>
float wc = math.tan(math.pi / period)
float k1 = 1.414 * wc
float k2 = wc * wc
float a0 = k2 / (1 + k1 + k2)
float a1 = 2 * a0
float a2 = a0
float b1 = 2 * (k2 - 1) / (1 + k1 + k2)
float b2 = (1 - k1 + k2) / (1 + k1 + k2)
wc: This is the angular frequency, derived from the period input.
k1 and k2: These are intermediate coefficients used in the filter calculation.
a0, a1, a2: These are the feedforward coefficients, which determine how much of the current and past input values will contribute to the filtered output.
b1, b2: These are feedback coefficients, which determine how much of the past output values will contribute to the current output, effectively allowing the filter to "remember" past behavior and smooth the signal.
Recursive Calculation: The filter operates by taking into account not only the current input value but also the previous two input values and the previous two output values. This recursive nature helps it smooth the signal by blending the recent past data with the current data.
float filtered_value = a0 * input + a1 * prev_input1 + a2 * prev_input2
filtered_value -= b1 * prev_output1 + b2 * prev_output2
input: The current input value, which could be the trigger value in this case.
prev_input1, prev_input2: The previous two input values.
prev_output1, prev_output2: The previous two output values.
This means the current filtered value is determined by the combination of:
A weighted sum of the current input and the last two inputs.
A correction based on the last two output values to ensure smoothness and remove noise.
In conclusion when filter is enabled, the Butterworth Filter smooths the RSI and Stochastic values to reduce market noise and highlight significant momentum shifts.
The filtered trigger value (post-Butterworth) provides a cleaner representation of the market's momentum.
Cross Signals for Trade Entries:
Buy Signal: A bullish crossover of the K value above the D value, particularly when the values are below 40 and when the Stochastic trigger is below 1 and the filtered trigger is below 35.
Sell Signal: A bearish crossunder of the K value below the D value, particularly when the values are above 60 and when the Stochastic trigger is above 99 and the filtered trigger is above 90.
These signals are plotted visually on the chart for easy identification of potential trading opportunities.
Overbought and Oversold Zones:
The indicator highlights the overbought zone when the filtered trigger surpasses a specific threshold (typically above 100) and the oversold zone when it drops below 0.
The color-coded fill areas between the Stochastic and trigger lines help visualize when the market may be overbought (likely a reversal down) or oversold (potential reversal up).
🔶 Disclaimer
Use with Caution: This indicator is provided for educational and informational purposes only and should not be considered as financial advice. Users should exercise caution and perform their own analysis before making trading decisions based on the indicator's signals.
Not Financial Advice: The information provided by this indicator does not constitute financial advice, and the creator (UAlgo) shall not be held responsible for any trading losses incurred as a result of using this indicator.
Backtesting Recommended: Traders are encouraged to backtest the indicator thoroughly on historical data before using it in live trading to assess its performance and suitability for their trading strategies.
Risk Management: Trading involves inherent risks, and users should implement proper risk management strategies, including but not limited to stop-loss orders and position sizing, to mitigate potential losses.
No Guarantees: The accuracy and reliability of the indicator's signals cannot be guaranteed, as they are based on historical price data and past performance may not be indicative of future results.

RSI Trend Following StrategyOverview
The RSI Trend Following Strategy utilizes Relative Strength Index (RSI) to enter the trade for the potential trend continuation. It uses Stochastic indicator to check is the price is not in overbought territory and the MACD to measure the current price momentum. Moreover, it uses the 200-period EMA to filter the counter trend trades with the higher probability. The strategy opens only long trades.
Unique Features
Dynamic stop-loss system: Instead of fixed stop-loss level strategy utilizes average true range (ATR) multiplied by user given number subtracted from the position entry price as a dynamic stop loss level.
Configurable Trading Periods: Users can tailor the strategy to specific market windows, adapting to different market conditions.
Two layers trade filtering system: Strategy utilizes MACD and Stochastic indicators measure the current momentum and overbought condition and use 200-period EMA to filter trades against major trend.
Trailing take profit level: After reaching the trailing profit activation level script activates the trailing of long trade using EMA. More information in methodology.
Wide opportunities for strategy optimization: Flexible strategy settings allows users to optimize the strategy entries and exits for chosen trading pair and time frame.
Methodology
The strategy opens long trade when the following price met the conditions:
RSI is above 50 level.
MACD line shall be above the signal line
Both lines of Stochastic shall be not higher than 80 (overbought territory)
Candle’s low shall be above the 200 period EMA
When long trade is executed, strategy set the stop-loss level at the price ATR multiplied by user-given value below the entry price. This level is recalculated on every next candle close, adjusting to the current market volatility.
At the same time strategy set up the trailing stop validation level. When the price crosses the level equals entry price plus ATR multiplied by user-given value script starts to trail the price with trailing EMA(by default = 20 period). If price closes below EMA long trade is closed. When the trailing starts, script prints the label “Trailing Activated”.
Strategy settings
In the inputs window user can setup the following strategy settings:
ATR Stop Loss (by default = 1.75)
ATR Trailing Profit Activation Level (by default = 2.25)
MACD Fast Length (by default = 12, period of averaging fast MACD line)
MACD Fast Length (by default = 26, period of averaging slow MACD line)
MACD Signal Smoothing (by default = 9, period of smoothing MACD signal line)
Oscillator MA Type (by default = EMA, available options: SMA, EMA)
Signal Line MA Type (by default = EMA, available options: SMA, EMA)
RSI Length (by default = 14, period for RSI calculation)
Trailing EMA Length (by default = 20, period for EMA, which shall be broken close the trade after trailing profit activation)
Justification of Methodology
This trading strategy is designed to leverage a combination of technical indicators—Relative Strength Index (RSI), Moving Average Convergence Divergence (MACD), Stochastic Oscillator, and the 200-period Exponential Moving Average (EMA)—to determine optimal entry points for long trades. Additionally, the strategy uses the Average True Range (ATR) for dynamic risk management to adapt to varying market conditions. Let's look in details for which purpose each indicator is used for and why it is used in this combination.
Relative Strength Index (RSI) is a momentum indicator used in technical analysis to measure the speed and change of price movements in a financial market. It helps traders identify whether an asset is potentially overbought (overvalued) or oversold (undervalued), which can indicate a potential reversal or continuation of the current trend.
How RSI Works? RSI tracks the strength of recent price changes. It compares the average gains and losses over a specific period (usually 14 periods) to assess the momentum of an asset. Average gain is the average of all positive price changes over the chosen period. It reflects how much the price has typically increased during upward movements. Average loss is the average of all negative price changes over the same period. It reflects how much the price has typically decreased during downward movements.
RSI calculates these average gains and losses and compares them to create a value between 0 and 100. If the RSI value is above 70, the asset is generally considered overbought, meaning it might be due for a price correction or reversal downward. Conversely, if the RSI value is below 30, the asset is considered oversold, suggesting it could be poised for an upward reversal or recovery. RSI is a useful tool for traders to determine market conditions and make informed decisions about entering or exiting trades based on the perceived strength or weakness of an asset's price movements.
This strategy uses RSI as a short-term trend approximation. If RSI crosses over 50 it means that there is a high probability of short-term trend change from downtrend to uptrend. Therefore RSI above 50 is our first trend filter to look for a long position.
The MACD (Moving Average Convergence Divergence) is a popular momentum and trend-following indicator used in technical analysis. It helps traders identify changes in the strength, direction, momentum, and duration of a trend in an asset's price.
The MACD consists of three components:
MACD Line: This is the difference between a short-term Exponential Moving Average (EMA) and a long-term EMA, typically calculated as: MACD Line = 12 period EMA − 26 period EMA
Signal Line: This is a 9-period EMA of the MACD Line, which helps to identify buy or sell signals. When the MACD Line crosses above the Signal Line, it can be a bullish signal (suggesting a buy); when it crosses below, it can be a bearish signal (suggesting a sell).
Histogram: The histogram shows the difference between the MACD Line and the Signal Line, visually representing the momentum of the trend. Positive histogram values indicate increasing bullish momentum, while negative values indicate increasing bearish momentum.
This strategy uses MACD as a second short-term trend filter. When MACD line crossed over the signal line there is a high probability that uptrend has been started. Therefore MACD line above signal line is our additional short-term trend filter. In conjunction with RSI it decreases probability of following false trend change signals.
The Stochastic Indicator is a momentum oscillator that compares a security's closing price to its price range over a specific period. It's used to identify overbought and oversold conditions. The indicator ranges from 0 to 100, with readings above 80 indicating overbought conditions and readings below 20 indicating oversold conditions.
It consists of two lines:
%K: The main line, calculated using the formula (CurrentClose−LowestLow)/(HighestHigh−LowestLow)×100 . Highest and lowest price taken for 14 periods.
%D: A smoothed moving average of %K, often used as a signal line.
This strategy uses stochastic to define the overbought conditions. The logic here is the following: we want to avoid long trades in the overbought territory, because when indicator reaches it there is a high probability that the potential move is gonna be restricted.
The 200-period EMA is a widely recognized indicator for identifying the long-term trend direction. The strategy only trades in the direction of this primary trend to increase the probability of successful trades. For instance, when the price is above the 200 EMA, only long trades are considered, aligning with the overarching trend direction.
Therefore, strategy uses combination of RSI and MACD to increase the probability that price now is in short-term uptrend, Stochastic helps to avoid the trades in the overbought (>80) territory. To increase the probability of opening long trades in the direction of a main trend and avoid local bounces we use 200 period EMA.
ATR is used to adjust the strategy risk management to the current market volatility. If volatility is low, we don’t need the large stop loss to understand the there is a high probability that we made a mistake opening the trade. User can setup the settings ATR Stop Loss and ATR Trailing Profit Activation Level to realize his own risk to reward preferences, but the unique feature of a strategy is that after reaching trailing profit activation level strategy is trying to follow the trend until it is likely to be finished instead of using fixed risk management settings. It allows sometimes to be involved in the large movements.
Backtest Results
Operating window: Date range of backtests is 2023.01.01 - 2024.08.01. It is chosen to let the strategy to close all opened positions.
Commission and Slippage: Includes a standard Binance commission of 0.1% and accounts for possible slippage over 5 ticks.
Initial capital: 10000 USDT
Percent of capital used in every trade: 30%
Maximum Single Position Loss: -3.94%
Maximum Single Profit: +15.78%
Net Profit: +1359.21 USDT (+13.59%)
Total Trades: 111 (36.04% win rate)
Profit Factor: 1.413
Maximum Accumulated Loss: 625.02 USDT (-5.85%)
Average Profit per Trade: 12.25 USDT (+0.40%)
Average Trade Duration: 40 hours
These results are obtained with realistic parameters representing trading conditions observed at major exchanges such as Binance and with realistic trading portfolio usage parameters.
How to Use
Add the script to favorites for easy access.
Apply to the desired timeframe and chart (optimal performance observed on 2h BTC/USDT).
Configure settings using the dropdown choice list in the built-in menu.
Set up alerts to automate strategy positions through web hook with the text: {{strategy.order.alert_message}}
Disclaimer:
Educational and informational tool reflecting Skyrex commitment to informed trading. Past performance does not guarantee future results. Test strategies in a simulated environment before live implementation

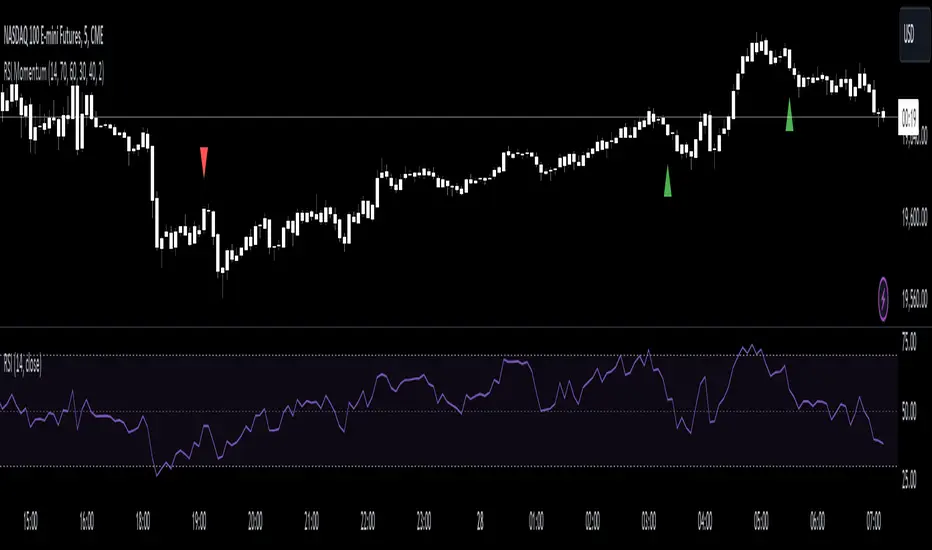
RSI Momentum [CrossTrade]The RSI Momentum indicator generates buy and sell signals based on the Relative Strength Index (RSI) crossing specific thresholds. The Key difference is that we're using RSI overbought and oversold readings as the foundation for finding continuation signals in the same direction of that momentum. This solves the issue of trying to buy the bottom or sell the top and offsets any oscillators main weakness, divergence and false signals in a strong trend.
Key Parameters:
RSI Length: Determines the calculation period for the RSI.
Overbought Threshold: The RSI level above which the asset is considered overbought.
Momentum Loss Threshold for Buy: The RSI level below which a loss in upward momentum is indicated, triggering a potential buy signal.
Oversold Threshold: The RSI level below which the asset is considered oversold.
Momentum Loss Threshold for Sell: The RSI level above which a loss in downward momentum is indicated, triggering a potential sell signal.
Allow Additional Retracement Signals: A toggle to allow more than one signal within a certain number of bars after the first signal.
Max Additional Signals: The maximum number of additional signals allowed after the first signal.
Buy Signal Logic:
Initial Signal: Generated when the RSI first exceeds the overbought threshold and then falls below the momentum loss buy threshold. Defaults are 70 for the overbought threshold and 60 for the retracement level.
Additional Signals for Deeper Retracements: If enabled, the script shows additional buy signals within the maximum limit set by Max Additional Signals. These additional signals are shown only if each new signal's bar has a lower low than the previous signal's bar.
Sell Signal Logic:
Initial Signal: Similar to the buy signal, a sell signal is generated when the RSI first drops below the oversold threshold and then rises above the momentum loss sell threshold. Defaults are 30 for the oversold threshold and 40 for the retracement level.
Additional Signals for Deeper Retracements: If enabled, additional sell signals are shown, limited by Max Additional Signals, and only if each new signal's bar has a higher high than the previous signal's bar.
Continuation Signals in Strong Trends:
The script allows for a new series of signals (starting with the first signal again) when the RSI pattern repeats. For buy signals, this means going above the overbought and then below the momentum loss buy threshold. For sell signals, it's dropping below oversold and then above the momentum loss sell threshold.
Alerts:
The script includes alert conditions for both buy and sell signals, which can be configured in the TradingView alerts.
Scalping with Williams %R, MACD, and SMA (1m)Overview:
This trading strategy is designed for scalping in the 1-minute timeframe. It uses a combination of the Williams %R, MACD, and SMA indicators to generate buy and sell signals. It also includes alert functionalities to notify users when trades are executed or closed.
Indicators Used:
Williams %R : A momentum indicator that measures overbought and oversold conditions. The Williams %R values range from -100 to 0.
Length: 140 bars (i.e., 140-period).
MACD (Moving Average Convergence Divergence) : A trend-following momentum indicator that shows the relationship between two moving averages of a security's price.
Fast Length: 24 bars
Slow Length: 52 bars
MACD Length: 9 bars (signal line)
SMA (Simple Moving Average) : A trend-following indicator that smooths out price data to create a trend-following indicator.
Length: 7 bars
Conditions and Logic:
Timeframe Check :
The strategy is designed specifically for the 1-minute timeframe. If the current chart is not on the 1-minute timeframe, a warning label is displayed on the chart instructing the user to switch to the 1-minute timeframe.
Williams %R Conditions :
Buy Condition: The strategy looks for a crossover of Williams %R from below -94 to above -94. This indicates a potential buying opportunity when the market is moving out of an oversold condition.
Sell Condition: The strategy looks for a crossunder of Williams %R from above -6 to below -6. This indicates a potential selling opportunity when the market is moving out of an overbought condition.
Deactivate Buy: If Williams %R crosses above -40, the buy signal is deactivated, suggesting that the buying condition is no longer valid.
Deactivate Sell: If Williams %R crosses below -60, the sell signal is deactivated, suggesting that the selling condition is no longer valid.
MACD Conditions :
MACD Histogram: Used to identify the momentum and the direction of the trend.
Long Entry: The strategy initiates a buy order if the MACD histogram shows a positive bar after a negative bar while a buy condition is active and Williams %R is above -94.
Long Exit: The strategy exits the buy position if the MACD histogram turns negative and is below the previous histogram bar.
Short Entry: The strategy initiates a sell order if the MACD histogram shows a negative bar after a positive bar while a sell condition is active and Williams %R is below -6.
Short Exit: The strategy exits the sell position if the MACD histogram turns positive and is above the previous histogram bar.
Trend Confirmation (Using SMA) :
Bullish Trend: The strategy considers a bullish trend if the current price is above the 7-bar SMA. A buy signal is only considered if this condition is met.
Bearish Trend: The strategy considers a bearish trend if the current price is below the 7-bar SMA. A sell signal is only considered if this condition is met.
Alerts:
Long Entry Alert: An alert is triggered when a buy order is executed.
Long Exit Alert: An alert is triggered when the buy order is closed.
Short Entry Alert: An alert is triggered when a sell order is executed.
Short Exit Alert: An alert is triggered when the sell order is closed.
Summary:
Buy Signal: Activated when Williams %R crosses above -94 and the price is above the 7-bar SMA. A buy order is placed if the MACD histogram shows a positive bar after a negative bar. The buy order is closed when the MACD histogram turns negative and is below the previous histogram bar.
Sell Signal: Activated when Williams %R crosses below -6 and the price is below the 7-bar SMA. A sell order is placed if the MACD histogram shows a negative bar after a positive bar. The sell order is closed when the MACD histogram turns positive and is above the previous histogram bar.
This strategy combines momentum (Williams %R), trend-following (MACD), and trend confirmation (SMA) to identify trading opportunities in the 1-minute timeframe. It is designed for short-term trading or scalping.

ADV_RSIADV_RSI - Advanced Relative Strength Index
Description: The ADV_RSI indicator is an advanced and mutated version of the classic Relative Strength Index (RSI), enhanced with multiple moving averages and a dynamic color-coding system. It provides traders with deeper insights into market momentum and potential trend reversals by incorporating two different moving averages of the RSI (21, and 50 periods). The indicator helps to visualize overbought and oversold conditions more effectively and offers a clear, color-coded representation of the RSI value relative to key thresholds.
Features:
RSI Calculation: The core of the indicator is based on the traditional RSI, calculated over a customizable period.
Multiple Moving Averages: The script includes two RSI moving averages (21, and 50 periods) to help identify trend strength and potential reversal points.
Dynamic RSI Color Coding: The RSI line is color-coded based on its value, ranging from red for overbought conditions to aqua for oversold conditions. This makes it easier to interpret the market's momentum at a glance.
Threshold Bands: The indicator includes horizontal threshold lines at key RSI levels (20, 30, 40, 50, 60, 70, 80), with shaded areas between them, providing a visual aid to quickly identify overbought and oversold zones.
How to Use:
The RSI line fluctuates between 0 and 100, with traditional overbought and oversold levels set at 70 and 30, respectively.
When the RSI crosses above the 70 level, it may indicate overbought conditions, signaling a potential selling opportunity.
When the RSI falls below the 30 level, it may indicate oversold conditions, signaling a potential buying opportunity.
The included moving averages of the RSI can help confirm trend direction and potential reversals.
The color coding of the RSI line provides a quick visual cue for momentum changes.
Ideal For:
Traders looking for a more nuanced understanding of market momentum.
Those who prefer visual aids for quick decision-making in identifying overbought and oversold conditions.
Traders who utilize multiple timeframes and need a comprehensive RSI tool for better accuracy in their analysis.

Pivot Channel Breaks [BigBeluga]Pivot Channel Break
The Pivot Channel Break indicator identifies key pivot points and creates a dynamic channel based on these pivots. It detects breakouts from this channel, providing potential entry and exit signals for traders.
🔵 How to Use
Channel Identification:
- Upper and lower channel lines drawn based on pivot highs and lows
- Channel width dynamically adjusted using ATR-like calculation
Breakout Signals:
- Upward breakout: Price closes above upper channel line
- Downward breakout: Price closes below lower channel line
- Signals shown as X marks on the chart
Pivot Points:
- High pivots marked with "H" triangles
- Low pivots marked with "L" triangles
Support & Resistance:
- Optional signals when price touches but doesn't break channel lines
Trend Visualization:
- Optional bar coloring based on the most recent breakout direction
🔵 Customization
• Pivot Right: Lookback period for pivot detection (default: 10)
• Pivot Left: Forward period for pivot confirmation (default: 40)
• Channel Width: Multiplier for channel width calculation (default: 1.0)
• Support & Resistance Signals: Toggle additional touch signals
• Bar Color: Enable/disable trend-based bar coloring
Calculation:
Detect pivot highs and lows using specified lookback periods
Calculate channel basis using 10-period SMA of close prices
Determine channel width using ATR-like calculation: RMA(high - low, 10) * width multiplier
Set channel lines based on pivot points and calculated deviations
Identify breakouts when price crosses beyond channel lines
The Pivot Channel Break indicator offers a dynamic approach to identifying potential trend changes and breakout opportunities. It combines pivot point analysis with a flexible channel calculation, providing traders with a visual tool for market structure analysis. Use this indicator in conjunction with other technical analysis methods to confirm signals and manage risk effectively.

Quatro SMA Strategy [4h]Hello, I would like to present to you The "Quatro SMA" strategy
Strategy is based on four simple moving averages of different lengths and monitoring trading volume. The key idea is to identify strong market trends by comparing short-term moving averages with the long-term SMA. The strategy generates buy signals when all short-term SMAs are above the SMA(200) and the volume confirms the strength of the move. Similarly, sell signals are generated when all short-term SMAs are below the SMA(200), and the volume is sufficiently high.
The strategy manages risk by applying a stop loss and three different Take Profit levels (TP1, TP2, TP3), with varying percentages of the position closed at each level.
Each Take Profit level is triggered at a specific percentage gain, with the position being closed gradually depending on the achieved targets. The percentage of the position closed at each TP level is also defined by the user.
Indicators and Parameters:
Simple Moving Averages (SMA):
The script utilizes four simple moving averages with different lengths (4, 16, 32, 200). The first three SMAs (SMA1, SMA2, SMA3) are used to determine the trend direction, while the fourth SMA (with a length of 200) serves as a support/resistance line.
Volume:
The script monitors trading volume and checks if the current volume exceeds 2.5 times the average volume of the last 40 candles. High volume is considered as confirmation of trend strength.
Entry Conditions:
- Long Position: Triggered when SMA1 > SMA2 > SMA3, the closing price is above SMA(200), and the volume condition is met.
- Short Position: Triggered when SMA1 < SMA2 < SMA3, the closing price is below SMA(200), and the volume condition is met.
Exit Conditions:
- Long Position: Closed when SMA1 < SMA2 < SMA3 and the closing price is above SMA(200).
- Short Position: Closed when SMA1 > SMA2 > SMA3 and the closing price is below SMA(200).
to determine the level of stop loss and target point I used a piece of code by RafaelZioni, here is the script from which a piece of code was taken
I hope the strategy will be helpful, as always, best regards and safe trades
;)

Macro Times [Blu_Ju]About ICT Macro Times:
The Inner Circle Trader (ICT) has taught that there are certain time sessions when the Interbank Price Delivery Algorithm (IPDA) is running a macro. The macro itself could be a repricing macro, a consolidation macro, etc. - this depends on where price currently is in relation to its draw. The times the macro is active do not change however, and are always the following (in New York local time):
8:50-9:10 (premarket macro)
9:50-10:10 (AM macro 1)
10:50-11:10 (AM macro 2)
11:50-12:10 (lunch macro)
13:10-13:40 (PM macro)
15:15-15:45 (final hour macro)
Because these times are fixed, traders can anticipate a setup is likely to form in or around these sessions. Setups may involve sweeps of liquidity (highs/lows), repricing to inefficiencies (e.g., fair value gaps), breaker setups, etc. (The specific setup involved is beyond the scope of this script; this script is concerned with visually marking the time sessions only.)
About this Script:
The scope of this script is to visually identify the macro active time sessions. This script draws vertical lines to mark the start and end of the macro time sessions. Optionally, the user can use a background color for the macro session with or without the vertical lines. The user can also toggle on or off any of the macro sessions, if he or she is only interested in certain ones. The user also has the freedom to change the times of the macro sessions if he or she is interested in a different time.
What makes this script unique is that it plots the macro time sessions after midnight for each day, before the real-time bar reaches the macro times. This is advantageous to the trader, as it gives the trader a visual cue that the macro times are approaching. When watching price it is easy to lose track of time, and the purpose of this script is to help the trader maintain where price is in relation to the macro time sessions in a simple, visual way.

Percentages from 52 Week HighThis script is helpful for anyone that wants to monitor 5, 10, 20, 30, 40, 50% drops from the 52 week moving high.
I have been using a version of this script for a few years now and thought I would share it back with the community as I wrote it in 2021 to find quick deals when flipping through charts of stocks I've been watching. I never seemed to find anything doing this simple yet intuitive thing and I found myself regularly computing these lines manually on each chart. This will save you from having to do that as it automatically draws each level on your chart based on the recent 52 week or daily high.
I recently added the ability to turn on/off different levels and defaulted to setting 5, 10, and 20 % drops from the 52 week high. You can also change this to be a 52 day moving high if that's your preference.
Please let me know if you have ideas for modification as I wanted to share this with the community given I had not seen anything out there giving me what I wanted - which is why I wrote it.
All the best friends.

MVRV-Z adjusted EN version (by ilyaevp95)Descriptions:
The MVRV Z-Score indicator is a powerful tool designed by original authors Murad Mahmudov and David Puell for BTC to help traders make informed decisions about their cryptocurrency investments. It is based on the MVRV (Market Value to Realized Value) metric, which measures the relationship between the market capitalization and the realized capitalization of a cryptocurrency. The indicator provides signals for accumulating or selling an asset based on deviations in market capitalization from realized capitalization.
How it works:
Market Capitalization : This is the total value of coins that have been issued at a given point in time. Market capitalization is calculated by multiplying the current price of the asset by the number of coins that have been issued.
Realized Capitalization (Realized Price) : This is the amount of money that has been spent on purchasing a particular asset. In the context of cryptocurrencies, it represents the sum of all transaction values for a specific blockchain. Realized capitalization can be calculated using historical data on transaction prices.
MVRV Metric : The MVRV metric compares market capitalization with realized capitalization, providing a measure of how overvalued or undervalued a cryptocurrency is relative to its historical transaction data. A high MVRV value indicates that the market is overvaluing the asset, while a low MVRV suggests undervaluation.
Z-Score Calculation : The Z-score is a statistical measure that normalizes the deviation of market capitalization from its mean value (realized capitalization) to a standard deviation. This makes it possible to compare assets that have different values and time periods, as it takes into account the volatility of the market.
Note: For accurate Z-score calculation, you need to use the indicator on a chart with a mostly complete historical data set for a specific cryptocurrency.
Signals : Based on the Z-score, the indicator generates signals for accumulation or sale. If the Z-score falls below a certain threshold (negative), it may indicate an opportunity to accumulate the asset. Conversely, if the Z-score rises above a positive threshold, it could suggest a potential sell signal.
The indicator uses a color-coded system to provide traders with visual cues:
Green background indicates a signal to accumulate.
Orange (Red) background indicates a signal to sell.
Deviations exceeding the specified thresholds by 1 and 2 Z (positive direction), 0.5 and 1 Z (negative direction) are highlighted in a brighter color, indicating more extreme deviations.
Note: The signals provided by this indicator should not be considered financial advice. Traders should conduct their own research (DYOR) before making any investment decisions.
Parameters: The indicator provides several parameters for customization:
Blockchain : The blockchain for which the analysis is performed. This allows the user to select the specific blockchain they are interested in analyzing. The default value is BTC.
Z threshold for positive deviations : This parameter sets the threshold above which the deviation will be considered positive. A higher value will result in fewer signals, while a lower value may generate more false signals. The default value is 3.0.
Z threshold for negative deviations : Similar to the previous parameter, this sets the threshold below which the deviation will be considered negative. The default value is 0.
Market Capitalization : There are two types of market capitalization available: Standard and Free float coin capitalization. Free float is calculated by multiplying its current price by the total number of units in free circulation - the number that are not locked in any contracts or other forms of restriction. For DASH, ZEC, BAT and ALGO available only Free float capitalization. The default value is "Standard"
Negative Deviation Filter Mode : When enabled, if the deviation has been positive for a certain number of previous weeks (the default value is 40 weeks), the indicator will not generate a signal to accumulate. This helps to avoid false signals during the start of a bearish market. This may be helpful for volatile coins, whose price can drastically fall below the realized price after the end of a bull market. The default setting is "disabled".
Display Options:
MVRV plot : Displays the MVRV metric for the selected blockchain.
Z-Score plot : Shows the Z-score calculated by the indicator.
Realized Price plot : Provides a visual representation of the realized price of the cryptocurrency on main chart.
S ignal Display : Choose whether to display signals on the main chart or in a separate panel.
Historical mode : Choose whether to show signals for all historical data on the chart or for a certain number of periods. The default setting is "disabled".

Multiple Instrument Automation ScreenerI have developed a Pine Script indicator on TradingView designed to demonstrate how to automate execution for ten instruments. This example utilizes a straightforward, Simple Moving Average (SMA) indicator. You can use it as a template, but use your indicator.
The indicator computes long/short signals based on the crossing of the SMA using the security function
It acts as a screener, presenting calculation results in an organized table format.
Utilizing the varip variable, the indicator sends alerts for multiple instruments sequentially rather than simultaneously.
For every generated signal, the indicator builds and sends a JSON execution command to a third-party tool, ensuring seamless integration and automation. You can use your own format.
Sent alerts look like this:
{"ticker": "DOGEBTC","action": "buy","price": "0.00000199","time": "1719754620658"}
Details and Limitations
Instrument Limit: The example is configured for ten instruments for simplicity. However, it can be expanded to handle up to 40 instruments.
Alert Rate Limit: There is a rate limit of 15 alerts in 3 minutes. Exceeding this limit may cause some alerts to be stopped. This can be managed by tracking the alert times and delaying some alerts, though this may affect the entry prices.
Timing of Signal Generation : The indicator processes signals at the bar close to the active instrument. Due to its computational complexity, there is a slight delay in collecting all records, potentially causing signals to reflect a few seconds before the bar closes. Care should be taken when executing based on these signals.
Disclaimer
Please remember that past performance may not be indicative of future results.
Due to various factors, including changing market conditions, the strategy may no longer perform as well as in historical backtesting.
This post and the script don’t provide any financial advice.

Hindsight TrendNon-realtime but highly accurate trend analyzer with only one fundamental parameter ( period aka "minimum trend length")
Basically Hindsight Trend is pivot points on steroids (handles many cases much better). Plus it shows the trend line.
Period
I usually like periods of 10, 20 or 30.
The indicator's delay is identical to the chosen period.
You can actually try a low period like 4 or 5 to get something resembling a realtime indicator.
Uptrends are based on candle lows, downtrends are based on candle highs. So it is possible to have an uptrend and a downtrend at the same time.
Triangles
At trend start, a triangle is drawn. (Trendline isn't always there if the trend didn't last that long.)
Triangle size shows how long the high or low that started the trend remained unbroken. E.g. with period 20: Small triangle = 20+ candles, medium triangle = 40+ candles, big triangle = 80+ candles. So a big triangle marks an important reversal point.
How Hindsight Trend works
Whenever a candle completes, its high and low are saved as potentially "notable" points. A high or low is the more notable the longer it stays unbroken (= not touched again by price).
Now we simply take the notable highs and lows (as in, staying unbroken at least for the user-selected period)... and connect them together - if they are close enough to each other (less than "period" candles away). And decorate the first point in each trend with a triangle.
We only know whether a point is notable after "period" more candles have printed, so that's where the indicator's delay comes from.
Finally we divide the period by 2 and look at highs and lows which are unbroken for that shorter time. While they are not fully "notable" as defined above, we'll call them "semi-notable". Those points are only considered at the end of a trend, and help us extend the trend line a bit further.

Capitulation Candle for Bitcoin and Crypto V1.0 [ADRIDEM]Overview
The Capitulation Candle for Bitcoin and Crypto script identifies potential capitulation events in the cryptocurrency market. Capitulation candles indicate a significant sell-off, often marking a potential market bottom. This script highlights such candles by analyzing volume, price action, and other technical conditions. Below is a detailed presentation of the script and its unique features.
Unique Features of the New Script
Volume-Based Analysis : Uses a volume multiplier to detect unusually high trading volumes, which are characteristic of capitulation events. The default multiplier is 5.0, but it can be adjusted to suit different market conditions.
Support Level Detection : Looks back over a customizable period (default is 150 bars) to find support levels, helping to identify significant price breaks.
ATR-Based Range Condition : Ensures that the price range of a capitulation candle is a multiple of the Average True Range (ATR), confirming significant price movement. The default ATR multiplier is 10.0.
Dynamic Dot Sizes : Plots dots of different sizes below capitulation candles based on volume thresholds, providing a visual indication of the volume's significance.
Visual Indicators : Highlights capitulation candles and plots support levels, offering clear visual cues for potential market bottoms.
Originality and Usefulness
This script uniquely combines volume analysis, support level detection, and ATR-based range conditions to identify capitulation candles. The dynamic dot sizes and clear visual indicators make it an effective tool for traders looking to spot potential reversal points in the cryptocurrency market.
Signal Description
The script includes several features that highlight potential capitulation events:
High Volume Detection : Identifies candles with unusually high trading volumes using a customizable volume multiplier.
Support Level Breaks : Detects candles breaking significant support levels over a customizable lookback period.
ATR Range Condition : Ensures the candle's range is significant compared to the ATR, confirming substantial price movement.
Dynamic Dot Sizes : Plots small, normal, and large dots below candles based on different volume thresholds.
These features assist in identifying potential capitulation events and provide visual cues for traders.
Detailed Description
Input Variables
Volume Multiplier (`volMultiplier`) : Detects high-volume candles using this multiplier. Default is 5.0.
Support Lookback Period (`supportLookback`) : The period over which support levels are calculated. Default is 150.
ATR Multiplier (`atrMultiplier`) : Ensures the candle's range is a multiple of the ATR. Default is 10.0.
Small Volume Multiplier Threshold (`smallThreshold`) : Threshold for small dots. Default is 5.
Normal Volume Multiplier Threshold (`normalThreshold`) : Threshold for normal dots. Default is 10.
Large Volume Multiplier Threshold (`largeThreshold`) : Threshold for large dots. Default is 15.
Functionality
High Volume Detection : The script calculates the simple moving average (SMA) of the volume and checks if the current volume exceeds the SMA by a specified multiplier.
```pine
smaVolume = ta.sma(volume, supportLookback)
isHighVolume = volume > smaVolume * volMultiplier
```
Support Level Detection : Determines the lowest low over the lookback period to identify significant support levels.
```pine
supportLevel = ta.lowest(low , supportLookback)
isLowestLow = low == supportLevel
```
ATR Range Condition : Calculates the ATR and ensures the candle's range is significant compared to the ATR.
```pine
atr = ta.atr(supportLookback)
highestHigh = ta.highest(high, supportLookback)
rangeCondition = (highestHigh - low ) >= (atr * atrMultiplier)
```
Combining Conditions : Combines various conditions to identify capitulation candles.
```pine
isHigherVolumeThanNext = volume > volume
isHigherVolumeThanPrevious = volume > volume
bodySize = math.abs(close - open )
candleRange = high - low
rangeBiggerThanPreviousBody = candleRange > bodySize
isCapitulationCandle = isHighVolume and isHigherVolumeThanPrevious and isHigherVolumeThanNext and isLowestLow and rangeCondition and rangeBiggerThanPreviousBody
```
Dynamic Dot Sizes : Determines dot sizes based on volume thresholds and plots them below the identified capitulation candles.
```pine
isSmall = volume > smaVolume * smallThreshold and volume <= smaVolume * normalThreshold
isNormal = volume > smaVolume * normalThreshold and volume <= smaVolume * largeThreshold
isLarge = volume > smaVolume * largeThreshold
plotshape(series=isCapitulationCandle and isSmall, location=location.belowbar, offset=-1, color=color.rgb(255, 82, 82, 40), style=shape.triangleup, size=size.small)
plotshape(series=isCapitulationCandle and isNormal, location=location.belowbar, offset=-1, color=color.rgb(255, 82, 82, 30), style=shape.triangleup, size=size.normal)
plotshape(series=isCapitulationCandle and isLarge, location=location.belowbar, offset=-1, color=color.rgb(255, 82, 82, 20), style=shape.triangleup, size=size.large)
```
Plotting : The script plots support levels and highlights capitulation candles with different sizes based on volume significance.
```pine
plot(supportLevel, title="Support Level", color=color.rgb(255, 82, 82, 50), linewidth=1, style=plot.style_line)
```
How to Use
Configuring Inputs : Adjust the volume multiplier, support lookback period, ATR multiplier, and volume thresholds as needed.
Interpreting the Indicator : Use the plotted support levels and highlighted capitulation candles to identify potential market bottoms and reversal points.
Signal Confirmation : Look for capitulation candles with high volumes breaking significant support levels and meeting the ATR range condition. The dynamic arrow sizes help to assess the volume's significance.
This script provides a detailed and visual method to identify potential capitulation events in the cryptocurrency market, aiding traders in spotting possible reversal points and making informed trading decisions.
