Candle 1 2 3 on XAUUSD (by Veronica)Description
Discover the Candle 1 2 3 Strategy, a simple yet effective trading method tailored exclusively for XAUUSD on the 15-minute timeframe. Designed by Veronica, this strategy focuses on identifying key reversal and continuation patterns during the London and New York sessions, making it ideal for traders who prioritise high-probability entries during these active market hours.
Key Features:
1. Session-Specific Trading:
The strategy operates strictly during London (03:00–06:00 UTC) and New York (08:30–12:30 UTC) sessions, where XAUUSD tends to show higher volatility and clearer price movements.
Pattern Criteria:
- Works best if the first candle is NOT a pin bar or a doji.
- Third candle should either:
a. Be a marubozu (large body with minimal wicks).
a. Have a significant body with wicks, ensuring the close of the third candle is above Candle 2 (for Buy) or below Candle 2 (for Sell).
Callout Labels and Alerts:
Automatic Buy and Sell labels are displayed on the chart during qualifying sessions, ensuring clarity for decision-making.
Integrated alerts notify you of trading opportunities in real-time.
Risk Management:
Built-in Risk Calculator to estimate lot sizes based on your account size, risk percentage, and stop-loss levels.
Customizable Table:
Displays your calculated lot size for various stop-loss pip values, making risk management seamless and efficient.
How to Use:
1. Apply the indicator to XAUUSD (M15).
2. Focus on setups appearing within the London and New York sessions only.
3. Ensure the first candle is neither a pin bar nor a doji.
4. Validate the third candle's body placement:
For a Buy, the third candle’s close must be above the second candle.
For a Sell, the third candle’s close must be below the second candle.
5. Use the generated alerts to streamline your entry process.
Notes:
This strategy is meant to complement your existing knowledge of market structure and price action.
Always backtest thoroughly and adjust parameters to fit your personal trading style and risk tolerance.
Credit:
This strategy is the intellectual property of Veronica, developed specifically for XAUUSD (M15) traders seeking precision entries during high-volume sessions.
Search in scripts for "北京地铁3号线和12号线线路图"

VWMACD-MFI-OBV Composite# MACD-MFI-OBV Composite
A dynamic volume-based technical indicator combining Volume-Weighted MACD, Money Flow Index (MFI), and normalized On Balance Volume (OBV). This composite indicator excels at identifying breakouts and strong trend movements through multiple volume confirmations, making it particularly effective for momentum and high-volatility trading environments.
## Overview
The indicator integrates trend, momentum, and cumulative volume analysis into a unified visualization system. Each component is carefully normalized to enable direct comparison, while the background color system provides instant trend recognition. This version is specifically optimized for breakout detection and strong trend confirmation.
## Core Components
### Volume-Weighted MACD
Visualized through the background color system, this enhanced MACD implementation uses Volume-Weighted Moving Averages (VWMA) instead of traditional EMAs. This modification ensures greater sensitivity to volume-supported price movements while filtering out less significant low-volume price changes. The background alternates between green (bullish) and red (bearish) to provide immediate trend feedback.
### Money Flow Index (MFI)
Displayed as the purple line, the MFI functions as a volume-weighted momentum oscillator. Operating within a natural 0-100 range, it helps identify potential overbought and oversold conditions while confirming volume support for price movements. The MFI is particularly effective at validating breakout momentum.
### Normalized On Balance Volume (OBV)
The white line represents normalized OBV, providing insight into cumulative buying and selling pressure. The normalization process scales OBV to match other components while maintaining its ability to confirm price trends through volume analysis. This component excels at identifying strong breakout movements and volume surges.
## Signal Integration
The indicator generates its most powerful signals when all three components align, particularly during breakout conditions:
Strong Bullish Signals develop when:
- Background shifts to green (VWMACD bullish)
- MFI shows strong upward momentum
- OBV demonstrates sharp volume accumulation
Strong Bearish Signals emerge when:
- Background turns red (VWMACD bearish)
- MFI exhibits downward momentum
- OBV shows significant volume distribution
## Market Application
This indicator variant is specifically designed for:
Breakout Trading:
The OBV component provides excellent sensitivity to volume surges, making it ideal for breakout confirmation and momentum validation.
Trend Following:
Sharp OBV movements combined with MFI momentum help identify and confirm strong trending conditions.
High Volatility Markets:
The indicator's design excels in active, volatile markets where clear signal generation is crucial for decision-making.
## Technical Implementation
Default Parameters:
Volume-Weighted MACD maintains traditional periods (12/26/9) while leveraging volume weighting. MFI uses standard 14-period calculation with 80/20 overbought/oversold thresholds. All components undergo normalization over a 100-period lookback for stable comparison.
Visual Elements:
- Background: VWMACD trend indication (green/red)
- Purple Line: Money Flow Index
- White Line: Normalized OBV
- Yellow Line: Combined signal (arithmetic mean of normalized components)
- Reference Lines: Key levels at 20, 50, and 80
## Trading Methodology
The indicator supports a systematic approach to breakout and momentum trading:
1. Breakout Identification
Monitor for background color changes accompanied by significant OBV movement, indicating potential breakout conditions.
2. Volume Surge Confirmation
Examine OBV slope and magnitude to confirm genuine breakout scenarios versus false moves.
3. Momentum Validation
Use MFI to confirm breakout strength and identify potential exhaustion points.
4. Combined Signal Analysis
The yellow line provides a unified view of all components, helping identify high-probability breakout opportunities.
## Interpretation Guidelines
Breakout Confirmation:
Strong breakouts typically show alignment of all three components with notable OBV surge. This configuration often precedes significant price movements.
Trend Strength:
Continuous OBV expansion during trends, supported by steady MFI readings, suggests sustained momentum.
## Market Selection
Optimal Markets Include:
- High-beta growth stocks
- Momentum-driven securities
- Stocks with significant volatility
- Active trading instruments
- Examples: TSLA, NVDA, growth stocks
## Version Information
Current Version: 2.0.0
This indicator represents a specialized adaptation of volume-based analysis, optimized for breakout trading and momentum strategies in high-volatility environments.

Adaptive Fourier Transform Supertrend [QuantAlgo]Discover a brand new way to analyze trend with Adaptive Fourier Transform Supertrend by QuantAlgo , an innovative technical indicator that combines the power of Fourier analysis with dynamic Supertrend methodology. In essence, it utilizes the frequency domain mathematics and the adaptive volatility control technique to transform complex wave patterns into clear and high probability signals—ideal for both sophisticated traders seeking mathematical precision and investors who appreciate robust trend confirmation!
🟢 Core Architecture
At its core, this indicator employs an adaptive Fourier Transform framework with dynamic volatility-controlled Supertrend bands. It utilizes multiple harmonic components that let you fine-tune how market frequencies influence trend detection. By combining wave analysis with adaptive volatility bands, the indicator creates a sophisticated yet clear framework for trend identification that dynamically adjusts to changing market conditions.
🟢 Technical Foundation
The indicator builds on three innovative components:
Fourier Wave Analysis: Decomposes price action into primary and harmonic components for precise trend detection
Adaptive Volatility Control: Dynamically adjusts Supertrend bands using combined ATR and standard deviation
Harmonic Integration: Merges multiple frequency components with decreasing weights for comprehensive trend analysis
🟢 Key Features & Signals
The Adaptive Fourier Transform Supertrend transforms complex wave calculations into clear visual signals with:
Dynamic trend bands that adapt to market volatility
Sophisticated cloud-fill visualization system
Strategic L/S markers at key trend reversals
Customizable bar coloring based on trend direction
Comprehensive alert system for trend shifts
🟢 Practical Usage Tips
Here's how you can get the most out of the Adaptive Fourier Transform Supertrend :
1/ Setup:
Add the indicator to your favorites, then apply it to your chart ⭐️
Start with close price as your base source
Use standard Fourier period (14) for balanced wave detection
Begin with default harmonic weight (0.5) for balanced sensitivity
Start with standard Supertrend multiplier (2.0) for reliable band width
2/ Signal Interpretation:
Monitor trend band crossovers for potential signals
Watch for convergence of price with Fourier trend
Use L/S markers for trade entry points
Monitor bar colors for trend confirmation
Configure alerts for significant trend reversals
🟢 Pro Tips
Fine-tune Fourier parameters for optimal sensitivity:
→ Lower Base Period (8-12) for more reactive analysis
→ Higher Base Period (15-30) to filter out noise
→ Adjust Harmonic Weight (0.3-0.7) to control shorter trend influence
Customize Supertrend settings:
→ Lower multiplier (1.5-2.0) for tighter bands
→ Higher multiplier (2.0-3.0) for wider bands
→ Adjust ATR length based on market volatility
Strategy Enhancement:
→ Compare signals across multiple timeframes
→ Combine with volume analysis
→ Use with support/resistance levels
→ Integrate with other momentum indicators

Xmaster Formula Indicator [TradingFinder] No Repaint Strategies🔵 Introduction
The Xmaster Formula Indicator is a powerful tool for forex trading, combining multiple technical indicators to provide insights into market trends, support and resistance levels, and price reversals. Developed in the early 2010s, it is widely valued for generating reliable buy and sell signals.
Key components include Exponential Moving Averages (EMA) for identifying trends and price momentum, and MACD (Moving Average Convergence Divergence) for analyzing trend strength and direction.
The Stochastic Oscillator and RSI (Relative Strength Index) enhance accuracy by signaling potential price reversals. Additionally, the Parabolic SAR assists in identifying trend reversals and managing risk.
By integrating these tools, the Xmaster Formula Indicator provides a comprehensive view of market conditions, empowering traders to make informed decisions.
🔵 How to Use
The Xmaster Formula Indicator offers two distinct methods for generating signals: Standard Mode and Advance Mode. Each method caters to different trading styles and strategies.
Standard Mode :
In Standard Mode, the indicator uses normalized moving average data to generate buy and sell signals. The difference between the short-term (10-period) and long-term (38-period) EMAs is calculated and normalized to a 0-100 scale.
Buy Signal : When the normalized value crosses above 55, accompanied by the trend line turning green, a buy signal is generated.
Sell Signal : When the normalized value crosses below 45, and the trend line turns red, a sell signal is issued.
This mode is simple, making it ideal for traders looking for straightforward signals without the need for additional confirmations.
Advance Mode :
Advance Mode combines multiple technical indicators to provide more detailed and robust signals.
This method analyzes trends by incorporating :
🟣 MACD
Buy Signal : When the MACD histogram bars are positive.
Sell Signal : When the MACD histogram bars are negative.
🟣 RSI
Buy Signal : When RSI is below 30, indicating oversold conditions.
Sell Signal : When RSI is above 70, suggesting overbought conditions.
🟣 Stochastic Oscillator
Buy Signal : When Stochastic is below 20.
Sell Signal : When Stochastic is above 80.
🟣 Parabolic SAR
Buy Signal : When SAR is below the price.
Sell Signal : When SAR is above the price.
A signal is generated in Advance Mode only when all these indicators align :
Buy Signal : All conditions point to a bullish trend.
Sell Signal : All conditions indicate a bearish trend.
This mode is more comprehensive and suitable for traders who prefer deeper analysis and stronger confirmations before executing trades.
🔵 Settings
Method :
Choose between "Standard" and "Advance" modes to determine how signals are generated. In Standard Mode, signals are based on normalized moving average data, while in Advance Mode, signals rely on the combination of MACD, RSI, Stochastic Oscillator, and Parabolic SAR.
Moving Average Settings :
Short Length : The period for the short-term EMA (default is 10).
Mid Length : The period for the medium-term EMA (default is 20).
Long Length : The period for the long-term EMA (default is 38).
MACD Settings :
Fast Length : The period for the fast EMA in the MACD calculation (default is 12).
Slow Length : The period for the slow EMA in the MACD calculation (default is 26).
Signal Line : The signal line period for MACD (default is 9).
Stochastic Settings :
Length : The period for the Stochastic Oscillator (default is 14).
RSI Settings :
Length : The period for the Relative Strength Index (default is 14).
🔵 Conclusion
The Xmaster Formula Indicator is a versatile and reliable tool for forex traders, offering both simplicity and advanced analysis through its Standard and Advance modes. In Standard Mode, traders benefit from straightforward signals based on normalized moving average data, making it ideal for quick decision-making.
Advance Mode, on the other hand, provides a more detailed analysis by combining multiple indicators like MACD, RSI, Stochastic Oscillator, and Parabolic SAR, delivering stronger confirmations for critical market decisions.
While the Xmaster Formula Indicator offers valuable insights and reliable signals, it is important to use it alongside proper risk management and other analytical methods. By leveraging its capabilities effectively, traders can enhance their trading strategies and achieve better outcomes in the dynamic forex market.

Enhanced VIP-like IndicatorSettings Breakdown Tutorial: Optimizing a Trading Strategy
This guide explains the key trading strategy settings and how to customize them based on your trading style and goals. Each parameter is essential for tailoring the strategy to market conditions and your risk appetite.
1. Short Moving Average Length (Default: 9)
• Purpose: Tracks short-term trends using a small number of candles.
• Settings Tips:
• Smaller Values (e.g., 9): Quickly react to price changes, useful for fast-moving markets.
• Larger Values (e.g., 12-15): Generate smoother signals for less volatile trades.
2. Long Moving Average Length (Default: 21)
• Purpose: Identifies long-term trends.
• Settings Tips:
• Higher Values (e.g., 50): Spot broader trends at the expense of slower signals.
• Trend Analysis: The interaction of short and long MAs helps determine bullish or bearish trends (e.g., bullish when short MA crosses above long MA).
3. Higher Timeframe MA Length (Default: 200)
• Purpose: Filters long-term trends on a higher timeframe (e.g., daily).
• Settings Tips:
• 200 Periods: Standard for defining bullish (price above) or bearish (price below) markets.
• Adjustable: Use 100 for faster responses or stick with 200 for reliability.
4. Higher Timeframe (Default: 1 Day)
• Purpose: Defines the timeframe for the higher moving average.
• Settings Tips:
• Shorter Timeframes (e.g., 4 Hours): More frequent trading signals.
• Daily Timeframe: Best for swing trading and identifying macro trends.
5. RSI Length (Default: 14)
• Purpose: Measures momentum over a specific number of candles.
• Settings Tips:
• Lower Values (e.g., 7): More sensitive to price changes, ideal for quick trades.
• Higher Values (e.g., 20): Smooth signals for more stable markets.
6. RSI Overbought (70) and Oversold (30) Levels
• Purpose: Marks thresholds for overbought and oversold conditions.
• Settings Tips:
• Stricter Levels (e.g., 80/20): Fewer, higher-quality signals.
• Looser Levels (e.g., 65/35): More frequent signals, suitable for active trading.
7. Pivot Left Bars (5) and Pivot Right Bars (5)
• Purpose: Confirms pivot points (support/resistance) based on surrounding candles.
• Settings Tips:
• Higher Values (e.g., 10): Stronger but less frequent pivot points.
• Lower Values: More responsive, for traders seeking quick pivots.
8. Take Profit Percentage (Default: 2%)
• Purpose: Defines the profit level to exit trades.
• Settings Tips:
• Higher Values (e.g., 5%): For swing traders holding positions longer.
• Lower Values (e.g., 1%): For scalpers focusing on quick trades.
9. Minimum Volume (Default: 1,000,000)
• Purpose: Ensures sufficient liquidity for trading.
• Settings Tips:
• Lower Values: For lower-volume markets.
• Higher Values: Reduces risk in high-liquidity assets.
10. Stop Loss Percentage (Default: 1%)
• Purpose: Sets the maximum acceptable loss per trade.
• Settings Tips:
• Lower Values (e.g., 0.5%): Reduces risk, suited for conservative trading.
• Higher Values (e.g., 2%): Allows more price fluctuation, ideal for volatile markets.
11. Entry Conditions
• Options:
• MA Crossover & RSI: Combines trend-following and momentum for well-rounded signals.
• Pivot Breakout: Focuses on support/resistance breakouts for high-impact trades.
• Settings Tips:
• Trend-Following Traders: Use MA Crossover & RSI.
12. Exit Conditions
• Options:
• Opposite Signal: Exits when the trade’s opposite condition occurs (e.g., bullish to bearish).
• Fixed Take Profit/Stop Loss: Exits based on predefined profit/loss thresholds.
• Settings Tips:
• Opposite Signal: Ideal for trend-following strategies.
Summary
Customizing these settings aligns the strategy with your trading goals. Test configurations in a demo environment before live trading to refine the approach and optimize results. Always balance profit potential with risk management.
• Fixed Levels: Better for strict risk management.
• Breakout Traders: Opt for Pivot Breakout.

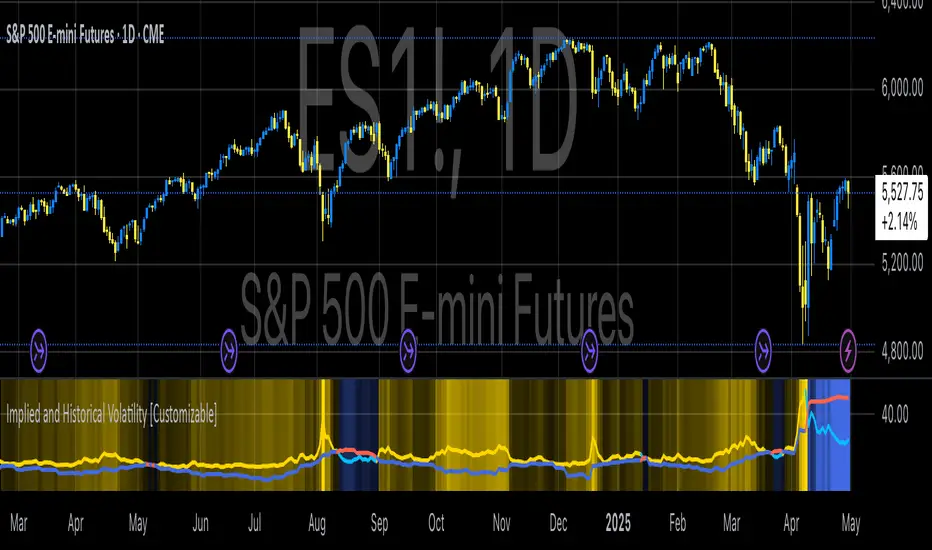
Implied and Historical VolatilityAbstract
This TradingView indicator visualizes implied volatility (IV) derived from the VIX index and historical volatility (HV) computed from past price data of the S&P 500 (or any selected asset). It enables users to compare market participants' forward-looking volatility expectations (via VIX) with realized past volatility (via historical returns). Such comparisons are pivotal in identifying risk sentiment, volatility regimes, and potential mispricing in derivatives.
Functionality
Implied Volatility (IV):
The implied volatility is extracted from the VIX index, often referred to as the "fear gauge." The VIX represents the market's expectation of 30-day forward volatility, derived from options pricing on the S&P 500. Higher values of VIX indicate increased uncertainty and risk aversion (Whaley, 2000).
Historical Volatility (HV):
The historical volatility is calculated using the standard deviation of logarithmic returns over a user-defined period (default: 20 trading days). The result is annualized using a scaling factor (default: 252 trading days). Historical volatility represents the asset's past price fluctuation intensity, often used as a benchmark for realized risk (Hull, 2018).
Dynamic Background Visualization:
A dynamic background is used to highlight the relationship between IV and HV:
Yellow background: Implied volatility exceeds historical volatility, signaling elevated market expectations relative to past realized risk.
Blue background: Historical volatility exceeds implied volatility, suggesting the market might be underestimating future uncertainty.
Use Cases
Options Pricing and Trading:
The disparity between IV and HV provides insights into whether options are over- or underpriced. For example, when IV is significantly higher than HV, options traders might consider selling volatility-based derivatives to capitalize on elevated premiums (Natenberg, 1994).
Market Sentiment Analysis:
Implied volatility is often used as a proxy for market sentiment. Comparing IV to HV can help identify whether the market is overly optimistic or pessimistic about future risks.
Risk Management:
Institutional and retail investors alike use volatility measures to adjust portfolio risk exposure. Periods of high implied or historical volatility might necessitate rebalancing strategies to mitigate potential drawdowns (Campbell et al., 2001).
Volatility Trading Strategies:
Traders employing volatility arbitrage can benefit from understanding the IV/HV relationship. Strategies such as "long gamma" positions (buying options when IV < HV) or "short gamma" (selling options when IV > HV) are directly informed by these metrics.
Scientific Basis
The indicator leverages established financial principles:
Implied Volatility: Derived from the Black-Scholes-Merton model, implied volatility reflects the market's aggregate expectation of future price fluctuations (Black & Scholes, 1973).
Historical Volatility: Computed as the realized standard deviation of asset returns, historical volatility measures the intensity of past price movements, forming the basis for risk quantification (Jorion, 2007).
Behavioral Implications: IV often deviates from HV due to behavioral biases such as risk aversion and herding, creating opportunities for arbitrage (Baker & Wurgler, 2007).
Practical Considerations
Input Flexibility: Users can modify the length of the HV calculation and the annualization factor to suit specific markets or instruments.
Market Selection: The default ticker for implied volatility is the VIX (CBOE:VIX), but other volatility indices can be substituted for assets outside the S&P 500.
Data Frequency: This indicator is most effective on daily charts, as VIX data typically updates at a daily frequency.
Limitations
Implied volatility reflects the market's consensus but does not guarantee future accuracy, as it is subject to rapid adjustments based on news or events.
Historical volatility assumes a stationary distribution of returns, which might not hold during structural breaks or crises (Engle, 1982).
References
Black, F., & Scholes, M. (1973). "The Pricing of Options and Corporate Liabilities." Journal of Political Economy, 81(3), 637-654.
Whaley, R. E. (2000). "The Investor Fear Gauge." The Journal of Portfolio Management, 26(3), 12-17.
Hull, J. C. (2018). Options, Futures, and Other Derivatives. Pearson Education.
Natenberg, S. (1994). Option Volatility and Pricing: Advanced Trading Strategies and Techniques. McGraw-Hill.
Campbell, J. Y., Lo, A. W., & MacKinlay, A. C. (2001). The Econometrics of Financial Markets. Princeton University Press.
Jorion, P. (2007). Value at Risk: The New Benchmark for Managing Financial Risk. McGraw-Hill.
Baker, M., & Wurgler, J. (2007). "Investor Sentiment in the Stock Market." Journal of Economic Perspectives, 21(2), 129-151.
Dynamic Volatility Differential Model (DVDM)The Dynamic Volatility Differential Model (DVDM) is a quantitative trading strategy designed to exploit the spread between implied volatility (IV) and historical (realized) volatility (HV). This strategy identifies trading opportunities by dynamically adjusting thresholds based on the standard deviation of the volatility spread. The DVDM is versatile and applicable across various markets, including equity indices, commodities, and derivatives such as the FDAX (DAX Futures).
Key Components of the DVDM:
1. Implied Volatility (IV):
The IV is derived from options markets and reflects the market’s expectation of future price volatility. For instance, the strategy uses volatility indices such as the VIX (S&P 500), VXN (Nasdaq 100), or RVX (Russell 2000), depending on the target market. These indices serve as proxies for market sentiment and risk perception (Whaley, 2000).
2. Historical Volatility (HV):
The HV is computed from the log returns of the underlying asset’s price. It represents the actual volatility observed in the market over a defined lookback period, adjusted to annualized levels using a multiplier of \sqrt{252} for daily data (Hull, 2012).
3. Volatility Spread:
The difference between IV and HV forms the volatility spread, which is a measure of divergence between market expectations and actual market behavior.
4. Dynamic Thresholds:
Unlike static thresholds, the DVDM employs dynamic thresholds derived from the standard deviation of the volatility spread. The thresholds are scaled by a user-defined multiplier, ensuring adaptability to market conditions and volatility regimes (Christoffersen & Jacobs, 2004).
Trading Logic:
1. Long Entry:
A long position is initiated when the volatility spread exceeds the upper dynamic threshold, signaling that implied volatility is significantly higher than realized volatility. This condition suggests potential mean reversion, as markets may correct inflated risk premiums.
2. Short Entry:
A short position is initiated when the volatility spread falls below the lower dynamic threshold, indicating that implied volatility is significantly undervalued relative to realized volatility. This signals the possibility of increased market uncertainty.
3. Exit Conditions:
Positions are closed when the volatility spread crosses the zero line, signifying a normalization of the divergence.
Advantages of the DVDM:
1. Adaptability:
Dynamic thresholds allow the strategy to adjust to changing market conditions, making it suitable for both low-volatility and high-volatility environments.
2. Quantitative Precision:
The use of standard deviation-based thresholds enhances statistical reliability and reduces subjectivity in decision-making.
3. Market Versatility:
The strategy’s reliance on volatility metrics makes it universally applicable across asset classes and markets, ensuring robust performance.
Scientific Relevance:
The strategy builds on empirical research into the predictive power of implied volatility over realized volatility (Poon & Granger, 2003). By leveraging the divergence between these measures, the DVDM aligns with findings that IV often overestimates future volatility, creating opportunities for mean-reversion trades. Furthermore, the inclusion of dynamic thresholds aligns with risk management best practices by adapting to volatility clustering, a well-documented phenomenon in financial markets (Engle, 1982).
References:
1. Christoffersen, P., & Jacobs, K. (2004). The importance of the volatility risk premium for volatility forecasting. Journal of Financial and Quantitative Analysis, 39(2), 375-397.
2. Engle, R. F. (1982). Autoregressive conditional heteroskedasticity with estimates of the variance of United Kingdom inflation. Econometrica, 50(4), 987-1007.
3. Hull, J. C. (2012). Options, Futures, and Other Derivatives. Pearson Education.
4. Poon, S. H., & Granger, C. W. J. (2003). Forecasting volatility in financial markets: A review. Journal of Economic Literature, 41(2), 478-539.
5. Whaley, R. E. (2000). The investor fear gauge. Journal of Portfolio Management, 26(3), 12-17.
This strategy leverages quantitative techniques and statistical rigor to provide a systematic approach to volatility trading, making it a valuable tool for professional traders and quantitative analysts.

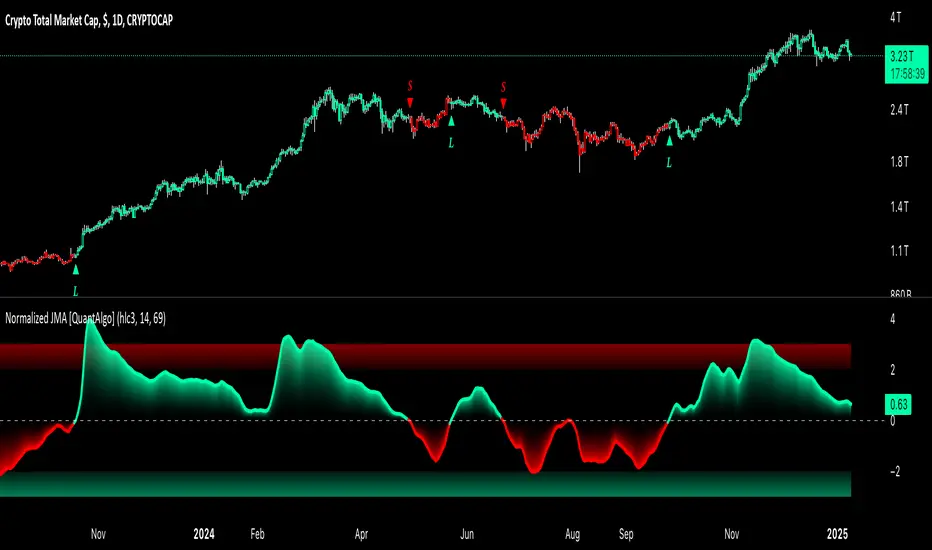
Normalized Jurik Moving Average [QuantAlgo]Upgrade your investing and trading strategy with the Normalized Jurik Moving Average (JMA) , a sophisticated oscillator that combines adaptive smoothing with statistical normalization to deliver high-quality signals! Whether you're a swing trader looking for momentum shifts or a medium- to long-term investor focusing on trend validation, this indicator's statistical approach offers valuable analytical advantages that can enhance your trading and investing decisions!
🟢 Core Architecture
The foundation of this indicator lies in its unique dual-layer calculation system. The first layer implements the Jurik Moving Average, known for its superior noise reduction and responsiveness, while the second layer applies statistical normalization (Z-Score) to create standardized readings. This sophisticated approach helps identify significant price movements while filtering out market noise across various timeframes and instruments.
🟢 Technical Foundation
Three key components power this indicator are:
Jurik Moving Average (JMA): An advanced moving average calculation that provides superior smoothing with minimal lag
Statistical Normalization: Z-Score based scaling that creates consistent, comparable readings across different market conditions
Dynamic Zone Detection: Automatically identifies overbought and oversold conditions based on statistical deviations
🟢 Key Features & Signals
The Normalized JMA delivers market insights through:
Color-adaptive oscillator line that reflects momentum strength and direction
Statistically significant overbought/oversold zones for trade validation
Smart gradient fills between signal line and zero level for enhanced visualization
Clear long (L) and short (S) markers for validated momentum shifts
Intelligent bar coloring that highlights the current market state
Customizable alert system for both bullish and bearish setups
🟢 Practical Usage Tips
Here's how to maximize your use of the Normalized JMA:
1/ Setup:
Add the indicator to your favorites, then apply it to your chart ⭐️
Begin with the default smoothing period for balanced analysis
Use the default normalization period for optimal signal generation
Start with standard visualization settings
Customize colors to match your chart preferences
Enable both bar coloring and signal markers for complete visual feedback
2/ Reading Signals:
Watch for L/S markers - they indicate validated momentum shifts
Monitor oscillator line color changes for direction confirmation
Use the built-in alert system to stay informed of potential trend changes
🟢 Pro Tips
Adjust Smoothing Period based on your trading style:
→ Lower values (8-12) for more responsive signals
→ Higher values (20-30) for more stable trend identification
Fine-tune Normalization Period based on market conditions:
→ Shorter periods (20-25) for more dynamic markets
→ Longer periods (40-50) for more stable markets
Optimize your analysis by:
→ Using +2/-2 zones for primary trade signals
→ Using +3/-3 zones for extreme market conditions
→ Combining with volume analysis for trade confirmation
→ Using multiple timeframe analysis for strategic context
Combine with:
→ Volume indicators for trade validation
→ Price action for entry timing
→ Support/resistance levels for profit targets
→ Trend-following indicators for directional bias
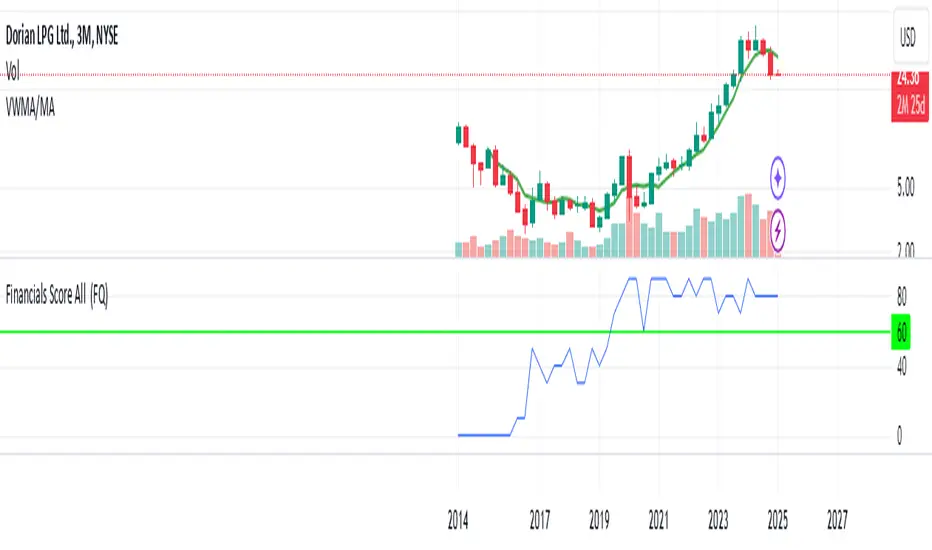
Financials Score All Description of the "Financials Score All" Script
This Pine Script calculates a financial score for a specific stock, based on various financial metrics. The purpose is to provide a comprehensive numerical score that reflects the financial health of the stock. The score is calculated using multiple financial indicators, including profitability, valuation, debt management, and liquidity. Here’s a breakdown of what each part of the script does:
period = input.string('FQ', 'Period', options= )
FQ refers to Quarterly financial data.
FY refers to Fiscal Year financial data.
Financial Metrics:
The script uses various financial metrics to calculate the score. These are obtained via request.financial, which retrieves financial data for the stock from TradingView's database. Below are the metrics used:
opmar (Operating Margin): Measures the company's profitability as a percentage of revenue.
eps (Earnings Per Share): Represents the portion of a company's profit allocated to each outstanding share.
eps_ttm (Earnings Per Share – Trailing Twelve Months): EPS over the most recent 12 months.
pe_ratio (Price-to-Earnings Ratio): A measure of the price investors are willing to pay for a stock relative to its earnings.
pb_ratio (Price-to-Book Ratio): A valuation ratio comparing a company’s market value to its book value.
de_ratio (Debt-to-Equity Ratio): A measure of the company’s financial leverage, showing how much debt it has compared to shareholders' equity.
roe_pb (Return on Equity Adjusted to Book): Measures the company's profitability relative to its book value.
fcf_per_share (Free Cash Flow per Share): Represents the free cash flow available for dividends, debt reduction, or reinvestment, per share.
pfcf_ratio (Price-to-Free-Cash-Flow Ratio): A measure comparing a company’s market value to its free cash flow.
current_ratio (Current Ratio): A liquidity ratio that measures a company's ability to pay short-term obligations with its current assets.
RSI Calculation:
The script calculates the Relative Strength Index (RSI) for the stock using an 8-period lookback:
rsi = ta.rsi(close, 8)
Score Calculation:
The script calculates a total score by adding points based on the values of the financial metrics. Each metric is checked against a condition, and if the condition is met, the score is incremented:
If the Operating Margin (opmar) is greater than 20, the score is incremented by 20 points.
If Earnings Per Share (EPS) is positive, 10 points are added.
If the P/E ratio is between 0 and 20, 10 points are added.
If the P/B ratio is less than 3, 10 points are added.
If the Debt-to-Equity ratio is less than 0.8, 10 points are added.
If the Return on Equity Adjusted to Book is greater than 10, 10 points are added.
If the P/FCF ratio is between 0 and 15, 10 points are added.
If the Current Ratio is greater than 1.61, 10 points are added.
If the RSI is less than 35, 10 points are added.
The score is accumulated based on these conditions and stored in the total_score variable.
Displaying the Total Score:
Finally, the total score is plotted on the chart:
Summary of How It Works:
This script calculates a financial score for a stock using a variety of financial indicators. Each metric has a threshold, and when the stock meets certain criteria (for example, a good operating margin, a healthy debt-to-equity ratio, or a low P/E ratio), points are added to the overall score. The result is a single numerical value that reflects the financial health of the stock.
This score can help traders or investors identify companies with strong financials, or serve as a comparison tool between different stocks based on their financial health.
Generally >60 is the best stocks for med and long term trades
Uptrick: Volatility Reversion BandsUptrick: Volatility Reversion Bands is an indicator designed to help traders identify potential reversal points in the market by combining volatility and momentum analysis within one comprehensive framework. It calculates dynamic bands around a simple moving average and issues signals when price interacts with these bands. Below is a fully expanded description, structured in multiple sections, detailing originality, usefulness, uniqueness, and the purpose behind blending standard deviation-based and ATR-based concepts. All references to code have been removed to focus on the written explanation only.
Section 1: Overview
Uptrick: Volatility Reversion Bands centers on a moving average around which various bands are constructed. These bands respond to changes in price volatility and can help gauge potential overbought or oversold conditions. Signals occur when the price moves beyond certain thresholds, which may imply a reversal or significant momentum shift.
Section 2: Originality, Usefulness, Uniqness, Purpose
This indicator merges two distinct volatility measurements—Bollinger Bands and ATR—into one cohesive system. Bollinger Bands use standard deviation around a moving average, offering a baseline for what is statistically “normal” price movement relative to a recent mean. When price hovers near the upper band, it may indicate overbought conditions, whereas price near the lower band suggests oversold conditions. This straightforward construction often proves invaluable in moderate-volatility settings, as it pinpoints likely turning points and gauges a market’s typical trading range.
Yet Bollinger Bands alone can falter in conditions marked by abrupt volatility spikes or sudden gaps that deviate from recent norms. Intraday news, earnings releases, or macroeconomic data can alter market behavior so swiftly that standard-deviation bands do not keep pace. This is where ATR (Average True Range) adds an important layer. ATR tracks recent highs, lows, and potential gaps to produce a dynamic gauge of how much price is truly moving from bar to bar. In quieter times, ATR contracts, reflecting subdued market activity. In fast-moving markets, ATR expands, exposing heightened volatility on each new bar.
By overlaying Bollinger Bands and ATR-based calculations, the indicator achieves a broader situational awareness. Bollinger Bands excel at highlighting relative overbought or oversold areas tied to an established average. ATR simultaneously scales up or down based on real-time market swings, signaling whether conditions are calm or turbulent. When combined, this means a price that barely crosses the Bollinger Band but also triggers a high ATR-based threshold is likely experiencing a volatility surge that goes beyond typical market fluctuations. Conversely, a price breach of a Bollinger Band when ATR remains low may still warrant attention, but not necessarily the same urgency as in a high-volatility regime.
The resulting synergy offers balanced, context-rich signals. In a strong trend, the ATR layer helps confirm whether an apparent price breakout really has momentum or if it is just a temporary spike. In a range-bound market, standard deviation-based Bollinger Bands define normal price extremes, while ATR-based extensions highlight whether a breakout attempt has genuine force behind it. Traders gain clarity on when a move is both statistically unusual and accompanied by real volatility expansion, thus carrying a higher probability of a directional follow-through or eventual reversion.
Practical advantages emerge across timeframes. Scalpers in fast-paced markets appreciate how ATR-based thresholds update rapidly, revealing if a sudden price push is routine or exceptional. Swing traders can rely on both indicators to filter out false signals in stable conditions or identify truly notable moves. By calibrating to changes in volatility, the merged system adapts naturally whether the market is trending, ranging, or transitioning between these phases.
In summary, combining Bollinger Bands (for a static sense of standard-deviation-based overbought/oversold zones) with ATR (for a dynamic read on current volatility) yields an adaptive, intuitive indicator. Traders can better distinguish fleeting noise from meaningful expansions, enabling more informed entries, exits, and risk management. Instead of relying on a single yardstick for all market conditions, this fusion provides a layered perspective, encouraging traders to interpret price moves in the broader context of changing volatility.
Section 3: Why Bollinger Bands and ATR are combined
Bollinger Bands provide a static snapshot of volatility by computing a standard deviation range above and below a central average. ATR, on the other hand, adapts in real time to expansions or contractions in market volatility. When combined, these measures offset each other’s limitations: Bollinger Bands add structure (overbought and oversold references), and ATR ensures responsiveness to rapid price shifts. This synergy helps reduce noisy signals, particularly during sudden market turbulence or extended consolidations.
Section 4: User Inputs
Traders can adjust several parameters to suit their preferences and strategies. These typically include:
1. Lookback length for calculating the moving average and standard deviation.
2. Multipliers to control the width of Bollinger Bands.
3. An ATR multiplier to set the distance for additional reversal bands.
4. An option to display weaker signals when the price merely approaches but does not cross the outer bands.
Section 5: Main Calculations
At the core of this indicator are four important steps:
1. Calculate a basis using a simple moving average.
2. Derive Bollinger Bands by adding and subtracting a product of the standard deviation and a user-defined multiplier.
3. Compute ATR over the same lookback period and multiply it by the selected factor.
4. Combine ATR-based distance with the Bollinger Bands to set the outer reversal bands, which serve as stronger signal thresholds.
Section 6: Signal Generation
The script interprets meaningful reversal points when the price:
1. Crosses below the lower outer band, potentially highlighting oversold conditions where a bullish reversal may occur.
2. Crosses above the upper outer band, potentially indicating overbought conditions where a bearish reversal may develop.
Section 7: Visualization
The indicator provides visual clarity through labeled signals and color-coded references:
1. Distinct colors for upper and lower reversal bands.
2. Markers that appear above or below bars to denote possible buying or selling signals.
3. A gradient bar color scheme indicating a bar’s position between the lower and upper bands, helping traders quickly see if the price is near either extreme.
Section 8: Weak Signals (Optional)
For those preferring early cues, the script can highlight areas where the price nears the outer bands. When weak signals are enabled:
1. Bars closer to the upper reversal zone receive a subtle marker suggesting a less robust, yet still noteworthy, potential selling area.
2. Bars closer to the lower reversal zone receive a subtle marker suggesting a less robust, yet still noteworthy, potential buying area.
Section 9: Simplicity, Effectiveness, and Lower Timeframes
Although combining standard deviation and ATR involves sophisticated volatility concepts, this indicator is visually straightforward. Reversal bands and gradient-colored bars make it easy to see at a glance when price approaches or crosses a threshold. Day traders operating on lower timeframes benefit from such clarity because it helps filter out minor fluctuations and focus on more meaningful signals.
Section 10: Adaptability across Market Phases
Because both the standard deviation (for Bollinger Bands) and ATR adapt to changing volatility, the indicator naturally adjusts to various environments:
1. Trending: The additional ATR-based outer bands help distinguish between temporary pullbacks and deeper reversals.
2. Ranging: Bollinger Bands often remain narrower, identifying smaller reversals, while the outer ATR bands remain relatively close to the main bands.
Section 11: Reduced Noise in High-Volatility Scenarios
By factoring ATR into the band calculations, the script widens or narrows the thresholds during rapid market fluctuations. This reduces the amount of false triggers typically found in indicators that rely solely on fixed calculations, preventing overreactions to abrupt but short-lived price spikes.
Section 12: Incorporation with Other Technical Tools
Many traders combine this indicator with oscillators such as RSI, MACD, or Stochastic, as well as volume metrics. Overbought or oversold signals in momentum oscillators can provide additional confirmation when price reaches the outer bands, while volume spikes may reinforce the significance of a breakout or potential reversal.
Section 13: Risk Management Considerations
All trading strategies carry risk. This indicator, like any tool, can and does produce losing trades if price unexpectedly reverses again or if broader market conditions shift rapidly. Prudent traders employ protective measures:
1. Stop-loss orders or trailing stops.
2. Position sizing that accounts for market volatility.
3. Diversification across different asset classes when possible.
Section 14: Overbought and Oversold Identification
Standard Bollinger Bands highlight regions where price might be overextended relative to its recent average. The extended ATR-based reversal bands serve as secondary lines of defense, identifying moments when price truly stretches beyond typical volatility bounds.
Section 15: Parameter Customization for Different Needs
Users can tailor the script to their unique preferences:
1. Shorter lookback settings yield faster signals but risk more noise.
2. Higher multipliers spread the bands further apart, filtering out small moves but generating fewer signals.
3. Longer lookback periods smooth out market noise, often leading to more stable but less frequent trading cues.
Section 16: Examples of Different Trading Styles
1. Day Traders: Often reduce the length to capture quick price swings.
2. Swing Traders: May use moderate lengths such as 20 to 50 bars.
3. Position Traders: Might opt for significantly longer settings to detect macro-level reversals.
Section 17: Performance Limitations and Reality Check
No technical indicator is free from false signals. Sudden fundamental news events, extreme sentiment changes, or low-liquidity conditions can render signals less reliable. Backtesting and forward-testing remain essential steps to gauge whether the indicator aligns well with a trader’s timeframe, risk tolerance, and instrument of choice.
Section 18: Merging Volatility and Momentum
A critical uniqueness of this indicator lies in how it merges Bollinger Bands (standard deviation-based) with ATR (pure volatility measure). Bollinger Bands provide a relative measure of price extremes, while ATR dynamically reacts to market expansions and contractions. Together, they offer an enhanced perspective on potential market turns, ideally reducing random noise and highlighting moments where price has traveled beyond typical bounds.
Section 19: Purpose of this Merger
The fundamental purpose behind blending standard deviation measures with real-time volatility data is to accommodate different market behaviors. Static standard deviation alone can underreact or overreact in abnormally volatile conditions. ATR alone lacks a baseline reference to normality. By merging them, the indicator aims to provide:
1. A versatile dynamic range for both typical and extreme moves.
2. A filter against frequent whipsaws, especially in choppy environments.
3. A visual framework that novices and experts can interpret rapidly.
Section 20: Summary and Practical Tips
Uptrick: Volatility Reversion Bands offers a powerful tool for traders looking to combine volatility-based signals with momentum-derived reversals. It emphasizes clarity through color-coded bars, defined reversal zones, and optional weak signal markers. While potentially useful across all major timeframes, it demands ongoing risk management, realistic expectations, and careful study of how signals behave under different market conditions. No indicator serves as a crystal ball, so integrating this script into an overall strategy—possibly alongside volume data, fundamentals, or momentum oscillators—often yields the best results.
Disclaimer and Educational Use
This script is intended for educational and informational purposes. It does not constitute financial advice, nor does it guarantee trading success. Sudden economic events, low-liquidity times, and unexpected market behaviors can all undermine technical signals. Traders should use proper testing procedures (backtesting and forward-testing) and maintain disciplined risk management measures.

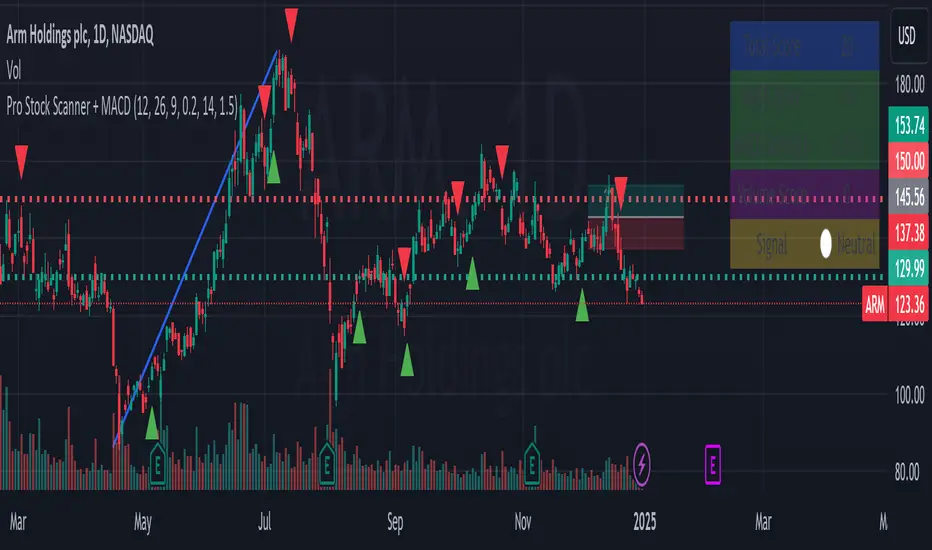
Pro Stock Scanner + MACD# Pro Stock Scanner - Advanced Trading System
### Professional Scanning System Combining MACD, Momentum & Technical Analysis
## 🎯 Indicator Purpose
This indicator was developed to identify high-quality trading opportunities by combining:
- Strong positive momentum
- Clear technical trend
- Significant trading volume
- Precise MACD signals
## 💡 Core Mechanics
The indicator is based on three core components:
### 1. Advanced MACD Analysis (40%)
- MACD line crossover tracking
- Momentum strength measurement
- Positive/negative divergence detection
- Score range: 0-40 points
### 2. Trend Analysis (40%)
- Moving average relationships (MA20, MA50)
- Primary trend direction
- Current trend strength
- Score range: 0-40 points
### 3. Volume Analysis (20%)
- Comparison with 20-day average volume
- Volume breakout detection
- Score range: 0-20 points
## 📊 Scoring System
Total score (0-100) composition:
```
Total Score = MACD Score (40%) + Trend Score (40%) + Volume Score (20%)
```
### Score Interpretation:
- 80-100: Strong Buy Signal 🔥
- 65-79: Developing Bullish Trend ⬆️
- 50-64: Neutral ↔️
- 0-49: Technical Weakness ⬇️
## 📈 Chart Markers
1. **Large Blue Triangle**
- High score (80+)
- Positive MACD
- Bullish MACD crossover
2. **Small Triangles**
- Green: Bullish MACD crossover
- Red: Bearish MACD crossover
## 🎛️ Customizable Parameters
```
MACD Settings:
- Fast Length: 12
- Slow Length: 26
- Signal Length: 9
- Strength Threshold: 0.2%
Volume Settings:
- Threshold: 1.5x average
```
## 📱 Information Panel
Real-time display of:
1. Total Score
2. MACD Score
3. MACD Strength
4. Volume Score
5. Summary Signal
## ⚙️ Optimization Guidelines
Recommended adjustments:
1. **Bull Market**
- Decrease MACD sensitivity
- Increase volume threshold
- Focus on trend strength
2. **Bear Market**
- Increase MACD sensitivity
- Stricter trend conditions
- Higher score requirements
## 🎯 Recommended Trading Strategy
### Phase 1: Initial Scan
1. Look for 80+ total score
2. Verify sufficient trading volume
3. Confirm bullish MACD crossover
### Phase 2: Validation
1. Check long-term trend
2. Identify nearby resistance levels
3. Review earnings calendar
### Phase 3: Position Management
1. Set clear stop-loss
2. Define realistic profit targets
3. Monitor score changes
## ⚠️ Important Notes
1. This indicator is a supplementary tool
2. Combine with fundamental analysis
3. Strict risk management is essential
4. Not recommended for automated trading
## 📈 Usage Examples
Examples included:
1. Successful buy signal
2. Trend reversal identification
3. False signal analysis and lessons learned
## 🔄 Future Updates
1. RSI integration
2. Advanced alerts
3. Auto-optimization features
## 🎯 Key Benefits
1. Clear scoring system
2. Multiple confirmation layers
3. Real-time market feedback
4. Customizable parameters
## 🚀 Getting Started
1. Add indicator to chart
2. Adjust parameters if needed
3. Monitor information panel
4. Wait for strong signals (80+ score)
## 📊 Performance Metrics
- Success rate: Monitor and track
- Best performing in trending markets
- Optimal for swing trading
- Most effective on daily timeframe
## 🛠️ Technical Details
```pine
// Core components
1. MACD calculation
2. Volume analysis
3. Trend confirmation
4. Score computation
```
## 💡 Pro Tips
1. Use multiple timeframes
2. Combine with support/resistance
3. Monitor sector trends
4. Consider market conditions
## 🤝 Support
Feedback and improvement suggestions welcome!
## 📜 License
MIT License - Free to use and modify
## 📚 Additional Resources
- Recommended timeframes: Daily, 4H
- Best performing markets: Stocks, ETFs
- Optimal market conditions: Trending markets
- Risk management guidelines included
## 🔍 Final Notes
Remember:
- No indicator is 100% accurate
- Always use proper position sizing
- Combine with other analysis tools
- Practice proper risk management
// @version=5
// @description Pro Stock Scanner - Advanced trading system combining MACD, momentum and volume analysis
// @author AviPro
// @license MIT
//
// This indicator helps identify high-quality trading opportunities by analyzing:
// 1. MACD momentum and crossovers
// 2. Trend strength and direction
// 3. Volume patterns and breakouts
//
// The system provides:
// - Total score (0-100)
// - Visual signals on chart
// - Information panel with key metrics
// - Customizable parameters
//
// IMPORTANT: This indicator is for educational and informational purposes only.
// Always conduct your own analysis and use proper risk management.
//
// If you find this indicator helpful, please consider leaving a like and comment!
// Feedback and suggestions for improvement are always welcome.
Buy/Sell Signals (MACD + RSI) 1HThis is a Pine Script indicator for TradingView that plots Buy/Sell signals based on the combination of MACD and RSI indicators on a 1-hour chart.
Description of the Code:
Indicator Setup:
The script is set to overlay the Buy/Sell signals directly on the price chart (using overlay=true).
The indicator is named "Buy/Sell Signals (MACD + RSI) 1H".
MACD Settings:
The MACD (Moving Average Convergence Divergence) uses standard settings of:
Fast Length: 12
Slow Length: 26
Signal Line Smoothing: 9
The MACD line and the Signal line are calculated using the ta.macd() function.
RSI Settings:
The RSI (Relative Strength Index) is calculated with a 14-period setting using the ta.rsi() function.
Buy/Sell Conditions:
Buy Signal:
Triggered when the MACD line crosses above the Signal line (Golden Cross).
RSI value is below 50.
Sell Signal:
Triggered when the MACD line crosses below the Signal line (Dead Cross).
RSI value is above 50.
Signal Visualization:
Buy Signals:
Green "BUY" labels are plotted below the price bars where the Buy conditions are met.
Sell Signals:
Red "SELL" labels are plotted above the price bars where the Sell conditions are met.
Chart Timeframe:
While the code itself doesn't enforce a specific timeframe, the name indicates that this indicator is intended to be used on a 1-hour chart.
To use it effectively, apply the script on a 1-hour chart in TradingView.
How It Works:
This indicator combines MACD and RSI to generate Buy/Sell signals:
The MACD identifies potential trend changes or momentum shifts (via crossovers).
The RSI ensures that Buy/Sell signals align with broader momentum (e.g., Buy when RSI < 50 to avoid overbought conditions).
When the defined conditions for Buy or Sell are met, visual signals (labels) are plotted on the chart.
How to Use:
Copy the code into the Pine Script editor in TradingView.
Save and apply the script to your 1-hour chart.
Look for:
"BUY" signals (green): Indicating potential upward trends or buying opportunities.
"SELL" signals (red): Indicating potential downward trends or selling opportunities.
This script is simple and focuses purely on providing actionable Buy/Sell signals based on two powerful indicators, making it ideal for traders who prefer a clean chart without clutter. Let me know if you need further customization!

ROE BandROE Band shows the return on net profit from shareholders' equity and the formula for decomposition
ROE = ROA x CSL x CEL
ROE Band consists of 5 parts:
1. ROE (TTM) is the 12-month ROE calculation in "green"
2. Return on Equity (ROE) is the current quarterly net profit / the average of the beginning and ending periods of shareholders' equity in "yellow"
3. Return on Assets (ROA) is the current quarterly NOPAT (net profit before tax) / the average of the beginning and ending periods of total assets in "blue"
4. Capital structure leverage (CSL) is a financial measure that compares a company's debt to its total capital. It is calculated by taking the average of the beginning and ending periods of total assets / the average of the beginning and ending periods of shareholders' equity. The higher the CSL, the more deb, in. "red"
5. Common earnings leverage (CEL) is the proportion of net profit and NOPAT (net profit before tax), where a lower CEL means more tax, in "orange"
The "😱" emoji represents the value if it increases by more than or decreases by less than 20%, e.g.
- ROE(TTM), ROE, ROA, CEL is decreasing
- CSL is increasing
The "🔥" emoji represents the value if it increases by more than or decreases, e.g.
- ROE(TTM), ROE, ROA, CEL is increasing
- CSL is decreasing

Sunil High-Frequency Strategy with Simple MACD & RSISunil High-Frequency Strategy with Simple MACD & RSI
This high-frequency trading strategy uses a combination of MACD and RSI to identify quick market opportunities. By leveraging these indicators, combined with dynamic risk management using ATR, it aims to capture small but frequent price movements while ensuring tight control over risk.
Key Features:
Indicators Used:
MACD (Moving Average Convergence Divergence): The strategy uses a shorter MACD configuration (Fast Length of 6 and Slow Length of 12) to capture quick price momentum shifts. A MACD crossover above the signal line triggers a buy signal, while a crossover below the signal line triggers a sell signal.
RSI (Relative Strength Index): A shorter RSI length of 7 is used to gauge overbought and oversold market conditions. The strategy looks for RSI confirmation, with a long trade initiated when RSI is below the overbought level (70) and a short trade initiated when RSI is above the oversold level (30).
Risk Management:
Dynamic Stop Loss and Take Profit: The strategy uses ATR (Average True Range) to calculate dynamic stop loss and take profit levels based on market volatility.
Stop Loss is set at 0.5x ATR to limit risk.
Take Profit is set at 1.5x ATR to capture reasonable price moves.
Trailing Stop: As the market moves in the strategy’s favor, the position is protected by a trailing stop set at 0.5x ATR, allowing the strategy to lock in profits as the price moves further.
Entry & Exit Signals:
Long Entry: Triggered when the MACD crosses above the signal line (bullish crossover) and RSI is below the overbought level (70).
Short Entry: Triggered when the MACD crosses below the signal line (bearish crossover) and RSI is above the oversold level (30).
Exit Conditions: The strategy exits long or short positions based on the stop loss, take profit, or trailing stop activation.
Frequent Trades:
This strategy is designed for high-frequency trading, with trade signals occurring frequently as the MACD and RSI indicators react quickly to price movements. It works best on lower timeframes such as 1-minute, 5-minute, or 15-minute charts, but can be adjusted for different timeframes based on the asset’s volatility.
Customizable Parameters:
MACD Settings: Adjust the Fast Length, Slow Length, and Signal Length to tune the MACD’s sensitivity.
RSI Settings: Customize the RSI Length, Overbought, and Oversold levels to better match your trading style.
ATR Settings: Modify the ATR Length and multipliers for Stop Loss, Take Profit, and Trailing Stop to optimize risk management according to market volatility.
Important Notes:
Market Conditions: This strategy is designed to capture smaller, quicker moves in trending markets. It may not perform well during choppy or sideways markets.
Optimizing for Asset Volatility: Adjust the ATR multipliers based on the asset’s volatility to suit the risk-reward profile that fits your trading goals.
Backtesting: It's recommended to backtest the strategy on different assets and timeframes to ensure optimal performance.
Summary:
The Sunil High-Frequency Strategy leverages a simple combination of MACD and RSI with dynamic risk management (using ATR) to trade small but frequent price movements. The strategy ensures tight stop losses and reasonable take profits, with trailing stops to lock in profits as the price moves in favor of the trade. It is ideal for scalping or intraday trading on lower timeframes, aiming for quick entries and exits with controlled risk.

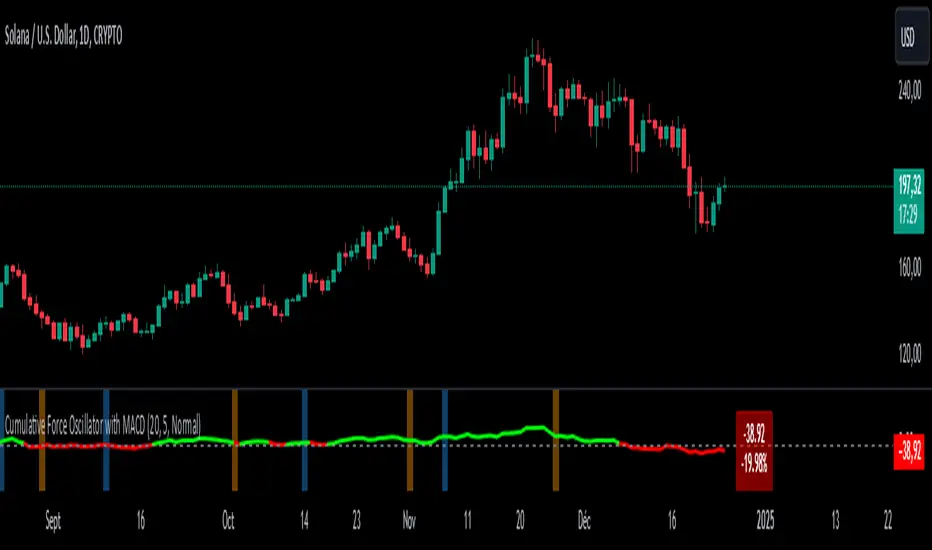
Cumulative Force Oscillator with MACDCumulative Force Oscillator with MACD
The Cumulative Force Oscillator with MACD is an advanced technical indicator designed to provide traders with a unique perspective on market momentum and trend strength. By combining the power of cumulative candle force analysis with MACD crossover signals, this indicator offers a multifaceted approach to market analysis.
Key Features
1. Cumulative Force Calculation**: Measures the net force of price movements over a specified number of candles.
2. MACD Integration**: Incorporates MACD crossover signals for additional trend confirmation.
3. Visual Cues**: Utilizes color-coded oscillator lines and background zones for easy interpretation.
4. **Dynamic Labeling**: Displays real-time force values and percentage changes.
How It Works
Cumulative Force Calculation
The indicator calculates the "force" of each candle by subtracting the open price from the close price. It then sums this force over a user-defined number of candles to create a cumulative force value. This value oscillates above and below zero, indicating bullish or bearish pressure respectively.
MACD Crossover Detection
The indicator uses the standard MACD (12, 26, 9) to detect bullish and bearish crossovers. These crossovers are visually represented by colored background zones, providing an additional layer of trend confirmation.
Visual Representation
- The main oscillator line is plotted in green when above zero (bullish) and red when below zero (bearish).
- Background colors change based on MACD crossovers: light blue for bullish crossovers and light orange for bearish crossovers.
- A dynamic label displays the current cumulative force value and its percentage change from the previous period.
Interpretation
1. Oscillator Line : When the line is above zero, it indicates net bullish pressure; below zero suggests net bearish pressure.
2. Oscillator Momentum : The steepness and direction of the oscillator line indicate the strength and direction of the current market force.
3. MACD Crossovers : Blue background zones suggest potential bullish trends, while orange zones indicate potential bearish trends.
4. Divergences : Look for divergences between the oscillator and price action for potential trend reversal signals.
Customization
Users can customize several aspects of the indicator :
- Number of candles for force calculation
- Label offset and text size
- Color schemes (through code modification)
Conclusion
The Cumulative Force Oscillator with MACD is a versatile tool that combines momentum analysis with trend confirmation signals. By providing a visual representation of cumulative market force alongside MACD crossovers, it offers traders a comprehensive view of market dynamics. This indicator can be particularly useful for identifying potential trend reversals, confirming existing trends, and gauging overall market strength.
Z-Strike RecoveryThis strategy utilizes the Z-Score of daily changes in the VIX (Volatility Index) to identify moments of extreme market panic and initiate long entries. Scientific research highlights that extreme volatility levels often signal oversold markets, providing opportunities for mean-reversion strategies.
How the Strategy Works
Calculation of Daily VIX Changes:
The difference between today’s and yesterday’s VIX closing prices is calculated.
Z-Score Calculation:
The Z-Score quantifies how far the current change deviates from the mean (average), expressed in standard deviations:
Z-Score=(Daily VIX Change)−MeanStandard Deviation
Z-Score=Standard Deviation(Daily VIX Change)−Mean
The mean and standard deviation are computed over a rolling period of 16 days (default).
Entry Condition:
A long entry is triggered when the Z-Score exceeds a threshold of 1.3 (adjustable).
A high positive Z-Score indicates a strong overreaction in the market (panic).
Exit Condition:
The position is closed after 10 periods (days), regardless of market behavior.
Visualizations:
The Z-Score is plotted to make extreme values visible.
Horizontal threshold lines mark entry signals.
Bars with entry signals are highlighted with a blue background.
This strategy is particularly suitable for mean-reverting markets, such as the S&P 500.
Scientific Background
Volatility and Market Behavior:
Studies like Whaley (2000) demonstrate that the VIX, known as the "fear gauge," is highly correlated with market panic phases. A spike in the VIX is often interpreted as an oversold signal due to excessive hedging by investors.
Source: Whaley, R. E. (2000). The investor fear gauge. Journal of Portfolio Management, 26(3), 12-17.
Z-Score in Financial Strategies:
The Z-Score is a proven method for detecting statistical outliers and is widely used in mean-reversion strategies.
Source: Chan, E. (2009). Quantitative Trading. Wiley Finance.
Mean-Reversion Approach:
The strategy builds on the mean-reversion principle, which assumes that extreme market movements tend to revert to the mean over time.
Source: Jegadeesh, N., & Titman, S. (1993). Returns to Buying Winners and Selling Losers: Implications for Stock Market Efficiency. Journal of Finance, 48(1), 65-91.

Support/Resistance
Custom Moving Average Indicator with MACD, RSI, and Support/Resistance
This indicator is designed to help traders make informed trading decisions by integrating several technical indicators, including moving averages, the Relative Strength Index (RSI), and the Moving Average Convergence Divergence (MACD).
Key Features:
Moving Averages:
This indicator uses simple moving averages (SMAs) for several periods (4, 18, 66, 89, 632, 1000, 1500, 2000, and 3000 bars). This helps to identify the overall trend of the price and potential support and resistance levels.
The color of each moving average line is dynamically changed based on the closing price's position relative to the average; it turns red if the price is above the average and green if the price is below.
Relative Strength Index (RSI):
The RSI is calculated for a 14-bar period, which is a measure of overbought or oversold conditions.
An RSI value above 70 indicates an overbought condition, while a value below 30 indicates an oversold condition.
MACD:
The MACD is calculated using a fast length of 12, a slow length of 26, and a signal length of 9. Crossovers between the MACD line and the signal line indicate momentum shifts.
A crossover of the MACD line above the signal line suggests a potential buy signal, while a crossover below indicates a potential sell signal.
Buy and Sell Signals:
Buy Signal: Triggered when the MACD line crosses above the signal line, the RSI is below 30, the MACD is above 0, and there is high volume.
Sell Signal: Triggered when the MACD line crosses below the signal line, the RSI is above 70, the MACD is below 0, and there is high volume.
Alerts:
The indicator includes alerts that are triggered when buy and sell signals occur, helping traders respond quickly to market opportunities.
How to Trade Using the Indicator (continued):
Trading on Buy Signals:
Look for buy signals when the MACD line crosses above the signal line. Ensure that the RSI is below 30, indicating there is a potential for price recovery from an oversold condition.
Confirm that the volume is above the average, which indicates strong market participation and adds validity to the trade.
Trading on Sell Signals:
Search for sell signals when the MACD line crosses below the signal line. Check that the RSI is above 70 to confirm an overbought condition, implying the price may decline.
As with buy signals, ensure that volume is high to validate the strength of the sell signal.
Risk Management:
Use stop-loss orders to protect your capital. Establish an initial loss threshold based on your risk management strategy.
Continuously monitor the market and new signals and adjust your approach according to your market analysis.
Conclusion:
This combined indicator helps traders make informed decisions by relying on a set of technical tools. To achieve the best results, ensure you integrate the analysis from these indicators with your trading strategies and other techniques.
Feel free to use this explanation as an introduction or guide to inform traders on how to effectively use the indicator. If you have any more questions or need further details, don't hesitate to ask!

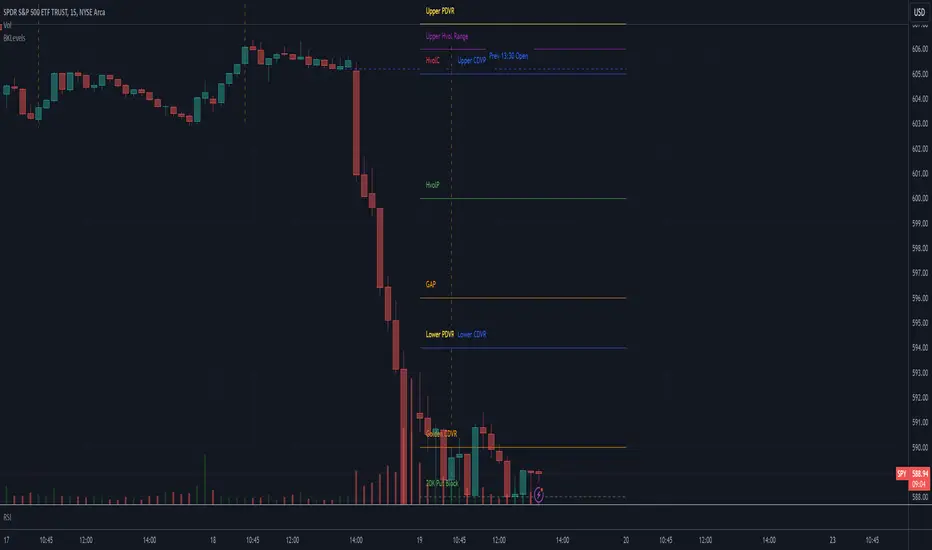
BKLevelsThis displays levels from a text input, levels from certain times on the previous day, and high/low/close from previous day. The levels are drawn for the date in the first line of the text input. Newlines are required between each level
Example text input:
2024-12-17
SPY,606,5,1,Lower Hvol Range,FIRM
SPY,611,1,1,Last 20K CBlock,FIRM
SPY,600,2,1,Last 20K PBlock,FIRM
SPX,6085,1,1,HvolC,FIRM
SPX,6080,2,1,HvolP,FIRM
SPX,6095,3,1,Upper PDVR,FIRM
SPX,6060,3,1,Lower PDVR,FIRM
For each line, the format is ,,,,,
For color, there are 9 possible user- configurable colors- so you can input numbers 1 through 9
For line style, the possible inputs are:
"FIRM" -> solid line
"SHORT_DASH" -> dotted line
"MEDIUM_DASH" -> dashed line
"LONG_DASH" -> dashed line
1-3-1 Strat Combo with 50% Level (12h)Logic Explanation
1-3-1 Combo Detection:
The script detects the 1-3-1 pattern using the previous 3 candles:
Candle 4: Inside Bar (Type 1).
Candle 3: Outside Bar (Type 3).
Candle 2: Inside Bar (Type 1).
4th Candle Behavior:
If the 4th candle (current bar):
Stays an inside bar (Type 1) → isFourthInsideBar is true.
Becomes a directional bar (Type 2) → isFourthDirectional is true.
If either of these conditions is true, the script stops calculating and waits for the next valid 1-3-1 setup.
50% Level Calculation:
If the conditions are not met (e.g., the 4th candle doesn’t stop the pattern), the script:
Plots a dotted line at the 50% level of the 3rd candle.
Adds a label showing the 50% level.
Stop Calculations:
No line, box, or label is drawn if the 4th candle is a Type 1 (inside bar) or Type 2 (directional bar).
Visual Outputs:
Dotted Box: Marks the 1-3-1 combo setup.
50% Line: Drawn only if the 4th candle does not invalidate the pattern.
Label: Displays the 50% level of the 3rd candle.
How to Use:
Apply this script on the 12-hour chart.
The script will:
Detect valid 1-3-1 patterns.
Stop drawing any calculations if the 4th candle is an inside bar (1) or a directional bar (2).
Wait for the next valid 1-3-1 combo.

Custom RSI & MACD Momentum Entry SignalsIndicator Explanation: Custom RSI & MACD Momentum Entry Signals
Introduction
The "Custom RSI & MACD Momentum Entry Signals" indicator combines the Relative Strength Index (RSI) and the Moving Average Convergence Divergence (MACD) to generate precise long and short entry signals. This indicator offers a powerful combination of overbought/oversold zones, momentum analysis, and RSI-EMA crossovers to assist traders in making better decisions.
How the Indicator Works
1. RSI Calculation and EMA
The RSI is calculated based on the closing price with an adjustable period (default: 14).
An Exponential Moving Average (EMA) of the RSI (default: 9) is plotted to identify RSI trend changes.
When the RSI crosses its EMA upwards, it signals a bullish impulse. Conversely, a downward cross indicates a bearish impulse.
2. MACD Calculation and Momentum Shifts
The MACD line is derived from the difference between a fast EMA (default: 12) and a slow EMA (default: 26).
The Signal line is the EMA of the MACD line (default: 9).
The MACD histogram represents the difference between the MACD line and the Signal line.
Momentum shifts are detected as follows:
Weakening Bearish: Histogram is negative but increasing (less bearish pressure).
Strengthening Bullish: Histogram is positive and rising.
Weakening Bullish: Histogram is positive but decreasing.
Strengthening Bearish: Histogram is negative and falling.
Signal Generation
Long Signals
A Long signal is triggered when all of the following conditions are met:
The RSI was previously below 30 (oversold condition).
MACD momentum shifts from "strengthening bearish" to "weakening bearish" or turns bullish.
The RSI crosses its EMA upwards.
A green upward arrow is displayed below the bar, and the background is lightly shaded green for additional visualization.
Short Signals
A Short signal is triggered when all of the following conditions are met:
The RSI was previously above 70 (overbought condition).
MACD momentum shifts from "strengthening bullish" to "weakening bullish" or turns bearish.
The RSI crosses its EMA downwards.
A red downward arrow is displayed above the bar, and the background is lightly shaded red for additional visualization.
Visual Elements
RSI and EMA:
The RSI is shown in purple.
The RSI EMA is shown in blue.
Horizontal lines at 30 (oversold) and 70 (overbought) provide additional context.
MACD:
The MACD line is displayed in blue.
The Signal line is displayed in orange.
The zero line is added for easier interpretation.
Signals:
Green arrows: Long signals.
Red arrows: Short signals.
Background color: Light green for long conditions, light red for short conditions.
Use Cases
This indicator is ideal for:
Trend Followers: Combining RSI and MACD allows traders to identify entry points during impulsive trend shifts.
Swing Traders: Long and short signals can be used at reversal points to capture short-term price movements.
Momentum Traders: By considering MACD momentum, the indicator provides additional confidence in signal generation.
Customizable Settings
The indicator provides flexible input options:
RSI Period (default: 14)
RSI EMA Period (default: 9)
MACD Parameters: Fast, slow, and signal EMAs can be adjusted.
Conclusion
The Custom RSI & MACD Momentum Entry Signals indicator is a powerful tool for traders looking to combine RSI and MACD to identify high-probability entry signals. With clear visualization and precise signal generation, traders can make decisions more efficiently and capitalize on market movements.

Candle Open Time labels (& TAPDA Lines)Description of the "4-Hour Candle Opening Times (TAPDA Lines)" Indicator
The "4-Hour Candle Opening Times (TAPDA Lines)" indicator integrates key principles of the Time and Price Action Trading Algorithm (TAPTA) with practical tools for analyzing market behavior. This script is designed for traders who leverage the interaction between time and price to identify opportunities in the market. The indicator supports the identification of significant price levels and potential areas of interest based on historical data and recurring patterns tied to specific timeframes.
Core Concepts
Time and Price Interaction (TAPTA Logic):
The script implements TAPTA principles by focusing on time intervals (4-hour candles) and the price action associated with those intervals.
Traders use this logic to recognize how prices behave at specific times, identifying patterns, levels of support or resistance, and potential reversals.
Highs and Lows Recognition (TAPDA):
The indicator includes logic for identifying and marking "Tapped Highs and Lows," which occur when price action retraces to previously significant levels within a specified tolerance. These taps are visually represented with horizontal lines, enabling traders to spot recurring price behaviors and levels of interest.
Dynamic Levels for Decision-Making:
By combining time and price, the script visualizes key price levels and their relevance over time, equipping traders with actionable insights for entry, exit, and risk management.
Indicator Features
1. Visual Representation of Candle Opening Times
The indicator marks the opening times of 4-hour candles on the chart.
A customizable label system displays the time in either a 12-hour or 24-hour format, with options to toggle the visibility of AM/PM suffixes.
2. TAPDA Logic
Identifies and highlights price levels that have been tapped within a specified tolerance.
Horizontal lines are drawn to mark these levels, allowing traders to see historical price levels acting as support or resistance.
The "Tapped Highs and Lows" are updated dynamically based on the most recent price action.
3. Timeframe-Specific Filtering
Users can limit the display to specific times of interest, such as 2 AM, 6 AM, and 10 AM, by toggling the "GCT (General Candle Times)" option.
Additional options allow filtering TAPDA logic by AM or PM timeframes, catering to traders who focus on specific market sessions.
4. Adjustable Plotting Limits
The script incorporates settings for controlling the maximum number of labels and lines displayed on the chart:
Max Labels: Limits the number of labels plotted for 4-hour candle opening times.
Max TAPDA Lines: Limits the number of TAPDA horizontal lines displayed.
A "Sync Lines and Labels" option ensures the same number of labels and lines are plotted when enabled, providing a consistent and clutter-free visualization.
5. Plot Maximum Capability
A "Plot Max" feature allows users to override the default behavior and force the plotting of the maximum allowed labels and lines, providing a comprehensive view of historical data.
6. User-Friendly Customization
Fully customizable label styles, including options for position, size, color, and background opacity.
Adjustable tolerance levels for TAPDA lines ensure compatibility with different market conditions and trading strategies.
Settings for flipping or aligning label positions above or below candles, or locking them to the opening price.
Script Logic
The script is built to prioritize efficiency and clarity, adhering to TradingView's Pine Script best practices and community standards:
Initialization:
Arrays are used to store historical price data, including highs, lows, and timestamps, ensuring only the necessary amount of data is processed.
A flexible and efficient data management system maintains a rolling window of data for both labels and TAPDA lines, ensuring smooth performance.
Label and Line Plotting:
Labels are plotted dynamically at user-defined positions and styles to mark the opening times of 4-hour candles.
TAPDA lines are drawn between historical high or low points and the current price action when the tolerance condition is met.
Limit Management:
The script enforces limits on the number of labels and lines plotted on the chart to maintain visual clarity.
Users can enable synchronization between the maximum labels and lines to ensure consistent visualization.
Customization Options:
Extensive customization settings allow traders to tailor the indicator to their strategies and preferences, including:
Label and line styles.
Session filtering (AM, PM, or specific times).
Display limits and synchronization options.
Capabilities
1. Enhance Time-Based Analysis
By marking significant times (4-hour candle openings), traders can identify key market phases and recurring behaviors tied to specific hours.
2. Leverage Historical Price Action
TAPDA logic highlights areas where price action interacts with historical highs and lows, providing actionable insights into potential support or resistance zones.
3. Improve Decision-Making
The indicator supports informed decision-making by blending visual data with time and price action principles, helping traders spot opportunities and mitigate risks.
4. Flexible Application Across Strategies
Suitable for day traders, swing traders, and position traders who utilize time and price action for trend analysis, reversals, or breakout strategies.
Best Practices for Use
Key Levels Analysis:
Focus on labels and TAPDA lines near critical price zones to gauge potential market reactions.
Session-Based Trading:
Use AM/PM filters or GCT settings to isolate specific trading sessions relevant to your strategy.
Combine with Other Indicators:
Enhance the effectiveness of this indicator by combining it with moving averages, RSI, or other tools for confirmation.
Risk Management:
Use the identified levels for stop-loss placement or target setting to align with your risk tolerance.
ATT + Key Levels with SessionsKey Features:
ATT Turning Point Numbers:
This input allows the user to define specific numbers (e.g., "3,11,17,29,41,47,53,59") that mark turning points in price action, which are checked using the bar_index modulo 60. If the current bar index matches one of these turning points, it triggers potential buy or sell signals.
RSI (Relative Strength Index):
The RSI is calculated based on a user-defined period (rsi_period), typically 14, and used to indicate overbought or oversold conditions. The script defines overbought (70) and oversold (30) levels, which are used to filter buy or sell signals.
Session Times:
The script includes predefined session times for major trading markets:
New York: From 9:30 AM EST to 4:00 PM EST.
London: From 8:00 AM GMT to 4:30 PM GMT.
Asia: From 12:00 AM GMT to 9:00 AM GMT.
These session times are used to restrict the buy and sell signals to specific market sessions.
Key Levels:
The script calculates and plots key market levels for the current day and week:
Daily High and Low: The highest and lowest prices of the current day.
Weekly High and Low: The highest and lowest prices of the current week.
These levels are plotted with different colors for visual reference.
Signal Logic:
Buy Signal: Triggered when the current bar is a turning point (according to the ATT model), the RSI is below the oversold threshold, and the current time is within the active session times (New York, London, or Asia).
Sell Signal: Triggered when the current bar is a turning point, the RSI is above the overbought threshold, and the current time is within the active session times.
Signal Limitations:
A user-defined limit (max_signals_per_session) controls the maximum number of signals that can be plotted within each session. This prevents excessive signal generation.
Plotting and Background Highlights:
Buy and Sell Signals: The script plots shapes (labels) above or below the bars to indicate buy or sell signals when the conditions are met.
Background Highlight: The background color is highlighted in yellow when the current bar matches one of the defined ATT turning points.
In Summary:
The indicator combines multiple technical factors to generate trading signals:
Turning points in price action (based on custom ATT numbers),
RSI levels (overbought/oversold),
Market session times (New York, London, Asia),
Key price levels (daily and weekly highs and lows).
This combination helps traders identify potential buying and selling opportunities while considering broader market dynamics and limiting the number of signals during each session.

Intraday -RSKWhat You See:
Session Boxes:
As you observe, the larger purple box represents the Asian Session, spanning from around 22:00 to 06:00 UTC. You notice how it captures the overnight market activity.
The smaller, greyish box marks the London Session, from about 08:00 to 12:00 UTC. You can see how the price action changes during this session.
The New York Session is also indicated, with vertical lines possibly marking the open and close, helping you track movements as the U.S. markets come into play.
High and Low Levels:
Horizontal lines are drawn at the high and low of each session. You can use these as potential support or resistance levels, aiding in your decision-making process.
Vertical Lines:
These lines likely correspond to specific key times, such as session opens or closes. You can quickly identify the transition between sessions, which is crucial for your timing.
Color Coding:
Each session is color-coded, making it easier for you to distinguish between them at a glance. The purple, grey, and additional lines offer a clear visual distinction.
How You Use It:
This indicator is your go-to for understanding how different market sessions affect price action. You’ll use it to:
Recognize important price levels within each session.
Identify potential entry and exit points based on session highs and lows.
Observe how the market transitions from one session to another, giving you insight into the best times to trade.
Customization:
You have the flexibility to adjust the settings. You can change session times to suit your trading hours, modify colors to match your chart theme, and even choose which sessions to display or hide based on your focus.
This tool is designed to enhance your analysis, providing you with a structured view of market sessions. With this indicator, you’re well-equipped to navigate the global markets with greater precision and confidence.
Open-source script